

Abstract
Herein we measure the effect of four adaptive non-synonymous mutations to the glycerol kinase (glpK) gene on catalytic function and regulation, to identify changes that correlate to increased fitness in glycerol media. The mutations significantly reduce affinity for the allosteric inhibitor fructose-1,6-bisphosphate (FBP) and formation of the tetramer, which are structurally related, in a manner that correlates inversely with imparted fitness during growth on glycerol, which strongly suggests that these enzymatic parameters drive growth improvement. Counterintuitively, the glpK mutations also increase glycerol-induced auto-catabolite repression that reduces glpK transcription in a manner that correlates to fitness. This suggests that increased specific GlpK activity is attenuated by negative feedback on glpK expression via catabolite repression, possibly to prevent methylglyoxal toxicity. We additionally report that glpK mutations were fixed in 47 of 50 independent glycerol-adapted lineages. By far the most frequently mutated locus (nucleotide 218) was mutated in 20 lineages, strongly suggesting this position has an elevated mutation rate. This study demonstrates that fitness correlations can be used to interrogate adaptive processes at the protein level and to identify the regulatory constraints underlying selection and improved growth.
Keywords: Allosteric Regulation, Bacterial Genetics, Bacterial Metabolism, Carbohydrate Metabolism, Enzyme Mutation, Evolution, Gene Regulation, Glycerol Kinase, Catabolite Repression, Mutation Hot Spot
Introduction
Adaptive mutations are selected specifically because the altered genetic locus significantly effects phenotype to improve fitness in the organism's current environment. As such, discovered adaptive single nucleotide polymorphisms provide an opportunity to study modulation of significant phenotype characteristics at the finest genetic level, and to determine the underlying molecular and biochemical mechanisms that mediate dynamic genetic control of phenotype.
In this study, we examine adaptive mutations to the glycerol kinase gene (glpK)3 that each independently improves growth on glycerol media. These mutations were acquired during 44-day adaptive evolution experiments of Escherichia coli on glycerol-supplemented M9 minimal medium, and were discovered by whole-genome resequencing in addition to mutations to other genes (1). Glycerol kinase was the only gene that acquired a non-synonymous mutation in all five adapted lineages.
The repeated acquisition of a mutation to the same gene suggests that the mutations are selected to alleviate a specific constraint related to the gene function. This constraint could be difficult to identify because non-synonymous mutations often alter many enzyme properties, as well as other distant interactions (1, 2). However, given a set of mutations that alleviate the same constraint with varying degrees of efficacy, the property under selection should stand out because of its correlation to fitness gain.
Glycerol kinase is the rate-limiting enzyme in glycerol metabolism (3), suggesting that the mutations alleviate insufficient in vivo GlpK activity during growth on glycerol. In this study, the effects of four adaptive GlpK mutants are profiled (Table 1). The fitness gains imparted by these mutants have previously been carefully measured (4), but they do not correlate with previously measured increases in Vmax (4, 5) suggesting the mutations increase in vivo activity by altering a different kinetic or regulatory parameter.
TABLE 1.
Description of examined adaptive GlpK mutants
| GlpK residue changea | glpK genetic locus | Glycerol-adapted lineage of originb | Effected GlpK domain | Relative fitness rankc | Growth rate of mutation straind | Selection rate over wild typec |
|---|---|---|---|---|---|---|
| h−1 | ×10−2h−1 | |||||
| V61L | g184t | GC | Tetramer formation surface | 1 | 0.326 ± 0.028 | 10.07 ± 0.90 |
| D72V | a218t | GA & GB | Tetramer formation surface/FBP binding site | 2 | 0.334 ± 0.026 | 9.82 ± 1.03 |
| M271I | g816a | GD | Conserved ATPase core domain II | 3 | 0.319 ± 0.020 | 7.90 ± 1.07 |
| Q37P | a113c | GE | Active site loop & Putative internal GlpR site in glpKe | 4 | 0.314 ± 0.022 | 5.84 ± 1.11 |
a Loci of changed residues differ from their description in Ref. 5 to conform to the convention of not counting the N-terminal methionine residue cleaved during protein translation.
b Strains further described in Ref. 5.
c Based on head-to-head pair-wise competitions in Ref. 4, with calculation described under “Experimental Procedures.”
d Average and standard deviation from five independent measurements. The error associated with the measurements is too large to definitively determine differences in fitness from the growth rate measurements alone, which is why selection rates calculated from direct pair-wise competitions are reported.
e Reported in Ref. 73.
Glycerol kinase catalyzes the Mg2+-ATP-dependent phosphorylation of glycerol to glycerol-3-phosphate (6). Its kinetics significantly diverge from Michaelis-Menten behavior due to substrate activation by ATP (7).
GlpK activity is regulated by multiple mechanisms, including allosteric inhibition by both fructose-1,6-bisphosphate (FBP) (8) and IIAGlc (the cytosolic subunit of the glucose-specific phosphotransferase system) (9, 10). These signals of glucose metabolism and uptake, respectively, inhibit GlpK activity during growth on glucose and other catabolically preferred substrates, although there is evidence that FBP inhibition is the dominant control mechanism (11).
In solution, the GlpK enzyme exists in a dimer-tetramer equilibrium that is thermodynamically and structurally coupled to FBP binding (12, 13). On one hand, the apparent dissociation constant of the dimer-tetramer reaction is dependent on the concentration of FBP. On the other, tetramer formation is required for FBP inhibition, making the apparent affinity for FBP dependent on the concentration of protein (10, 12, 14–16).
At the transcriptional level, the glpFKX operon is controlled by GlpR and CRP-cAMP. The glpFKX operon is repressed by GlpR in absence of intracellular glycerol (specific repression), though this repression is thought to be leaky since GlpK is required to produce glycerol-3-phosphate to alleviate GlpR repression. CRP-cAMP induces glpFKX expression when levels of cAMP are high and is considered necessary for strong expression as this operon is otherwise considered catabolite repressed.
EXPERIMENTAL PROCEDURES
E. coli Strains
All strains utilized in this study are derived from E. coli K-12 MG1655 (ATCC 47076), with the exception of those used for vector maintenance and protein expression described below. “Wild type” E. coli refers to genetically-unmodified MG1655 (ATCC 47076) stock strain. The GlpK mutant strains were derived in a previous study by introducing individual glpK mutations into the wild-type genome by λred recombination (5, 17).
Purification of Mutant Glycerol Kinase Enzymes (GlpK)
Cloning into pGEX-6P-1
Mutant and wild-type glpK sequences were cloned into vector pGEX-6P-1 (GE Healthcare) using the EcoRI and XhoI restriction sites. The mutant GlpK sequences were amplified by PCR from glycerol-evolved end point colonies (supplemental Table S1) (5), and validated by Sanger sequencing. It should be noted that the EcoRI restriction site is eight codons downstream from the PreScission protease cleavage site, which adds 8 residues (Gly-Pro-Leu-Gly-Ser-Pro-Glu-Phe-) to the N terminus of the expressed protein.
GlpK Overexpression
Mutant GlpK proteins were expressed from pGEX-6P-1 constructs transformed into One Shot BL21 star (DE3) E. coli (Invitrogen). Clones were grown in 2 × 200 ml cultures of LB ampicillin (100 μg/ml). Expression of GlpK mutants after addition of 1 mm IPTG was monitored by the 56 kDa band from SDS-PAGE analysis of whole lysate, visualized using SimplyBlue Safe Stain (Invitrogen). Optimal expression after IPTG addition was observed after 5 h.
GlpK Purification
Collected cells were lysed using lysozyme and sonication. GST-tagged GlpK enzymes were purified using 1 ml GSTrap FF columns (GE Healthcare). Before column loading, the sonicated lysate was clarified by centrifugation and filtration of the supernatant through a 0.45 μm syringe filter. GSTrap FF columns were used as described by the manufacturer except that 10 mm glycerol was added to both the binding buffer and the PreScission cleavage buffer to stabilize GlpK conformation, and 2 mm β-mercaptoethanol was added to the binding buffer to minimize oxidative damage. Glycerol kinase protein was eluted from the column by cleavage of the glutathione S-transferase domain by PreScission protease (GE Healthcare). SDS-PAGE of 10 mg the eluted protein showed a high concentration of ∼60 kDa protein corresponding to GlpK, and traces of three other unknown proteins that correspond to frequently co-purified chaperones (supplemental Fig. S1).
Gel-Permeation Chromatography
The apparent molecular weight of each GlpK allozyme was determined by small zone analytical gel permeation chromatography using an Akta Purifier HPLC system with a Bio-Gel 0.5 m column (1.0 × 30 cm). The column was equilibrated with standard buffer (0.1 m triethanolamine-HCl, pH 7.0, 2 mm glycerol, 1 mm EDTA, 1 mm β-mercaptoethanol), and calibrated as previously described (15). The column was injected with 0.1 mg of each variant protein in 0.2 ml of standard buffer, with a column flow rate of 0.25 ml/min. The apparent elution volume was determined by monitoring the absorbance at 280 nm, and the apparent molecular weight was estimated by using the column calibration curve.
Kinetic Assays
The enzymes were equilibrated with standard buffer by gel permeation chromatography. Enzyme concentrations and glycerol kinase activities at pH 7.0 and 25 °C were determined and catalytic and allosteric parameters were obtained from fits of initial-velocity enzyme kinetics data as described (18). Enzyme was assayed at 0.5 μg/ml concentration, unless otherwise noted. Glycerol was 2 mm in all assays. ATP was 2.5 mm for studies of FBP and IIAGlc inhibition. The results are presented as the best fit parameter ± S.E. as given from fits obtained with Kaleidagraph v. 3.51 (Synergy Software), unless otherwise noted.
Inhibition by FBP was analyzed by fitting the dependence of the specific activity (SA) on FBP concentration in Equation 1,
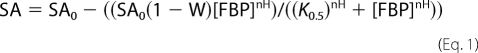 |
where SA refers to the SA at the indicated concentration of FBP, SA0 is the SA at 0 FBP, W is SA∞/SA0 with SA∞ the SA in the saturating presence of FBP, K0.5 is the FBP concentration that gives one-half maximal inhibition, and nH is the Hill coefficient. The inhibition parameters could not be independently estimated from fitting the data because the apparent FBP affinities were reduced so dramatically (see “Results”). To enable data for the variant enzymes to be fitted, the values for the Hill coefficient and W were fixed to the values obtained from the fits to the N-terminal extension native enzyme.
Inhibition by IIAGlc was analyzed by fitting the dependence of the SA on the concentration of IIAGlc in Equation 2,
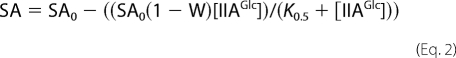 |
where, SA is the SA at the indicated concentration of IIAGlc, SA0 is the SA at 0 IIAGlc, W is SA∞/SA0 with SA∞ the SA in the saturating presence of IIAGlc, and K0.5 is the IIAGlc concentration that gives one-half maximal inhibition.
Growth Rate Measurements
Each culture was grown in 200–250 ml of M9 medium + 0.2% of carbon source in a 500-ml Erlenmeyer flask incubated at 30 °C by water bath and aerated by magnetic stir bar spinning at 1200–1400 rpm. The A600 of the cultures were measured every 40–80 min using a Thermo Spectronic BioMate3 spectrophotometer starting at ∼0.02 A culture density. At least three data points (linear fit R2 >0.99) were used to calculate each growth rate measurement, and the growth rate of each strain in each condition was measured on at least three different days.
Intracellular cAMP Assays
Samples of culture were collected during logarithmic growth at absorbances between 0.10–0.30, absorbance measured at 600 nm. Sample preparation was modeled after that described by A. Death et al. (19), using Millipore® 25-mm diameter 0.45-μm pore Triton-free nitrocellulose filters. The volume of culture passed through the filter was estimated from absorbance to contain approximately the same number of cells as 1 ml of culture with an absorbance of 1 (i.e. 5 ml was collected from a culture at 0.2 A). Cells on the filter were immediately washed with 10 ml of 30 °C fresh media to rinse away extracellular cAMP, and then the filter was quickly submerged in 5 ml of ice-cold 65% ethanol to quench cellular activity. The samples were immediately vortexed at the maximum setting for 5–10 s and stored at −20 °C (19). The solution was evaporated by speedvac, and the dried residue re-dissolved in the cAMP assay buffer provided with the cAMP Direct Biotrack EIA kit (GE Healthcare), which was used to assay cAMP levels using the manufacturer's instructions for the non-acetylation protocol. One-fifth of each sample was used per assay. Each strain was cultured in triplicate, and each sample was assayed twice.
Quantitative PCR
Three independent cultures of each strain were harvested during exponential growth. As described elsewhere (20, 21), RNA was isolated using Qiagen RNAprotect and RNeasy kit and 10 μg of RNA was converted to cDNA using random hexamers and Invitrogen SuperScript II reverse transcriptase. Each quantitative PCR (qPCR) reaction contained 5–10 ng of cDNA, 0.3 μm of each primer, and 12.5 μl of 2× SYBR Master Mix (Qiagen) (see supplemental Table S1 for primer sequences). Assays were measured by an iCycler iQ (Bio-Rad). Each qPCR reaction was performed in triplicate. The relative expression of each gene was calculated by normalization to the quantity of dmsA (assay for glpK in strain kA and kC versus wild type) or rrsB (all other assays).
qPCR results were analyzed using qGene software (22). The efficiency of each primer pair was calculated by generating a standard curve from qPCR of E. coli genomic DNA diluted 102-106-fold. Three technical replicates of each biological cDNA sample were assayed, and the Cq values averaged to calculate the mean normalized expression.
Statistical Analysis
Significant differences in growth rates, intracellular cAMP, and gene expression between each mutant strain and wild type in each growth condition were determined by one-way ANOVA with matching of co-acquired measurements, and Dunnett's multiple comparisons post-test against wild type values. These analyses were performed on GraphPad Prism software.
Pearson correlation coefficients were calculated with two-tails using GraphPad software. The fitness differences between wild type and the glpK mutant strains were not measured during the previous competition study (4), so the selection rate between wild type and the Q37P mutant was estimated from the measured growth rate difference between the strains (0.058 h−1 ± 0.016 (S.E.), from Table 1). A single relative fitness value for each mutant strain relative to the Q37P mutant was calculated from the pool of pair-wise competition measurements (4) by averaging all possible combinations of competitions that produce an estimated fitness difference between a particular pair when summed.
Laboratory Evolution of Additional Glycerol-adapted Strains
A total of 50 lineages were adaptively evolved on glycerol minimal medium to sample the variety of adaptive glycerol kinase mutations that may be acquired. Adaptation of lineages G1, G2, and GA-GE have been described elsewhere (1, 5, 23), and the same method was used to develop the additional 44 “eBOP” lineages. The lineages were evolved for 25 or 40 days (supplemental Table S2). Mutations to the glpK gene were identified by Sanger sequencing of PCR products with two sets of primers that amplify overlapping regions of the glpK gene, covering the region −100 bp upstream to 1,510 bp downstream of the transcription start site.
RESULTS
Mutant Glycerol Kinase Catalytic and Allosteric Properties
We measured the functional properties of each of four GlpK allozymes (Table 1), including initial velocity kinetics and sensitivity to allosteric inhibitors FBP and IIAGlc, to assess the relationship between changes to enzyme function and fitness caused by the mutations. Results of these assays are shown in Fig. 1 and Table 2. The effect of the N-terminal extension is summarized in Table 2 and supplemental Note S1 and was determined not to be significant.
FIGURE 1.

Kinetics of GlpK mutants. A and B, plot the dependence of the initial velocity (vo) of each GlpK variant on the concentration of ATP. The initial velocities have been normalized to the Vmax for each enzyme. The lines trace the fit of the data to the Michaelis-Menten equation. The values for Vmax and Km-ATP derived from this fit are shown in Table 2. C, FBP inhibition. The specific activity of each variant is shown at different concentrations of FBP. Specific activities (SA) were normalized based on the specific activity (SA0) of each enzyme with no FBP (100%). The lines show how the data were fitted to the equation modeling FBP inhibition (Eq. 1). The V61I mutant is not appreciably inhibited by FBP so its data could not be fit to the equation; however, simulations using different values of K0.5 suggest that it must be greater than 100 mm. SA0 and parameters from the fits are shown in Table 2. D, IIAGlc inhibition. The points show the specific activity (SA) at the indicated concentration of IIAGlc normalized to the specific activity at 0 IIAGlc. The lines show the fit to the equation that models IIAGlc inhibition (Eq. 2). Values for SA0 and parameters from the fits are shown in Table 2. Symbols for GlpK allozymes: wild type: filled circle, V61L: filled square, D72V: filled triangle, M271I: open circle, Q37P: open square.
TABLE 2.
Catalytic and allosteric properties of GlpK mutants
| GlpK residue change | Catalytic parametersa |
FBP inhibitionb |
IIAGlc inhibitionb |
Molecular weightc |
|||||||
|---|---|---|---|---|---|---|---|---|---|---|---|
| Vmax | Km ATP | Vmax/Km | SAo | W | nH | K0.5 | SAo, | W | K0.5 | Mr, app | |
| unit/mg | μm | L* min−1mg−1 | unit/mg | mm | unit/mg | μm | |||||
| V61L | 18 ± 0.4 | 6 ± 0.6 | 3 ± 0.1 | 55 ± 1 | NA | NA | >100 | 56 ± 1 | 0.12 ± 0.04 | 13 ± 2 | 114,000 |
| D72V | 24 ± 0.4 | 9 ± 1 | 2.7 ± 0.1 | 53 ± 1 | 0.015 | 1.3 | 21 ± 2 | 53 ± 1 | 0.07 ± 0.01 | 10 ± 1 | 138,000 |
| M271I | 77 ± 3 | 250 ± 20 | 0.31 ± 0.1 | 54 ± 3 | 0.015 | 1.3 | 16 ± 1 | 69 ± 1 | 0.23 ± 0.03 | 37 ± 4 | NDc |
| Q37P | 86 ± 3 | 190 ± 20 | 0.45 ± 0.1 | 80 ± 1 | 0.015 | 1.3 | 3.2 ± 0.1 | 80 ± 1 | 0.08 ± 0.03 | 10 ± 1 | 152,000 |
| N-termd | 16.2 ± 0.4 | 8.5 ± 0.8 | 1.9 ± 0.1 | 62 ± 1 | 0.015 ± 0.02 | 1.3 ± 0.1 | 0.52 ± 0.01 | 62 ± 1 | 0.01 ± 0.01 | 6 ± 0.6 | 162,000 |
| Native GlpK | 18.1 ± 0.4 | 7.8 ± 0.7 | 2.3 ± 0.1 | 62 ± 2 | 0.03 ± 0.026 | 1.7 ± 0.2 | 0.52 ± 0.04 | 64 ± 1 | 0.09 ± 0.02 | 6 ± 0.6 | 158,000 |
| Spearman re | 0.0 | −0.3 | 0.6 | −0.6 | 1.00 | −0.6 | 0.5 | 0.6 | −1.00 | ||
| p value | 0.0167 | 0.0833 | |||||||||
a Catalytic parameters are obtained from fits of the dependence of the initial velocity on [ATP] in the saturating presence of glycerol (10 mm) to the Michaelis-Menten equation. All values on chart are shown ± S.E.
b FBP and IIAGlc inhibition are determined at 2.5 mm ATP and 10 mm glycerol. SAo is the specific activity at 0 allosteric inhibitor and W is given by the ratio SA∞/SAo, where SA∞ is the specific activity in the saturating presence of the inhibitor. FBP inhibition shows cooperative homotropic effects, given by the Hill coefficient, nH. K0.5 is the concentration of inhibitor that gives one-half of the maximum inhibition. For fits of FBP inhibition for the variant enzymes, the values for W and nH were fixed to the values obtained for the enzyme with the N-terminal extension.
c Molecular weight of oligomeric GlpK as it exists in solution was measured by gel-permeation chromatography. The apparent molecular mass of the M271I mutant could not be determined because of its non-specific interaction with the column matrix. A similar problem was encountered for the G304S mutant, which disrupts the same residue interaction (25).
d Native GlpK enzyme carrying the same N-terminal extension (Gly-Pro-Leu-Gly-Ser-Pro-Glu-Phe) as the GlpK mutant enzymes, which remains after cleavage of the GST tag used to purify the proteins (See “Experimental Procedures” and supplemental notes).
e Correlation between the measured parameters and relative fitness imparted by the mutations is estimated using the non-parametric Spearman correlation coefficient, which was applied to parameters with measured differences across the mutants. The p-value is shown if the absolute value of Spearman r > 0.9. Measurements of the N-terminal wild type GlpK protein were used to calculate the coefficients.
Initial Velocity Catalytic Parameters
Native GlpK has two apparent Michaelis constants that describe how the initial velocity depends on ATP concentration, a high affinity constant of about 10 μm, and a lower affinity constant of about 2 mm (7). Estimating the apparent lower ATP affinity constant is problematic because GlpK also becomes substrate-inhibited by ATP at those concentrations. For this reason, we only examined the effect of the amino acid substitutions on catalytic parameters Km and Vmax at ATP concentrations that reveal changes to the high affinity constant. Results of these determinations show that the catalytic properties for the GlpK allozymes V61L and D72V differ little from those of the wild type GlpK. For allozymes M271I and Q37P, both Km for ATP and Vmax are increased. It is evident that the increased fitness observed across the GlpK mutant strains is not correlated with their catalytic properties, as shown by the poor associated Spearman correlations (Table 2).
Allosteric Inhibition
Allosteric inhibition of GlpK by FBP or IIAGlc was determined in the saturating presence of glycerol (2 mm) and near-saturating ATP (2.5 mm). When assayed under these conditions in the absence of the allosteric inhibitors, all of the GlpK allozymes show similar specific activity (SAo, Table 2). This differs from the strong effects the mutants had on Vmax in the initial-velocity studies because the activity in these assays is largely affected by the low affinity site for ATP.
Each of the fitness improving GlpK variants reduces the apparent affinity (K0.5) for the allosteric inhibitor FBP, as shown in Fig. 1C and Table 2. The V61L variant's FBP sensitivity was most dramatically altered, lacking any appreciable inhibition even at 10 mm FBP, but higher concentrations of FBP were not evaluated because of its weak binding to the dimer that reverses the inhibition (14).
The order by which the mutations increase K0.5-FBP correlates directly to their respective ability to increase fitness (Spearman correlation of 1, Table 2). Fig. 2A plots log10 of K0.5-FBP against the estimated selection coefficient of the GlpK mutant strains over wild type, showing an approximately linear relationship (Pearson coefficient r = 0.91, p = 0.03).
FIGURE 2.

Plots of the apparent dependence of relative fitness on (A) FBP affinity (log10 transformed), (B) apparent molecular weight (an indirect measure of the tetramer dissociation constant), (C) intracellular cAMP, and (D) glpK expression. Relative fitness is expressed as the approximate growth rate increase relative to wild type (h−1, × 100), calculated as described under “Experimental Procedures.” No trend line is included in panel (B) because the relationship does not appear to be linear. The FBP affinity of V61L is simply estimated to be >100 mm, but has been plotted as 150 mm ± 50 mm.
The GlpK allozymes also reduce allosteric control by IIAGlc (Fig. 1D). By far the biggest reduction in IIAGlc inhibition is caused by the M271I residue change, which decreases affinity 3-fold and allows the enzyme to retain ∼40% of its specific activity as it nears saturation with IIAGlc, compared with native GlpK which retains less than 10%. The other residue changes have significantly less impact on sensitivity to IIAGlc inhibition, and the changes do not correlate to imparted fitness gains, suggesting this parameter is not under consistent selection.
Tetramerization
As described in the introduction, in solution GlpK exists in a dimer-tetramer equilibrium. This equilibrium is thermodynamically coupled to FBP binding as the apparent dissociation constant of the dimer-tetramer reaction is dependent on FBP concentration, and the apparent affinity for FBP is dependent on the concentration of protein because tetramer formation is required for FBP inhibition (10, 12, 14–16). A structural basis for this interaction is indicated by the effects of residue changes (S58W, A65T) to an α-helix that is a major tetramer interface, which simultaneously reduce tetramer formation in solution and abolish FBP inhibition (15, 16).
Because the examined GlpK mutants reduce FBP inhibition, their effect on tetramer-dimer equilibrium was also examined. To do so we employed small-zone analytical gel permeation chromatography as previously described (15, 16). For these experiments, 100 μg of each GlpK allozyme contained in 0.2 ml (9 μm subunits) was injected onto a calibrated gel permeation chromatography column. The enzyme load is eluted in about 5 ml of buffer, suggesting the enzyme concentration is diluted from 9 μm (subunits) to 300 nm (subunits) as the sample passes through the column if uniform distribution of the enzyme in the elution volume is assumed. This reduces the protein concentration below the saturation point for tetramer formation, and the resulting apparent molecular weight will reflect the shift in the dimer-tetramer equilibrium. For interacting systems at protein concentrations that are sufficient to allow some polymerization but insufficient for saturation of the association reaction, small-zone analytical gel permeation chromatography measures an undefined average molecular weight, which lies between the molecular weights of the largest and smallest species. The dissociation constant cannot be determined using this method, but because the same protein concentration is used for each enzyme the generated apparent molecular weights can be compared. As shown from the range of measured apparent molecular weights in Table 2, this assay provides a quite sensitive indicator of the dissociation constant of each allozyme.
The apparent molecular weights of the assayed enzymes (Table 2) are all considerably less than that of the tetramer, 224,000, indicating that the protein has been diluted below the tetramer saturation concentration. The apparent molecular weight of the wild-type enzyme is 158,000, indicating the protein concentration used was sufficiently low to shift the dimer-tetramer equilibrium toward the dimer, and this value agrees closely with earlier work using the same column conditions (15, 16).
The apparent molecular weight of each of the fitness-improving GlpK allozymes is lower than the wild type enzyme, indicating the amino acid substitutions shift the dimer-tetramer equilibrium of each allozyme toward the dimer. As discussed below, the sites of most of the substitutions are in the tetramer interface and are expected to perturb tetramer formation.
Similar to FBP inhibition, reduced apparent molecular weight correlates directly to increased fitness across the mutants (Fig. 2B), though this relationship is non-linear. The perfect qualitative correlation (Spearman coefficient r = 1)) is supported with a p value of 0.083, which is the most significant p value this test can provide from four data points (M271I could not be assayed due to interaction with the column matrix). This correlation indicates the amino acid substitutions progressively shift the dimer-tetramer equilibrium toward the dimer, and that this effect positively impacts fitness.
The apparent molecular weight of the V61L allozyme approaches that of the dimer, indicating that tetramer formation does not appreciably occur at the protein concentrations used in gel permeation chromatography (∼300 nm, subunits). This is substantially higher than the protein concentration in the initial velocity studies (9 nm, subunits), suggesting that the V61L allozyme lost sensitivity to FBP in the activity assay due to the inability to form tetramers at the assayed enzyme concentration.
The D72V and Q37P mutants also have reduced apparent molecular weight compared with the wild type enzyme, indicating these substitutions also increase the dissociation constant of the tetramer, though to less extent than V61L. This suggests that their measured increases in K0.5-FBP also result from reduced tetramer formation in the assays. The correlations of fitness with both apparent molecular weight and K0.5 for FBP suggest that the effects of the amino acid substitutions on tetramer formation with the resultant effect on FBP inhibition provide the molecular basis for the improved fitness that is observed with these mutations.
Effect of glpK Mutations on Auto-regulation
In addition to observing the effects of the mutations on GlpK kinetics, we also examined whether the allozymes affect regulation of glpK expression. This was examined in isogenic strains that each carry the relevant mutation in the genomic copy of the glpK gene in the E. coli MG1655 wild type genetic background (4, 5).
Expression of glpK
We measured glpK expression in the wild type parent and the four GlpK mutant strains during logarithmic growth by quantitative PCR. This revealed that glycerol kinase expression is greatly reduced (13–66% of wild-type expression) in each of the glpK mutant strains (Table 3). Reduced GlpK expression is also indicated from assays of whole-cell lysates, which show lower GlpK activity in GlpK mutant strains compared with wild type (supplemental Fig. S2). Reduced expression of glpK has previously been associated with loss of FBP sensitivity in GlpK mutants (6, 11). Significantly, like reduced FBP sensitivity, reduced glpK expression correlates to increased glycerol fitness across the set of strains (Pearson coefficient r = −0.98, p = 0.003), as shown in Fig. 2D.
TABLE 3.
Expression changes of catabolite regulated genes in GlpK mutant strains
| GlpK residue change |
glpK (repressed)a |
aceE (activated) |
aspA (repressed) |
|||
|---|---|---|---|---|---|---|
| % wt expression S.D. | p valueb | % wt expression S.D. | p value | % wt expression S.D. | p value | |
| V61L | 12.71% ± 8.13% | 1.4E-04 | 148.90% ± 43.24% | 6.6E-04 | 15.57% ± 4.55% | 1.1E-06 |
| D72V | 14.76% ± 12.03% | 1.9E-03 | 117.70% ± 33.06% | 0.14 | 15.50% ± 4.24% | 1.0E-06 |
| M271I | 30.75% ± 12.50% | 3.6E-07 | 270.13% ± 204.63% | 1.8E-04 | 25.12% ± 23.43% | 4.7E-03 |
| Q37P | 65.73% ± 22.75% | 2.4E-03 | 290.70% ± 218.60% | 6.5E-05 | 42.48% ± 46.59% | 0.12 |
| Correlation to Relative Fitnessc | −0.98 | 0.003 | 0.17 | (p = 0.78) | −0.99 | 0.0005 |
a Indicates effect of catabolite repression on transcription of gene.
b Two-tailed one-way ANOVA with Dunnett's post-test were performed on measurements of normalized gene enrichment between wild type and glpK-mutant strains, assuming equal variance. Measured differences in expression that did not meet statistical significance criteria (p < 0.05) have been italicized.
c Correlation to relative fitness determined by calculating the Pearson coefficient between gene expression and relative strain fitness, with associated two-tailed p values. Correlation coefficients were calculated with wild type as a data point (100% expression).
glpK Mutations Induce Auto-catabolite Repression
Expression of the glpFKX operon is repressed by GlpR in absence of intracellular glycerol (specific repression) and by CRP when levels of cAMP are low (catabolite repression). Because GlpR repression should be alleviated during growth on glycerol, repression of glpFKX by catabolite repression was suspected. As shown in Fig. 3, intracellular cAMP levels in the four GlpK mutant strains are significantly reduced, showing only 30–50% of the amount measured in the wild type strain. Reductions in cAMP levels correlate to both reduced glpK expression (Pearson r = 0.91, p = 0.03) and increased glycerol fitness (Pearson r = −0.97, p = 0.006, Fig. 2C).
FIGURE 3.

Glycerol kinase mutant strains have reduced intracellular cAMP. Intracellular cAMP concentrations in four glycerol kinase mutant strains are significantly reduced compared with wild type (p = 0.0022, two-tailed one-way ANOVA with Dunnett's post-test). Bars represent average of three independent measurements ± S.D.
We additionally measured transcription levels of two other genes whose expression is regulated by cAMP levels, aspartate ammonia-lyase (aspA), and pyruvate dehydrogenase EI component (aceE) (24). Transcription of one of these genes, aspA, changed in a manner strongly consistent with decreased catabolite repression, with loss of expression correlating nearly linearly with observed cAMP reduction (Pearson coefficient r = 0.96, p = 0.008) and increased glycerol fitness (Pearson r = −0.99, p = 0.0005) across the GlpK mutant strains. Differences in aceE transcription between the mutant strains did not correlate well to corresponding differences in fitness or cAMP levels, but was increased in the GlpK mutant strains overall compared with wild type, consistent with increased catabolite repression.
Overall, differences in intracellular cAMP levels and transcription of catabolite-regulated genes indicate that the GlpK mutants significantly increase auto-catabolite repression during growth on glycerol, and the strong inverse correlation between cAMP levels and fitness suggest the two parameters are related.
Frequency of GlpK Mutations
To further examine the adaptive plasticity of the E. coli genome in response to glycerol media, an additional 44 glycerol-evolved lineages were generated and screened for mutations in glpK, bringing the total number of glycerol-evolved lineages to 50. Single non-synonymous glpK mutations were fixed or nearly fixed in 94% (47/50) of the populations (Table 4 and supplemental Table S2), with no single colony isolated harboring more than one glpK mutation.
TABLE 4.
Mutation frequency of various GlpK residues acquired from laboratory evolution of 50 total lineages on glycerol minimal medium
| Residue changea | No. of lineages | |
|---|---|---|
| D72 | A (13), V (7) | 20 |
| M271 | I (3) | 4 |
| A18 | S, T | 2 |
| G94 | D, Gb | 2 |
| G235 | ins. KGG, A | 2 |
| Q37P | 1 | |
| V61L | 1 | |
| Other mutations acquired by only a single strainc | 16 | |
| No glpK mutation | 3 | |
| Multiple glpK mutationsd | 1 |
a Residue change is shown with the locus if the locus was only altered in one lineage; otherwise the resulting residues are shown in the second column. If the locus was altered in multiple lineages, the number of times it was altered to a particular residue is given in parentheses. The residue changes examined in detail in this study are shown in bold.
b One synonymous mutation discovered, G-94-G, which results from nucleotide change g285a.
c Loci of all discovered GlpK mutations in supplemental Table II.
d Three different glpK mutations were detected in one lineage (eBOP86) (supplemental Table S2). This population harbored competing GlpK mutants in different subpopulations, as confirmed by Sanger sequencing of individual colonies.
This large collection of strains allows us to examine the relative frequency that mutations fix to various GlpK loci. Most of loci mutated were only fixed in a single lineage, including GlpK V61L and Q37P. Only five codons were repeatedly mutated across multiple lineages, as summarized in Table 4.
The Asp-72 residue was by far the most frequently altered, mutated in 20 of the 50 lineages by substitution of the same nucleotide (glpK 218). Asp-72 was altered to valine in 7 lineages and alanine in 13 lineages (Table 4). The extraordinarily high frequency of fixed mutations to the glpK 218 locus is too high to be due to preferred selection alone, since the spontaneous mutation rate is too low to account for mutations to this locus even being sampled so consistently within the given adaptation period (supplemental Note S4, estimated binomial pdf p = 3E-17). This strongly suggests that the glpK 218 allele has an elevated mutation rate.
DISCUSSION
The aim of this study was to investigate the biochemical mechanism by which adaptive GlpK mutants improve fitness during growth on glycerol in minimal medium. Mutations often alter many enzyme parameters, but most of the parameter effects do not impact fitness. To identify the causal changes we characterized four mutant enzymes to identify changes that correlate to fitness during growth on glycerol (4). Below we interpret these results to develop an improved understanding of GlpK, glycerol metabolism, and the observed adaptation process.
Structure-Function Analysis of the Variant GlpK EnzymesGlpK V61L
The V61L mutant imparts the largest fitness increase during growth on glycerol minimal medium among the four allozymes studied (Table 1), and essentially eliminates FBP affinity and tetramer formation (Fig. 1C and Table 2). Residue 61 sits within an α-helix that is critical to tetramer stability. Mutations to two near-by residues (A65T and S58W) have also been shown to disrupt tetramer formation and abolish FBP inhibition (15, 16). This particular residue was only altered in one lineage, but six other lineages acquired mutations within five residues of this locus (supplemental Table S2), and it is likely that they all increase fitness by abolishing FBP inhibition.
GlpK D72V
The GlpK D72V mutation is located near the C-terminal end of the same α-helix impacted by V61L. The carboxylate group of Asp-72 forms a salt bridge with Lys-232, which is in the loop that binds to FBP. A GlpK D72N allozyme has been structurally characterized, and the loss of the carboxyl group was hypothesized to disrupt the electrostatic interactions of the region important to tetramer formation (15). The hydrophobic side chains of both valine and alanine should also significantly disrupt those interactions.
GlpK M271I
The widespread effects of this mutant, which significantly reduces the enzyme sensitivity to both FBP and IIAGlc and alters its catalytic activity, likely results from the exchanged residue being in the conserved ATPase core. Similar wide-spread effects were observed when a residue that interacts with Met-271 in the ATPase core, Gly-304, was exchanged for serine. This glycine is hydrogen-bonded to the carbonyl oxygen of Met-271 through its backbone amide (25), suggesting these mutations alter many of the same interactions.
The Vmax of the M271I enzyme is almost 5-fold higher than wild type GlpK. However, this residue change produces a single observed Michaelis constant instead of the two observed in the native enzyme. This single Michaelis constant is 20-fold higher (250 μm) than the native GlpK high affinity constant, suggesting the M271I variant has reduced enzymatic efficiency. This could result in less turnover at low concentrations of ATP, though it is unlikely that this would much impact in vivo activity since intracellular ATP concentrations are generally kept much higher (>2 mm) (26) than the reduced affinity constant (0.25 mm, Table 2).
GlpK Q37P
Though the GlpK Q37P variant causes the smallest fitness increase among the four GlpK variants examined, it still significantly improves growth on glycerol minimal medium relative to native GlpK (∼0.06 h−1, ∼20% increase). The altered residue is part of the conserved ATPase catalytic core, on a loop in domain I (27). This loop undergoes a conformational change upon glycerol binding in the glycerol kinase of Enterococcus casseliflavus, which has a very similar structure to the E. coli enzyme and 78% sequence identity (28). The underlying nucleotide mutation in the glpK gene is also within a putative GlpR-binding site (29); however, since GlpR repression is not active during growth on glycerol this is likely not relevant to its selection.
Like the M271I variant, the Q37P variant strongly impacts multiple catalytic properties in addition to FBP inhibition and tetramer dissociation. The mutation causes the largest Vmax max increase among the variants, though like the M271I mutant, increased velocity is coupled with decreased ATP affinity and enzyme efficiency is only about a quarter of native enzyme. But also like M271I, this decrease likely does not affect activity at in vivo ATP concentrations.
Loss of FBP Affinity and Tetramer Stability
The primary mechanism used by selection to increase in vivo GlpK activity appears to be residue changes that decreased tetramer stability and FBP inhibition, which as previously described, are thermodynamically and structurally related. These two parameters are also the most robustly and consistently affected parameters across the examined allozymes, and are the only measured enzymatic parameters that correlate to the measured fitness differences (Table 2). In vivo, intracellular FBP has been estimated to be in the 3–5 mm range during growth on glycerol (26), which Fig. 1C indicates imposes near maximum inhibition on wild type GlpK. This suggests reduction of FBP inhibition is a potent mechanism for increasing intracellular GlpK activity.
While we have not demonstrated that all of the different GlpK mutants acquired across the 50 glycerol-adapted lineages increase fitness by reducing FBP sensitivity, it is worth noting that all of the mutated loci (with the exception of Gln-37) are in domains involved in the formation of the tetramer interface of the FBP-binding site. Additionally, GlpK mutants with reduced FBP sensitivity have also been repeatedly isolated from screens of mutagenized cells for reduced glucose control and loss of diauxic growth (8, 15). This may indicate that FBP sensitivity is particularly malleable to modulation by mutation. Conversely, the persistence of the highly FBP-sensitive GlpK in the wild type, despite the indicated wide availability of variants with reduced sensitivity, suggests that this trait is positively selected even though it reduces growth on glycerol. It may also suggest that the native enzyme specifically retains the ability to quickly relax FBP inhibition in the presence of glycerol (30).
Catabolite Repression by GlpK Mutations
It is well known that glycerol metabolism partially induces catabolite repression (31–33), but the response observed is much stronger in the GlpK mutant strains given that the cAMP levels approach those observed during growth on glucose (supplemental Fig. S3b). Increased glycerol-induced catabolite repression has also been observed in other FBP-desensitized GlpK mutants (6), though the underlying mechanism has been a topic of ongoing examination. An initial model posited that IIAGlc becomes sequestered by increased expression of GlpK in response to glycerol, and that this reduced the levels of phosphorylated IIAGlc available to stimulate adenylate cyclase to produce cAMP (31, 33). However, it has since been shown that reduction of cAMP during growth on glycerol is independent of IIAGlc, but instead is dependent on glycerol-3-phosphate (G3P), the product of GlpK (32).
The results of the study described herein provide no direct evidence to validate either hypothesis, but are more consistent with the G3P-dependent model. If correct, cAMP levels correlate to fitness because both are direct consequences of increased intracellular GlpK activity and glycerol metabolism. This would also explain why cAMP levels in the GlpK mutant strains are only altered during growth on glycerol and not on other substrates (supplemental Fig. S3b). The results also conflict with the IIAGlc-sequestering hypothesis because the GlpK mutants do not generally have increased IIAGlc affinity (Table 2), and glpK expression is reduced in the mutants even though cAMP levels still fall (Table 3, Fig. 3).
Reduced glpK Expression
Counterintuitively, glycerol fitness appears to increase with decreased GlpK expression (Fig. 2D). Reduced cAMP concentrations across the mutant strains suggest that catabolite repression of the glpFKX operon is responsible (3, 34). Combined, these results indicate a negative feedback response where accumulation of G3P by GlpK activity reduces cAMP synthesis and glpK expression until a steady-state between GlpK activity and cAMP regulation is reached. The correlation between decreased mutant GlpK expression and increased fitness suggests that the cAMP-mediated feedback loop proportionally attenuates rather than completely counteracts total in vivo GlpK activity gains caused by loss of FBP inhibition.
The existence of a negative feedback mechanism that limits use of a substrate in the absence of alternative carbon sources seems counterproductive to growth. However, loss of both FBP inhibition and catabolite repression of GlpK activity have long been known to lead to synthesis of lethal levels of methylglyoxal during growth on glycerol (35–39). Methylglyoxal is synthesized in response to excessive accumulation of dihydroxyacetone phosphate (DHAP) and depletion of free inorganic phosphate, and at subtoxic levels frees inorganic phosphate for downstream metabolic reactions (38–40). Glycerol metabolism is prone to causing methylglyoxal toxicity because it enters glycolysis as DHAP. If catabolite repression is induced by G3P, it would provide a direct mechanism to buffer methylglyoxal toxicity from glycerol metabolism.
High Frequency of glpK 218 Mutations
The mechanism underlying the increased mutation rate of the glpK 218 allele is not known. It may be significant that the wild type adenine allele is a predicted methylation target of Dam methylase. However, while methylated cytosines are well-characterized mutation hotspots (41) (possibly suggesting that the seven 218 a→t mutations were transiently 218 a→c mutations), we have found no published observation of increased mutation rates among methylated adenines or Dam methylase targets. We have also considered the possibility that this hot spot is a transcription-driven mutation, caused by open exposure of the non-coding DNA strand during mRNA synthesis that can particularly affect nucleotides that are unpaired in the majority of available secondary structures (42–44). However, analysis of the local secondary structure of the wild type 218 allele by mfg software (45) indicates it is not frequently unpaired. Additionally, transcription-directed mutations have only been observed following severe nutritional stress while the glycerol-evolved strains were grown with excess substrate.
Although the cause of this hot spot is currently unknown, its existence in a position that significantly increases fitness under a growth condition related to the function of the encoded gene suggests that the site-specific increased mutation rate is itself adaptive. This is not the first indication that mutation hotspots in bacteria may preferentially appear at loci that impart an adaptive function, as a number of other adaptive mutation hot spots have been putatively identified across a wide set of core metabolic genes by comparative analysis of sequenced E. coli genomes (46). That study also suggested that these hotspots may exist to facilitate repeated adaptation to transient growth conditions that impose significant trade-offs with more common growth conditions. When applied to glycerol metabolism, this hypothesis suggests that the 218 locus hot spot could exist to accommodate the trade-off between GlpK activity and vulnerability to methylglyoxal toxicity previously described, and/or the observed growth defect of the GlpK mutant strains on sugars (supplemental Note S3).
The relative fitness relationship between the examined GlpK mutants indicates that at least one GlpK mutant (V61L) exists that can impart a larger fitness increase than D72V. This raises the question of why the increased mutation rate is not applied to the nucleotide coding the most adaptive GlpK mutant if this hot spot exists to facilitate glycerol adaptation. This question cannot be addressed before more is known about the mechanism underlying the increased mutation rate, as it is possible that nucleotide 218 is in a better position to become a hot spot due to nucleotide sequence properties rather than impact on enzyme activity and fitness. However, it is also possible that glpK 218 is the acquired hotspot because its mutation increases fitness more reliably, due to the cumulative effect of all the possible mutants accessible from this locus, or due to the robustness of the resulting mutants to epistatic interactions with adaptive mutations in other genes. It is becoming increasingly apparent that epistatic interactions frequently occur between adaptive mutations (47–49) even when the affected genes have unrelated functions (50, 51). In this case, the only strain in which the V61L mutant appeared included a large-scale duplication, and was among the fewer than 20% of lineages that did not acquire a mutation to either RNA polymerase gene rpoB or rpoC (5, 52). This suggests that while the V61L mutant is more advantageous than the D72V mutant in an otherwise wild type genetic background, it may have less favorable epistatic interactions with frequently co-acquired mutants that could make it a less effective hotspot target than GlpK Asp-72 mutants in an adapting genome. For instance, evidence of positive epistatic interactions between GlpK D72V and rpoC mutations has already been found (4).
The Study of Adaptive Constraints
In this study we have attempted to determine the molecular mechanism underlying an enzyme adaption by identifying properties that are altered in a manner that correlates to the ability of the mutations to increase fitness. The underlying assumption has been that mutations to the same gene improve growth by alleviating the same constraint. We are able to show that rate-limiting GlpK activity is increased by reducing tetramer stability and FBP inhibition, and that this is the mechanism likely used by the majority of GlpK mutants acquired by this selection process. We additionally show how the effects of the mutations are attenuated by negative feedback regulation, which provides further support that G3P rather than IIAGlc mediates glycerol-induced catabolite repression. We also found evidence that the most frequently acquired mutant is the result of a mutation hotspot, which may exist to facilitate rapid metabolic optimization when glycerol is sole available carbon source.
Currently, study of adaptive constraints at the molecular level has mostly been limited to directed protein evolution studies that have examined how mutations selected to alter specific enzyme properties achieve that effect (49, 53–59). This is one of a handful of studies to date to examine the molecular basis underlying the effect of a set of adaptive mutations to the same gene on organism fitness (2, 60, 61).
However, even though many adaptive mutations are now being discovered from the growing number of laboratory evolution studies that utilize gene and genome resequencing (5, 62–68), it may not be feasible to determine the constraints underlying many of them. For instance, it may not be accurate in all cases to assume that mutations to the same gene alleviate the same constraint or do so by the same mechanism. Additionally, replicate lineages may alleviate the same constraint through modification of different genes. This approach can also be very technically difficult since it requires both very sensitive measurements of fitness as well as assays of multiple enzyme properties, regulatory mechanisms, and potential pathway- or network-wide effects across a number of different mutants. Many of these problems are likely to be more significant for adaptations to genes that are not very well characterized, or have many interactions or functions, such as mutations to global regulatory proteins that are frequently being discovered in laboratory adaptations (52, 68–72).
In this study many of these difficulties were simplified because the subject was a metabolic enzyme that has already been well-characterized. Even so, we were unable to account for one effect the mutants had on phenotype, reduced growth rate on glycolytic substrates (supplemental Fig. S3 and Note S3), largely because this effect most likely results from a previously unrecognized interaction.
This perhaps underlies the point that while studying constraints and adaptive processes is technically challenging, they also hold great potential for discovering new and important interactions. Identifying the constraints that define growth potential and drive the adaptive processes will be critical to developing a comprehensive understanding of biochemical networks and systems biology.
Supplementary Material
Acknowledgments
We thank Milton Saier for generous time and feedback, Young Seoub Park, and Dae Hee Lee for invaluable technical advice, Megan Anderson (Quake Lab, Stanford University) for sharing GlpK cloning constructs, Jessica Na, Pamela S. Miller, and Tzu-Wen Huang for expert technical assistance, and Jan Schellenberger and Nate Lewis for statistical advice.
This work was supported in whole or in part by National Institutes of Health Grant R01-GM062791-06 (to M. K. A., A. R. J., T. M. C., and B. O. P.) and Texas Agrilife Research Project TEX09208 (to D. W. P.).

The on-line version of this article (available at http://www.jbc.org) contains supplemental Tables S1–S2 and Figs. S1–S4.
- glpK
- glycerol kinase gene
- FBP
- fructose-1,6-bisphosphate
- GLPK
- glycerol kinase.
REFERENCES
- 1. Fong S. S., Joyce A. R., Palsson B. Ø. (2005) Genome Research 15, 1365–1372 [DOI] [PMC free article] [PubMed] [Google Scholar]
- 2. Knight C. G., Zitzmann N., Prabhakar S., Antrobus R., Dwek R., Hebestreit H., Rainey P. B. (2006) Nat. Genet. 38, 1015–1022 [DOI] [PubMed] [Google Scholar]
- 3. Lin E. C. (1976) Annu. Rev. Microbiol. 30, 535–578 [DOI] [PubMed] [Google Scholar]
- 4. Applebee M. K., Herrgård M. J., Palsson B. Ø. (2008) J. Bacteriol. 190, 5087–5094 [DOI] [PMC free article] [PubMed] [Google Scholar]
- 5. Herring C. D., Raghunathan A., Honisch C., Patel T., Applebee M. K., Joyce A. R., Albert T. J., Blattner F. R., van den Boom D., Cantor C. R., Palsson B. Ø. (2006) Nat. Genet. 38, 1406–1412 [DOI] [PubMed] [Google Scholar]
- 6. Zwaig N., Kistler W. S., Lin E. C. (1970) J. Bacteriol. 102, 753–759 [DOI] [PMC free article] [PubMed] [Google Scholar]
- 7. Pettigrew D. W., Yu G. J., Liu Y. (1990) Biochemistry 29, 8620–8627 [DOI] [PubMed] [Google Scholar]
- 8. Zwaig N., Lin E. C. (1966) Science 153, 755–757 [DOI] [PubMed] [Google Scholar]
- 9. Postma P. W., Epstein W., Schuitema A. R., Nelson S. O. (1984) J. Bacteriol. 158, 351–353 [DOI] [PMC free article] [PubMed] [Google Scholar]
- 10. Novotny M. J., Frederickson W. L., Waygood E. B., Saier M. H., Jr. (1985) J Bacteriol 162, 810–816 [DOI] [PMC free article] [PubMed] [Google Scholar]
- 11. Holtman C. K., Pawlyk A. C., Meadow N. D., Pettigrew D. W. (2001) J. Bacteriol. 183, 3336–3344 [DOI] [PMC free article] [PubMed] [Google Scholar]
- 12. de Riel J. K., Paulus H. (1978) Biochemistry 17, 5141–5146 [DOI] [PubMed] [Google Scholar]
- 13. de Riel J. K., Paulus H. (1978) Biochemistry 17, 5134–5140 [DOI] [PubMed] [Google Scholar]
- 14. Yu P., Pettigrew D. W. (2003) Biochemistry 42, 4243–4252 [DOI] [PubMed] [Google Scholar]
- 15. Liu W. Z., Faber R., Feese M., Remington S. J., Pettigrew D. W. (1994) Biochemistry 33, 10120–10126 [DOI] [PubMed] [Google Scholar]
- 16. Bystrom C. E., Pettigrew D. W., Branchaud B. P., O'Brien P., Remington S. J. (1999) Biochemistry 38, 3508–3518 [DOI] [PubMed] [Google Scholar]
- 17. Herring C. D., Glasner J. D., Blattner F. R. (2003) Gene 311, 153–163 [DOI] [PubMed] [Google Scholar]
- 18. Pettigrew D. W. (2009) Arch Biochem. Biophys. 492, 29–39 [DOI] [PMC free article] [PubMed] [Google Scholar]
- 19. Death A., Ferenci T. (1994) J. Bacteriol. 176, 5101–5107 [DOI] [PMC free article] [PubMed] [Google Scholar]
- 20. Lee D. H., Palsson B. O. (2010) Appl. Env. Microbiol. 76, 4158–4168 [DOI] [PMC free article] [PubMed] [Google Scholar]
- 21. Covert M. W., Knight E. M., Reed J. L., Herrgard M. J., Palsson B. O. (2004) Nature 429, 92–96 [DOI] [PubMed] [Google Scholar]
- 22. Muller P. Y., Janovjak H., Miserez A. R., Dobbie Z. (2002) BioTechniques 32, 1372–1374, 1376,, 1378–1379 [PubMed] [Google Scholar]
- 23. Ibarra R. U., Edwards J. S., Palsson B. O. (2002) Nature 420, 186–189 [DOI] [PubMed] [Google Scholar]
- 24. Gosset G., Zhang Z., Nayyar S., Cuevas W. A., Saier M. H., Jr. (2004) J. Bacteriol. 186, 3516–3524 [DOI] [PMC free article] [PubMed] [Google Scholar]
- 25. Pettigrew D. W., Liu W. Z., Holmes C., Meadow N. D., Roseman S. (1996) J. Bacteriol. 178, 2846–2852 [DOI] [PMC free article] [PubMed] [Google Scholar]
- 26. Bennett B. D., Kimball E. H., Gao M., Osterhout R., Van Dien S. J., Rabinowitz J. D. (2009) Nat. Chem. Biol. 5, 593–599 [DOI] [PMC free article] [PubMed] [Google Scholar]
- 27. Hurley J. H., Faber H. R., Worthylake D., Meadow N. D., Roseman S., Pettigrew D. W., Remington S. J. (1993) Science 259, 673–677 [PubMed] [Google Scholar]
- 28. Yeh J. I., Charrier V., Paulo J., Hou L., Darbon E., Claiborne A., Hol W. G., Deutscher J. (2004) Biochemistry 43, 362–373 [DOI] [PubMed] [Google Scholar]
- 29. Weissenborn D. L., Wittekindt N., Larson T. J. (1992) J. Biol. Chem. 267, 6122–6131 [PubMed] [Google Scholar]
- 30. Camps M., Herman A., Loh E., Loeb L. A. (2007) Crit. Rev. Biochem. Mol. Biol. 42, 313–326 [DOI] [PMC free article] [PubMed] [Google Scholar]
- 31. Chagneau C., Heyde M., Alonso S., Portalier R., Laloi P. (2001) J. Bacteriol. 183, 5675–5683 [DOI] [PMC free article] [PubMed] [Google Scholar]
- 32. Eppler T., Postma P., Schütz A., Völker U., Boos W. (2002) J. Bacteriol. 184, 3044–3052 [DOI] [PMC free article] [PubMed] [Google Scholar]
- 33. Rohwer J. M., Bader R., Westerhoff H. V., Postma P. W. (1998) Mol. Microbiol. 29, 641–652 [DOI] [PubMed] [Google Scholar]
- 34. Keseler I. M., Bonavides-Martínez C., Collado-Vides J., Gama-Castro S., Gunsalus R. P., Johnson D. A., Krummenacker M., Nolan L. M., Paley S., Paulsen I. T., Peralta-Gil M., Santos-Zavaleta A., Shearer A. G., Karp P. D. (2009) Nucleic Acids Res. 37, D464–470 [DOI] [PMC free article] [PubMed] [Google Scholar]
- 35. Freedberg W. B., Kistler W. S., Lin E. C. (1971) J. Bacteriol. 108, 137–144 [DOI] [PMC free article] [PubMed] [Google Scholar]
- 36. Krymkiewicz N., Diéguez E., Rekarte U. D., Zwaig N. (1971) J. Bacteriol. 108, 1338–1347 [DOI] [PMC free article] [PubMed] [Google Scholar]
- 37. Zhu M. M., Skraly F. A., Cameron D. C. (2001) Metab. Eng. 3, 218–225 [DOI] [PubMed] [Google Scholar]
- 38. Booth I. R. (2005) Module 3.4.3 Glycerol and Methylglyoxal Metabolism, Escherichia coli and Salmonella, Online Ed., ASM Press, Washington, D.C [Google Scholar]
- 39. Cooper R. A. (1984) Annu. Rev. Microbiol. 38, 49–68 [DOI] [PubMed] [Google Scholar]
- 40. Ferguson G. P., Tötemeyer S., MacLean M. J., Booth I. R. (1998) Arch. Microbiol. 170, 209–218 [DOI] [PubMed] [Google Scholar]
- 41. Lutsenko E., Bhagwat A. S. (1999) Mutat. Res. 437, 11–20 [DOI] [PubMed] [Google Scholar]
- 42. Foster P. L. (2007) Crit. Rev. Biochem. Mol. Biol. 42, 373–397 [DOI] [PMC free article] [PubMed] [Google Scholar]
- 43. Wright B. E. (2004) Mol. Microbiol. 52, 643–650 [DOI] [PubMed] [Google Scholar]
- 44. Burkala E., Reimers J. M., Schmidt K. H., Davis N., Wei P., Wright B. E. (2007) Microbiology 153, 2180–2189 [DOI] [PubMed] [Google Scholar]
- 45. Wright B. E., Reschke D. K., Schmidt K. H., Reimers J. M., Knight W. (2003) Mol. Microbiol. 48, 429–441 [DOI] [PubMed] [Google Scholar]
- 46. Chattopadhyay S., Weissman S. J., Minin V. N., Russo T. A., Dykhuizen D. E., Sokurenko E. V. (2009) Proc. Natl. Acad. Sci. U.S.A. 106, 12412–12417 [DOI] [PMC free article] [PubMed] [Google Scholar]
- 47. Le Gac M., Doebeli M. (2010) Mol. Ecol. 19, 2430–2438 [DOI] [PubMed] [Google Scholar]
- 48. MacLean R. C., Perron G. G., Gardner A. (2010) Genetics 186, 1345–1354 [DOI] [PMC free article] [PubMed] [Google Scholar]
- 49. Weinreich D. M., Delaney N. F., Depristo M. A., Hartl D. L. (2006) Science 312, 111–114 [DOI] [PubMed] [Google Scholar]
- 50. He X., Qian W., Wang Z., Li Y., Zhang J. (2010) Nat. Genet. 42, 272–276 [DOI] [PMC free article] [PubMed] [Google Scholar]
- 51. Cooper T. F., Remold S. K., Lenski R. E., Schneider D. (2008) PLoS. Genet. 4, e35 [DOI] [PMC free article] [PubMed] [Google Scholar]
- 52. Conrad T. M., Frazier M., Joyce A. R., Cho B. K., Knight E. M., Lewis N. E., Landick R., Palsson B. Ø. (2010) Proc. Natl. Acad. Sci. U.S.A. 107, 20500–20505 [DOI] [PMC free article] [PubMed] [Google Scholar]
- 53. Aponte R. A., Zimmermann S., Reinstein J. (2010) J. Mol. Biol. 399, 154–167 [DOI] [PubMed] [Google Scholar]
- 54. Miller S. P., Lunzer M., Dean A. M. (2006) Science 314, 458–461 [DOI] [PubMed] [Google Scholar]
- 55. Couñago R., Chen S., Shamoo Y. (2006) Mol Cell 22, 441–449 [DOI] [PubMed] [Google Scholar]
- 56. Couñago R., Wilson C. J., Peña M. I., Wittung-Stafshede P., Shamoo Y. (2008) Protein Eng. Des. Sel. 21, 19–27 [DOI] [PubMed] [Google Scholar]
- 57. DePristo M. A., Weinreich D. M., Hartl D. L. (2005) Nat. Rev. Genet. 6, 678–687 [DOI] [PubMed] [Google Scholar]
- 58. Bokma E., Koronakis E., Lobedanz S., Hughes C., Koronakis V. (2006) FEBS Lett. 580, 5339–5343 [DOI] [PubMed] [Google Scholar]
- 59. Tomatis P. E., Fabiane S. M., Simona F., Carloni P., Sutton B. J., Vila A. J. (2008) Proc. Natl. Acad. Sci. U.S.A. 105, 20605–20610 [DOI] [PMC free article] [PubMed] [Google Scholar]
- 60. Crozat E., Winkworth C., Gaffé J., Hallin P. F., Riley M. A., Lenski R. E., Schneider D. (2010) Mol. Biol. Evol. 27, 2113–2128 [DOI] [PubMed] [Google Scholar]
- 61. Giraud A., Arous S., De Paepe M., Gaboriau-Routhiau V., Bambou J. C., Rakotobe S., Lindner A. B., Taddei F., Cerf-Bensussan N. (2008) PLoS Genet. 4, - [DOI] [PMC free article] [PubMed] [Google Scholar]
- 62. Hegreness M., Kishony R. (2007) Genome Biol. 8, 201 [DOI] [PMC free article] [PubMed] [Google Scholar]
- 63. Conrad T. M., Joyce A. R., Applebee M. K., Barrett C. L., Xie B., Gao Y., Palsson B. Ø. (2009) Genome Biol. 10, R118 [DOI] [PMC free article] [PubMed] [Google Scholar]
- 64. Charusanti P., Conrad T. M., Knight E. M., Venkataraman K., Fong N. L., Xie B., Gao Y., Palsson B. Ø. (2010) PLoS Genet. 6, e1001186 [DOI] [PMC free article] [PubMed] [Google Scholar]
- 65. Sota M., Yano H., Hughes J. M., Daughdrill G. W., Abdo Z., Forney L. J., Top E. M. (2010) ISME J 4, 1568–1580 [DOI] [PMC free article] [PubMed] [Google Scholar]
- 66. Cooper V. S., Schneider D., Blot M., Lenski R. E. (2001) J. Bacteriol. 183, 2834–2841 [DOI] [PMC free article] [PubMed] [Google Scholar]
- 67. Woods R., Schneider D., Winkworth C. L., Riley M. A., Lenski R. E. (2006) Proc. Natl. Acad. Sci. U.S.A. 103, 9107–9112 [DOI] [PMC free article] [PubMed] [Google Scholar]
- 68. Cooper T. F., Rozen D. E., Lenski R. E. (2003) Proc. Natl. Acad. Sci. U.S.A. 100, 1072–1077 [DOI] [PMC free article] [PubMed] [Google Scholar]
- 69. Philippe N., Crozat E., Lenski R. E., Schneider D. (2007) Bioessays 29, 846–860 [DOI] [PubMed] [Google Scholar]
- 70. Maharjan R., Seeto S., Notley-McRobb L., Ferenci T. (2006) Science 313, 514–517 [DOI] [PubMed] [Google Scholar]
- 71. Crozat E., Philippe N., Lenski R. E., Geiselmann J., Schneider D. (2005) Genetics 169, 523–532 [DOI] [PMC free article] [PubMed] [Google Scholar]
- 72. Wilson J. W., Ott C. M., Höner, zu Bentrup K., Ramamurthy R., Quick L., Porwollik S., Cheng P., McClelland M., Tsaprailis G., Radabaugh T., Hunt A., Fernandez D., Richter E., Shah M., Kilcoyne M., Joshi L., Neiman-Gonzalez M., Hing S., Parra M., Dumars P., Norwood K., Bober R., Devich J., Ruggles A., Goulart C., Rupert M., Stodieck L., Stafford P., Catella L., Schurr M. J., Buchanan K., Morici L., McCracken J., Allen P., Baker-Coleman C., Hammond T., Vogel J., Nelson R., Pierson D. L., Stefanyshyn-Piper H. M., Nickerson C. A. (2007) Proc. Natl. Acad. Sci. U.S.A. 104, 16299–16304 [DOI] [PMC free article] [PubMed] [Google Scholar]
- 73. Larson T. J., Ye S. Z., Weissenborn D. L., Hoffmann H. J., Schweizer H. (1987) J. Biol. Chem. 262, 15869–15874 [PubMed] [Google Scholar]
Associated Data
This section collects any data citations, data availability statements, or supplementary materials included in this article.