

Abstract
Ratiometric measurements with FRET-based biosensors in living cells using a single fluorescence excitation wavelength are often affected by a significant ion sensitivity and the aggregation behavior of the FRET pair. This is an important problem for quantitative approaches. Here we report on the influence of physiological ion concentration changes on quantitative ratiometric measurements by comparing different FRET pairs for a cAMP-detecting biosensor. We exchanged the enhanced CFP/enhanced YFP FRET pair of an established Epac1-based biosensor by the fluorophores mCerulean/mCitrine. In the case of enhanced CFP/enhanced YFP, we showed that changes in proton, and (to a lesser extent) chloride ion concentrations result in incorrect ratiometric FRET signals, which may exceed the dynamic range of the biosensor. Calcium ions have no direct, but an indirect pH-driven effect by mobilizing protons. These ion dependences were greatly eliminated when mCerulean/mCitrine fluorophores were used. For such advanced FRET pairs the biosensor is less sensitive to changes in ion concentration and allows consistent cAMP concentration measurements under different physiological conditions, as occur in metabolically active cells. In addition, we verified that the described FRET pair exchange increased the dynamic range of the FRET efficiency response. The time window for stable experimental conditions was also prolonged by a faster biosensor expression rate in transfected cells and a greatly reduced tendency to aggregate, which reduces cytotoxicity. These properties were verified in functional tests in single cells co-expressing the biosensor and the 5-HT1A receptor.
Keywords: Calcium, Cyclic AMP (cAMP), Fluorescence, Fluorescence Resonance Energy Transfer (FRET), Neuron, Chloride, Epac, Quantitative Analysis, Spine, pH
Introduction
Several constructs of fluorescent proteins have been developed to measure cyclic adenosine monophosphate concentration ([cAMP]) in living cells (1, 2). In these biosensors, Epac1 or Epac2 (exchange proteins directly activated by cAMP) (3, 4) or their cAMP binding domains are used as backbones (5–7) to which fluorescent proteins are tethered. The binding of cAMP to the biosensors leads to a conformational change, which alters the relative distance and/or orientation between the FRET pair, thus changing the efficiency of energy transfer and donor and acceptor fluorescence emission.
For such biosensors with fixed donor-acceptor stoichiometry, common ratiometric fluorescence measurements can be performed to identify changes in FRET. These changes can be calibrated with reference ligand solutions using a single fluorescence excitation wavelength (e.g. see Ref. 8). In contrast to multi-excitation wavelength approaches like the EfDA/γ analysis (1, 9) or lux-FRET (10), which require more complex algorithms and calibrations, single excitation wavelength measurements profit from a higher time resolution and reduced bleaching of the fluorophores. Ratiometric analysis also gives a better signal-to-noise ratio than the more complex approaches (11).
cAMP biosensors using the conventional FRET pair (enhanced cyan fluorescence protein (eCFP)2 and enhanced yellow fluorescence protein (eYFP)) (12) might be critical when ratiometric cAMP measurements are performed with single-channel fluorescence excitation, as demonstrated in a previous work (1). Such ratiometric FRET analysis of the intensity ratio between eCFP and eYFP emission of the Epac1 biosensor CFP-Epac(δDEP-CD)–YFP (Ponsioen et al. (7)) is susceptible to eYFP fluorescence intensity changes whenever ion concentrations fluctuate (e.g. [Cl−] (13)). Considering that ion concentrations change significantly during physiologically cellular activities (e.g. [H+] and [Cl−] change with normal synaptic interactions of neurons) (e.g. see Refs. 14 and 15), FRET signals can be affected by secondary effects and may not reliably monitor the real [cAMP]. The condition becomes worse under pathologic conditions, when ionic homeostasis is unbalanced, further falsifying [cAMP] readouts. During hypoxia, for example, intracellular pH decreases, and chloride ions accumulate within neurons, whereas calcium influx is increased or calcium is released from intracellular stores (16, 17). Exchange of the FRET pair had already been used to gain a higher FRET efficiency of the traditional cAMP biosensor (18); no special focus, however, was directed on ion sensitivity. Particularly for quantitative ratiometric FRET analysis in vivo, it seemed necessary, therefore, to exchange the conventional FRET pair eCFP/eYFP for other fluorophores that are less sensitive to changes in these ion concentrations. From a variety of improved CFP and YFP derivatives, we have chosen mCerulean and mCitrine, which are less sensitive to pH changes and show only insignificant halide sensitivity. mCitrine also has a much higher photostability as compared with eYFP and has an improved folding efficiency (19). mCerulean is a better FRET donor than eCFP when combined with mCitrine (20, 21). Förster distance R0 of the mCerulean/mCitrine FRET pair is almost 10% larger than for eCFP/mCitrine as calculated by a 68% larger quantum yield of mCerulean. Another important advantage also is that the monomeric versions (22) of Cerulean and Citrine show a much lower tendency to oligomerization as compared with the eCFP/eYFP pair, which may cause additional artifacts.
Here, we report a reduced ion sensitivity (to pH and Cl− and indirectly also Ca2+) of quantitative radiometric measurements by exchanging the eCFP/eYFP FRET pair of the biosensor for mCerulean/mCitrine. In addition, we report an improvement of the biosensor aggregation behavior.
EXPERIMENTAL PROCEDURES
Construction of Plasmids
Plasmids encoding mCerulean and mCitrine were obtained from Addgene, and their coding sequences were amplified by PCR, introducing recombinant recognition sites for restriction enzymes using the primers mCerulean-NotI-for (5′-GCGGCCGC aat ggt gag caa ggg cga gga g-3′), mCerulean-EcoRV-rev (5′-GATATC gag atc tga gtc cgg act tgt aca gct cgt cca tgc c-3′), mCitrine-NheI-for (5′-GCTAGC gag ctc atg gtg agc aag ggc gag gag-3′), and mCitrine-EcoRI-rev (5′-GAATTC ctt gta cag ctc gtc cat gcc-3′). Resultant PCR products were subcloned into a mammalian expression vector pTarget (Promega), which served for positive controls in FRET measurements. mCerulean and mCitrine were isolated from the vectors with the restriction enzyme pairs NotI/EcoRV and NheI/EcoRI (New England Biolabs) and cloned into corresponding sites in the vector pcDNA3.1-CFP-Epac(δDEP-CD)–YFP (7) (encoding the protein denoted EPAC*) to replace previous fluorophores. The cloning provided the vector pcDNA3.1-mCerulean-Epac(δDEP-CD)–mCitrine (encoding the protein denoted CEPAC*).
Neuroblastoma cells (N1E-115) were transfected with cDNA encoding for (a) enhanced cyan fluorescence protein (pECFP-N1, Clontech), (b) enhanced yellow fluorescence protein (pEYFP-N1, Clontech), (c) mCerulean, (d) mCitrine, (e) pcDNA3.1/CAT (Invitrogen), (f) EPAC*, (g) CEPAC*, or (h) a co-transfection of 5-HT1AR (HA-tagged 5-HT1A-receptor cloned into the pcDNA3.1 plasmid (23)) together with CEPAC* and EPAC*, respectively.
Cell Culture
Mouse N1E-115 neuroblastoma cells from the American Type Culture collection (LGC Promochem, Wesel, Germany) were grown at 37 °C and 5% CO2 in Dulbecco's modified Eagle's medium (Sigma-Aldrich) containing 10% fetal calf serum (FCS) and 1% penicillin/streptomycin. Neuroblastoma cells were seeded at low density (1 × 10⁶ cells) either in 60-mm dishes (for fluorescence spectroscopy measurements) or in 10-mm dishes, including glass coverslips on the bottom (for microscopic measurements). After 24 h, cells were transfected with appropriate vectors using Lipofectamine2000 reagent (Invitrogen) according to the manufacturer's instructions. 3 h after transfection, cells were serum-starved overnight and then used in the experiment. We had to avoid longer incubation periods, because EPAC* proteins aggregated, which impedes direct comparison with the biosensor CEPAC*.
Primary cultures of hippocampal neurons were prepared according to Dityatev et al. (24). Hippocampi from postnatal (P1 or P2) NMRI mice were isolated, and cells were dissociated with trypsin (6 mg/2 ml) and centrifuged (100 × g, 2 × 15 min, 4 °C,) and then were planted on 10-mm glass coverslips (cell density 700 cells/mm2) coated with 100 g/ml poly-l-lysine (Sigma-Aldrich) and 20 μg/ml laminin (Roche Applied Science). From the first day, cells were incubated in minimum essential Eagle's medium containing glucose (25.2 mm), transferrin (1.3 mm), insulin (25 μg/ml), Glutamax I (2 mm), gentamicin (0.5 μl/ml), and horse serum (0.1 ml/ml) at 37 °C and 5% CO2. After 4 days, primary cells were transfected with CEPAC* or EPAC* using an optimized protocol of 1 μg of DNA and 1 μl of Lipofectamine2000 per coverslip in 500 μl of serum-free medium. The transfection mix was removed after 1 h, and cells were incubated for the following days in Neurobasal-A medium containing l-glutamine (0.5 mm), basic fibroblast growth factor (125 ng/ml), B-27 supplement (20 μl/ml), penicillin/streptomycin (10 μl/ml), and cytosine arabinoside (5 μm) at 37 °C and 5% CO2.
Changing of Intracellular pH
To change the intracellular pH (pHi) of N1E cells, we used a modified protocol described previously (25), using extracellular buffer exchange with different pH values to affect intracellular conditions. Extracellular buffer (150 mm NaCl, 5 mm KCl, 2 mm CaCl2, 1 mm MgCl2, 10 mm HEPES, 10 mm sodium-d-glucose) was prepared with pH values ranging from pH 6.5 to pH 8.0 and given to the N1E cells, immediately producing a pHi shift from 7.05 to 7.4, respectively. Under normal culture conditions at an extracellular pH of 7.4, N1E neuroblastoma cells exhibit a pHi of 7.35. The pHi shift was verified by pH indicator dye SNARF-5F (Invitrogen), which was also used to calibrate the pH range. The experiments with cAMP biosensor transfected cells were performed in an upright fluorescent microscope, whereas the experiments with SNARF-5F were performed in a laser-scanning microscope with a spectral resolving emission unit in order to measure the full emission spectrum of SNARF-5F.
Receptor Activation in N1E Cells
N1E-115 cells co-transfected with 5-HT1AR and either cAMP biosensor were kept in an extracellular solution of 150 mm NaCl, 5 mm KCl, 2 mm CaCl2, 1 mm MgCl2, 10 mm HEPES, 10 mm sodium-d-glucose (pH 7.4), and 100 nm forskolin. 5-HT1AR agonist and antagonist were applied by exchanging the standard bath solution for a solution containing or 1 μm serotonin or WAY 100635 (Sigma-Aldrich), respectively. Experiments were performed in an upright fluorescence microscope.
Cell Viability Test
To test the viability of cells transfected with either of the two constructs, the MTS cell proliferation assay (Promega) was used. Approximately 5 × 10³ N1E cells were seeded into 96-well plates and allowed to attach overnight. Transfection with a mock control, CEPAC*, or EPAC* was carried out with Lipofectamine2000 according to the manufacturer's instructions. After 4, 8, 12, 16, and 20 h, absorbance at 485 nm of triplicates of each transfection was measured in a SkanIt plate reader (Thermo Scientific). MTS is reduced by cells into a formazan product, and the quantity of formazan product as measured by the amount of absorbance is directly proportional to the number of living cells in culture. Normalized absorbance was plotted against time after transfection.
Capturing of Dendritic Spines
Primary neurons transfected with the cAMP biosensors were kept in an extracellular solution of 128 mm NaCl, 2 mm KCl, 2 mm CaCl2, 1 mm MgCl2, 10 mm HEPES, 10 mm sodium-d-glucose (pH 7.4). Dendritic spines could be captured using an inverse laser-scanning microscope.
Fluorescence Spectroscopy
The sample preparation was obtained as described previously (1), and only modifications are mentioned here. For [cAMP] measurements, transfected N1E-115 cells were suspended in a buffer and lysed by ultrasonic treatment (DIGITAL Sonifier S-450D, Branson (Danbury, CT)). The homogenate was centrifuged for 1.5 h at 16,000 × g and 4 °C to extract the cytosol. For [cAMP] measurements, the lysis buffer contained 140 mm KCl, 5 mm NaCl, 1 mm MgCl2, and 10 mm HEPES at pH 7.2. For measuring the pH dependence, the solution contained 140 mm KCl, 5 mm NaCl, 1 mm MgCl2, and 10 mm HEPES at pH 7.2. For measuring the Ca2+ dependence, a calcium-free lysis buffer was used containing 140 mm KCl, 5 mm NaCl, 1 mm MgCl2, 1 mm EGTA, and 10 mm HEPES at pH 7.2. Such lysate contained a free [Ca2+] below 10 nm as a starting condition for the calcium titration as proven by calcium measurements with Fluo-5 (Invitrogen) (data not shown). The nominal free [Ca2+] was changed by titrating a defined amount of calcium to the cuvette and was estimated by the Max Chelator Ca-Mg-ATP-EGTA Calculator version 1 (26, 27) (available on the World Wide Web). Addition of high calcium concentrations led to a pH change due to proton release from EGTA. Therefore, the pH in the cuvette was adjusted during each test. For measuring the Cl− dependence, a chloride-free lysis buffer was used, containing 140 mm K+, 5 mm Na+, 1 mm Mg2+, 147 MeSO3−, and 10 mm HEPES at pH 7.2. A basal [Cl−] in the cell lysate of about 200 μm Cl− was determined with a chloride-selective electrode (DC235, Mettler Toledo, Greifensee, Switzerland).
Spectroscopic measurements were performed as described previously (1) with a Fluorolog-322 (Horiba Jovbin Yvon, Munich, Germany). A donor excitation wavelength of 420/2 nm was chosen. A second excitation wavelength of 500/2 nm was necessary to apply the formalism of Equation 2. Reference emission spectra (FDref(λ) and FAref(λ)) of the donor and acceptor fluorophores used for the unmixing procedure (see Equation 1) were obtained at 420/2 nm excitation from cells transfected with donor or acceptor only. To estimate the spectral contributions of light scattering and autofluorescence of cells as an additional background component, reference spectra of pcDNA-transfected cells were used.
Microscopy
Preparation
A glass coverslip carrying the biosensor transfected or loaded N1E-115 cells or primary neurons was positioned in a perfused bath chamber of a microscope. Cells were perfused with an appropriate bath solution at room temperature. For sequential measurements with different solutions, total solution exchanges in the chamber were performed in a time range of 1 min.
Wide Field Fluorescence Microscopy
We used an upright epifluorescence microscope equipped with a water immersion objective (XLUMPlanFI, ×20, numerical aperture 0.95, Olympus, Germany). A 100-watt xenon lamp attached to a monochromator (Optoscan, Kinetic Imaging) served as an excitation light source and was coupled to the microscope via fiber optics. Emission intensities were measured at two excitation wavelengths using 420/10 nm (λ1) and 500/10 nm (λ2), frequently called donor and acceptor excitation, respectively. Fluorescence emission was separated from the excitation light by a dichroic mirror (505 nm). Using a DualView (Optical Insights, Tucson, AZ), the fluorescence emission signal was split by a dichroic mirror (515 nm) for the donor channel at 470/30 nm and the acceptor channel at 535/30 nm. This allowed us to acquire three images with an iXon camera DV887DCS (Andor Technology, South Windsor, CT): (a) the “donor image” at donor excitation and donor emission wavelength; (b) the “FRET image” at donor excitation and acceptor emission wavelength; (c) the “acceptor image” at acceptor excitation and acceptor emission wavelength. Due to the DualView, the donor image and the “FRET image” were obtained simultaneously, which required only two exposures. Exposure times (of about 3 s) were chosen according to the fluorescence intensity of the cells and were equal for all image series of an individual experiment. Special care was taken that bleaching can be ignored.
Laser-scanning Microscope
For capturing dendritic spines and for recording intracellular pH in single cells with SNARF-5F, we used a confocal laser-scanning microscope LSM 510 META from Zeiss (Göttingen, Germany). CEPAC* in spines was observed at 458 nm excitation, and a bright emission bandwidth was observed from 464 to 603 nm using a C-Apochromat × 63/1.2 W corrected objective. For the pHi recording, the emission spectrum (562–646 nm) of SNARF-5F was detected by using the META DETECTOR with a resolution of 8 points (10 nm bandwidth) at an excitation of 543 nm and a Plan-Neofluar × 40/1.3 oil objective.
Data Analysis
Formation of Fluorescent Granules
Single images were taken with a wide field microscope at various times after transfection to measure protein aggregation seen as “granules” with the ImageJ software version 1.41 (National Institutes of Health, Bethesda, MD). Protein aggregation was determined in each cell using a line scan through the entire cells, excluding obvious organelle structures, such as the nucleus. This line scan represents the fluorescence intensity at any given pixel. Calculating the S.D. value for each given fluorescence intensity plot gave a measure of the granularity of the cell because the line profile did not vary greatly in cells showing a uniform fluorophore expression, whereas in cells showing aggregates, the line profile changed between regions with high and low fluorescence. For the different time points, at minimum, six cells were analyzed, and the mean granularity (as the sum of S.D. values from different scans) was plotted over time after transfection.
Length of Neurites
To image a single primary cell, multiple images were taken and stitched together using the ImageJ plugin MosaicJ (28). Neurite length was then measured on the reconstructed image using the ImageJ plugin NeuronJ (29).
Displaying Dendritic Spines
Captured z-stacks of dendritic spine pictures were projected on a single picture by using the maximal z-projection of the ImageJ software version 1.41.
CEPAC* and EPAC* Calibration
We calibrated the [cAMP] sensitivity of CEPAC* and EPAC* by the “sensitized emission” FRET signal using a fluorescence spectrometer (1) as described previously. Spectra were obtained at two excitation wavelengths (λi): at donor excitation wavelength (λ1), where mainly the donor is excited, and at the acceptor excitation wavelength (λ2), where the donor must not be excited (9). For each excitation wavelength, the CEPAC* as well as the EPAC* fluorescence signals Fi(λ) were fitted with a linear combination of the donor D and acceptor A reference spectra.
The apparent donor concentration, [Di], and the apparent acceptor concentration, [Ai], were used as fitting factors. The donor FDRef and the acceptor FARef reference spectra for both excitation wavelengths λi were obtained in a reference measurement of cells containing only donor and acceptor, respectively.
The apparent acceptor concentrations [Ai] at both excitation wavelengths were used to calculate the following term,
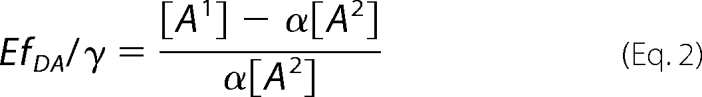 |
where α represents the relative acceptor emission intensity ratio used for the two excitations obtained in a separate experiment using an “acceptor only” sample, γ is the relative acceptor/donor extinction ratio, and fDA is the fraction of biosensor proteins in FRET state.
For calibration of the FRET biosensors CEPAC* and EPAC*, the cAMP dependence of EfDA/γ was fitted by an adapted Hill equation,
where nH is the Hill coefficient, indicating the amount of cAMP-binding places; po and pmax are offset and maximum amplitude parameters, respectively; and EC50 is [cAMP] when 50% of the cAMP binding sites are occupied. Also the cAMP dependence of the acceptor/donor ratio as well as the ion dependences were fitted by a similar Hill equation.
The apparent FRET efficiency (EfDA) was calculated from the donor fluorescence signal in quenched (FD,FRET) and non-quenched (FD,NON-FRET) state (30).
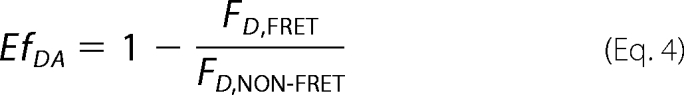 |
RESULTS
Performance and Calibration of CEPAC*
[cAMP] calibration curves of both biosensors were measured to ensure similar binding properties and to compare the dynamic range of the FRET signals. We exposed cell lysates from CEPAC* or EPAC*-transfected cells to various [cAMP] values, ranging from nominal 0 to 1 mm, and measured the biosensor FRET signal acceptor/donor ratio or EfDA/γ as a function of [cAMP]. Fluorescence spectra were recorded, as described previously (1), and the contributions of the donor and acceptor reference spectra were calculated as shown in Fig. 1, A and B. Both biosensors revealed a similar behavior regarding the contribution of reference spectra; the donor emission signal was decreased, and the acceptor emission signal increased with a rise of [cAMP], as expected for FRET changes. During donor excitation, photon counts for the donor and acceptor component of CEPAC* reached similar values in contrast to EPAC*, which is beneficial for the signal/noise ratio of the ratiometric FRET analysis. For both biosensors, we compared the FRET signal acceptor/donor channel ratio as the ratio between the acceptor and donor intensities (here at 420 nm excitation; Fig. 1, C and D). The intensities of the acceptor and donor channels were corrected for spectral bleed-through and background, whereas the channel bandwidth was adapted to that used in the microscope. Due to the higher energy transfer efficiency of the FRET pair mCerulean/mCitrine compared with eCFP/eYFP, the [cAMP] calibration curves of the acceptor/donor channel ratio of CEPAC* started at a higher value (0.94 ± 0.03) than for EPAC* (0.43 ± 0.005). For maximal [cAMP], the acceptor/donor channel ratio dropped to approximately half in both biosensors (to 0.53 ± 0.06 for CEPAC* and 0.23 ± 0.01 for EPAC*), indicating a similar dynamic range of the acceptor/donor channel ratio. The calibration curves were fitted by the Hill equation (Equation 3) to compare the binding affinity of cAMP to the biosensors. Both biosensors exhibited a Hill coefficient for the binding of cAMP of about 1 (nH for CEPAC* = 1.13 ± 0.6; nH for EPAC* = 0.96 ± 0.18). The range of [cAMP] sensing was also comparable, as seen in similar EC50 values for CEPAC* and EPAC* (23.6 ± 12.2 and 30.8 ± 6.9 μm).
FIGURE 1.

cAMP calibration of acceptor/donor ratio and FRET signal of CEPAC* and EPAC*. The left column of graphs (A, C, and E) shows data of CEPAC*, and the right column (B, D, and F) shows data of EPAC*. Schemata of both biosensors are included at the top of the columns. A and B, [cAMP]-dependent donor [Di] and acceptor [Ai] contributions (Equation 1) to the biosensor emission signal at 420 nm excitation. The curve shapes of donor and acceptor reference spectra were obtained by separate measurements. The gray arrows indicate the intensity change with increasing [cAMP]. All presented spectra are corrected for background and autofluorescence. C and D, [cAMP] calibration curves presenting acceptor/donor channel ratio of the acceptor and donor intensity at 420 nm excitation (shown in A and B) as biosensor signal. E and F, [cAMP] calibration curves presenting EfDA/γ as biosensor signal. The data from C–F are fitted using the Hill equation (Equation 3). Calibration curves present mean and S.E. (error bars) of n = 5 and n = 3 experiments with CEPAC* and EPAC*.
FRET Efficiency
Besides verifying comparable functions of both biosensors, we also determined the FRET efficiency (E) for both biosensors by using the multi-excitation wavelength approach to calculate EfDA/γ. Fig. 1, E and F, shows the [cAMP] calibration curves for both biosensors, using EfDA/γ as the signal. Fitting of these curves with a Hill equation (Equation 3) gave Hill coefficients and EC50 values that were similar to those obtained in the ratio analysis of both biosensors. We estimated the absolute value of E from the donor quenching (Fig. 1, A and B) and EfDA/γ. Considering that the donor is partially quenched for high [cAMP] (low FRET), CEPAC* reached a value for E of 26.9 ± 0.4% in cAMP-free solution, when all biosensor molecules are in the highest FRET state (assuming fDA = 1). In the low FRET state, when all biosensor molecules are bound to cAMP, E remained at 13.3 ± 0.7%. Thus, the dynamic range resulted in ΔE = 13.6%, which corresponds to 51% of the maximum E value. For EPAC*, E changed only from 29.4 ± 4.9% to 22.9 ± 2.9%, with ΔE = 6.5%, revealing less accuracy due to the lower donor intensity than in the case of CEPAC*. In summary, CEPAC* provides a larger dynamic range in FRET efficiency than EPAC*. Thus, CEPAC* offers a better signal/noise ratio.
Sensitivity to Changes of Ion Concentration
As mentioned before, the fluorescence of GFP-based fluorophores are affected by ion concentration changes. In order to assess the degree of such influences on FRET measurements with cAMP biosensors, fluorescence spectra of CEPAC* and EPAC* were measured at various ionic concentrations by a fluorescence spectrometer. Fig. 2 illustrates pH, Ca2+, and Cl− dependences of the unmixed donor and acceptor components. Fig. 3 shows the acceptor/donor ratio, as used for ratiometric FRET analysis, and the FRET value EfDA/γ. All ion dependence curves were described by a Hill kinetic as shown in Figs. 2 and 3. The data of the Hill fits (EC50 and nH) are presented in Table 1. Among all three ion dependences, the pH dependence exhibited the strongest effect on the acceptor/donor ratio of both biosensors (Fig. 3A). Although CEPAC* revealed a relatively weak pH sensitivity of only 14% change within a range from pH 6.8 to pH 7.5, a much stronger pH dependence of about 71% change was measured for EPAC*. The high pH dependence seems to be predominantly caused by the acceptor because the donor components of both biosensors revealed a much lower sensitivity (Fig. 2, A and B). As shown in Fig. 3B, the EfDA/γ values exhibited similar pH stability for both cAMP biosensors within a range from pH 5.5 to 8.5.
FIGURE 2.

H+, Ca2+, and Cl− concentration-dependent fluorescence intensity of FRET donor and acceptor of biosensor proteins CEPAC* and EPAC*. A and B, pH sensitivity; C and D, Ca2+ sensitivity with (blue) and without (black, gray) proton carried indirect calcium-effect; E and F, Cl− sensitivity. The first column (A, C, and E) shows the normalized fluorescence intensity of the donor unmixed component, and the second column (B, D, and F) shows the acceptor unmixed component. Donor and acceptor unmixed components are the result of a linear unmixing analysis of fluorescence spectra of the biosensor CEPAC* (black or dark blue) and EPAC* (gray or light blue). Dependences were fitted by using a Hill equation (dashed lines). Displayed values are mean and S.E. (error bars). Fitting results and numbers of experiments are presented in Table 1.
FIGURE 3.

H+, Ca2+, and Cl− concentration-dependent acceptor/donor ratio and EfDA/γ of CEPAC* and EPAC*. A and B, pH sensitivity; C and D, Ca2+ sensitivity with (blue) and without (black, gray) proton-carried indirect calcium-effect; E and F, Cl− sensitivity. The first graph column (A, C, and E) shows the normalized acceptor/donor ratio, and the second graph column (B, D, and F) shows the value EfDA/γ for EPAC* (black or dark blue) and CEPAC* (gray or light blue). Dependences were fitted using a Hill equation (dashed lines). Displayed values are mean and S.E. (error bars) calculated by using the results of the donor and acceptor unmixed components partly presented in Fig. 2. Fitting results and numbers of experiments are presented in Table 1.
TABLE 1.
Hill fit results of curves in Figs. 2 and 3
Results are shown for the acceptor [Ai] contributions of the spectral unmixing of the biosensor signal as well as for the acceptor/donor ratio [Ai]/[Di]. The ion characteristic of the donor component [Di] could only be fitted with high uncertainty using a Hill equation due to small changes or, in the case of pH dependence, using a double rather than a single Hill equation. Therefore, results for the donor component are not presented. Values are presented ± S.E.
| pH sensitivity | Hill fit results |
|||
|---|---|---|---|---|
| CEPAC* |
EPAC* |
|||
| pEC50 | nH | pEC50 | nH | |
| [Ai] at 500 nm excitation | 5.88 ± 0.11 | 0.67 ± 0.10 | 7.23 ± 0.03 | 0.94 ± 0.06 |
| [Ai]/[Di] at 420 nm excitation | 6.03 ± 0.04 | 0.83 ± 0.06 | 7.35 ± 0.04 | 0.94 ± 0.07 |
| [Ca2+] sensitivityb | CEPAC* |
EPAC* |
||
|---|---|---|---|---|
| EC50 | nH | EC50 | nH | |
| [Ai] at 500 nm excitation | 152 ± 90 nm | 0.53 ± 0.16 | 272 ± 21 nm | 1.1 ± 0.1 |
| [Ai]/[Di] at 420 nm excitation | 437 ± 35 nm | 1.9 ± 2.2 | 269 ± 62 nm | 1.4 ± 0.5 |
| [Cl−] sensitivity | CEPAC* |
EPAC* |
||
|---|---|---|---|---|
| EC50 | nH | EC50 | nH | |
| [Ai] at 500 nm excitation | ∼7 ± 18 μm | 1a | 130 ± 215 mm | 1a |
| [Ai]/[Di] at 420 nm excitation | 0.18 ± 0.61 mm | 1a | 155 ± 5 mm | 1a |
| No. of experiments | n = 4 | n = 3 | ||
a In these cases, parameters were held fixed during the fit procedure.
b Only results of Ca2+-dependence induced by the proton release of EGTA are shown, due to negligible response of the biosensors under pH-regulated conditions.
The donor and acceptor components (Fig. 2, C and D, black/gray lines) exhibited no significant dependence directly to calcium when pH was constantly regulated to 7.2 during calcium titration (8% ± 2% and 9% ± 3% max. change for mCerulean and eCFP, as well as 5% ± 3% and 8% ± 4% max. change for mCitrine and eYFP). Consequently, the ratio of CEPAC* as well as EPAC* (Fig. 3C, black/gray lines) remained almost constant (2% ± 1% and 3% ± 4% max. change). However, as Ca2+ is rapidly bound to intracellular buffers in vivo, there arise indirect effects through the exchanges of H+ from the calcium-buffers. We mimicked this proton-carried secondary calcium effect in vitro by leaving the pH to change freely after a first adjustment to pH 7.2 before any addition of calcium. EGTA was acting as a replacement for intracellular calcium buffer-proteins. Under these conditions, the calcium dependence of the donor and acceptor components (Fig. 2, C and D, blue lines) exhibited a quenching of the fluorescence at increasing [Ca2+] levels mainly for the acceptor. At very low [Ca2+] levels of 1–30 nm, there were no significant changes in the fluorescence intensity of donor and acceptor components. At physiological [Ca2+] fluctuations, ranging from 30 nm up to several hundred μm, a strong calcium dependence of 51 ± 1% fluorescence reduction was seen for the eYFP component, whereas it was significantly lower (10 ± 2%) for mCitrine. The donor components did not show any significant calcium dependence (4 ± 1% and 9 ± 4% reduction for mCerulean and eCFP). The acceptor/donor ratio of EPAC* changed within the same [Ca2+] range (Fig. 3C). Consequently, the ratio of CEPAC* remained almost constant (6 ± 2%), whereas the ratio of EPAC* was reduced by 42 ± 8%. Similarly to the pH response, the FRET value EfDA/γ given in Fig. 3D exhibited a [Ca2+] insensitivity in the range from 1 nm to 1 mm for both biosensors.
The chloride dependence of the unmixed donor and acceptor component is shown in Fig. 2 (E and F). Within a [Cl−] fluctuation range from 400 μm to 80 mm, the donor components remained stable (changes of only 3 ± 1% and 8 ± 8% for mCerulean and eCFP). The strongest dependence was observed for the eYFP component of EPAC*, which decreased by 28 ± 4%, whereas mCerulean varied only by 3 ± 2%. A similar [Cl−] characteristic was found in the FRET ratio (Fig. 3E). Although the ratio remained constant for CEPAC* (±1%), it dropped by about 34 ± 2% for EPAC*. Consequently, the FRET value, EfDA/γ, shown in Fig. 3B, exhibited a high [Cl−] stability in the range of 400 μm to 80 mm for both cAMP biosensor versions.
In summary, the results show that there is an inaccuracy in ratiometric FRET measurements using the cAMP biosensors that may be caused by pH fluctuations and to a smaller extent during physiological fluctuations in chloride concentrations. Such imprecision in [cAMP] estimates measured with EPAC* are significantly reduced when CEPAC* is used. The multi-excitation wavelength approach, EfDA/γ, however, showed no significant ion sensitivity.
Formation of Fluorescent Granules
In our studies, we observed a progressive formation of fluorescent granules in cells expressing EPAC*. The fluorescent granules seem to consist of protein aggregates that severely disturb the analysis of FRET signals by depleting the available biosensor from surrounding regions. The aggregates also seem to exert some degree of cytotoxicity. To analyze this phenomenon, we compared the protein expression rate and cell viability of both biosensor constructs.
The expression of CEPAC* occurred much faster than for EPAC* (Fig. 4A). In the case of CEPAC* expression, fluorescent cells appeared already at 6 h after transfection, and there was a sufficient number of cells 10 h after transfection. As for the expression of EPAC*, there was a delay of 10 h until the first fluorescent cells were detectable, and a 14–16 h delay was necessary to allow measurements in a sufficient number of cells.
FIGURE 4.

Improved maturation kinetics and reduced tendency of aggregation. Cells transfected with CEPAC* or EPAC* and selected randomly at different time points after transfection were imaged for transgenic expression. A, CEPAC* expression can be detected as early as 6 h post-transfection, and expression levels remain high and uniform throughout the observed time period of 20 h. In contrast, EPAC*-transfected cells show the first signs of transgenic expression only after 10 h and remain uniform for only 3 h. After 14 h, the first cells expressing EPAC* start to show fluorescent aggregates, with aggregates increasing in number and size throughout the remaining observation period. B, illustration of an intensity line scan along a cell together with the intensity readout, used for determining the granularity. C, plot of granularity as a function of time, displaying mean values and S.E. (error bars) of 3 cells/time point. In cells transfected with CEPAC* (black), there is little change over time, whereas cells expressing EPAC* (gray) exhibit aggregation as early as 13 h post-transfection and at the end of the observation period display a significant increase in granularity compared with cells expressing CEPAC*. D, viability of cells expressing CEPAC* (continuous black line) or EPAC* (gray line) and of control cells (dashed black line) was detected over a time period of several h using the MTS cell proliferation assay. Shown are mean and S.E. results from the plate reader.
In cell cultures expressing CEPAC*, there were no signs of protein aggregation until 20 h post-transfection time, which normally was the end of the analysis time frame (Fig. 4, B and C). Cells even revealed significant expression up to 2 days after transfection (not shown). In contrast, EPAC* showed an early onset of protein aggregation already at 16 h after transfection, and after 20 h, all cells showed protein aggregation. Cytotoxicity of the aggregated EPAC* became obvious when transfected cells started to get smaller showing signs of apoptosis and cell density within the culture decreased. In a cell viability assay of cells transfected with either CEPAC* or EPAC* using mock-transfected cells as control (Fig. 4D), we observed that CEPAC*-transfected cells showed a similar viability as mock-transfected cells, whereas EPAC*-transfected cells revealed a decreasing viability already 10–12 h after transfection, which is the time window when EPAC* expression started (Fig. 4A).
Operation of CEPAC* and Dependence of the Biosensor Signal on Intracellular pH Fluctuations in Single Cell Experiments
The function of CEPAC* was confirmed by FRET measurements in single N1E-115 neuroblastoma cells co-transfected with plasmids encoding for CEPAC* and for 5-HT1AR. Temporal changes in [cAMP] were measured as described previously (1). 5-HT1AR is a Gi-protein-coupled seven-helix receptor inducing inhibition of adenylyl cyclases and consequently a decline of intracellular [cAMP] (31). In order to effectively provoke a decrease of [cAMP] levels by receptor agonist application, the cAMP level was first elevated by application of the adenylyl cyclase activator forskolin (100 nm) 10 min before the receptor agonist was applied. The applied forskolin concentration corresponded with its EC50 value (98 ± 45 nm) for cAMP formation, as determined in separate experiments (data not shown). The 5-HT1AR agonist serotonin applied in a 1 μm concentration induced an increase in the acceptor/donor channel ratio (implying a [cAMP] decrease), whereas the receptor antagonist WAY 100635, applied at 1 μm, returned the ratio values to control levels. Because the absolute values of the acceptor/donor channel ratio depend on the microscopic equipment, they are not necessarily equal to the acceptor/donor channel ratio presented in the cAMP calibration curve of Fig. 1, C and D. Therefore, we performed a separate cAMP calibration curve for the microscope (data not shown) in order to assign quantitative [cAMP] values. This revealed a 5-HT1AR-induced change of [cAMP] from ∼70 to 7 μm and a recovery to 50 μm after application of the 5-HT1AR antagonist (mean values from 26 cells; Fig. 5A). Fig. 5B demonstrates the variability between cells of the quantitative [cAMP] values, including two measurements of each cell before and during serotonin stimulation. The analysis shows that several cells reached [cAMP] levels above 1 mm, which is outside the dynamic range of CEPAC* where the ratio to [cAMP] assignment is defective. The time constant of about 100 s of the increase and decrease seems to be a consequence of the slow exchange of the solution in the bath chamber.
FIGURE 5.

Performance of CEPAC* and sensitivity of the biosensor signal to intracellular pH fluctuations in single cell experiments. N1E cells were co-transfected with the 5-HT1AR together with CEPAC*. Cells were preincubated in 100 nm forskolin. Subsequently, 1 μm serotonin and 1 μm WAY 100635 were applied. A, the acceptor/donor channel ratio time lapse (black line) was constructed from the averaged values of 26 cells and was assigned with quantitative [cAMP]. S.E. is displayed as a gray line. B, two averaged [cAMP] pictures of cells at different time spans (t1 and t2), including the 26 regions of interest/picture (white) used for A. t1 represents a time span before serotonin application, and t2 is the time during serotonin application as labeled in A. The [cAMP] values were translated into a color code. C, influence of intracellular pH fluctuations on the [cAMP] readout presented as normalized YFP/CFP ratio. To induce intracellular pH, the pH of the extracellular buffer was changed. Extracellular application of pH 6.5 resulted in an intracellular pH drop from pH 7.35 to pH 7.05. Although this pH change did not affect CEPAC*, EPAC* reacted with an apparent false positive cAMP signal. After changing the intracellular pH, both biosensors still reacted normally to their stimulus of forskolin, indicating a rise in [cAMP]i. D, maximal changes of the biosensor signal induced either by an internal pH shift or by a 1 μm forskolin application. For both biosensors, values represent average and S.E. (error bars) of 12–13 cells.
Although in standardized tests, CEPAC* are clearly superior to EPAC*, we studied whether the biosensor readout of both biosensors is influenced by pHi fluctuations within (patho)physiological range. To simulate hypoxia (32, 33), we exposed the cells to a series of extracellular solutions buffered at different pH (pH 7.4, 6.5, and 8.0). Flögel et al. (25) showed that a change of extracellular pH results in a significant change of pHi in N1E-115 cells. In calibration experiments with a pH indicator, SNARF-5F (data not shown), we verified that such manipulations result in pHi values of 7.35, 7.05, and 7.4 under our experimental conditions.
Fig. 5C shows the result of the normalized biosensor readout (here a record of one cell in each case) by changing the intracellular buffer of CEPAC*- and EPAC*-transfected cells. Application of 1 μm forskolin after the series of pH change resulted in an acceptor/donor channel ratio decrease (implying a [cAMP] increase), which proved that cells were still functional and intact. Fig. 5D shows an average of normalized acceptor/donor channel ratio of 12–13 cells at the maximum pH difference and the maximum forskolin difference for both biosensors.
Although the pHi change did not affect CEPAC*, EPAC* reacted with an apparent false positive cAMP signal. After changing the pHi, both biosensors still reacted normally to forskolin, indicating a rise in [cAMP]i. The false positive cAMP signal (−0.09 ± 0.01) of EPAC* was nearly twice as large as the forskolin response (−0.05 ± 0.01).
Impact on Neuronal Dendrite Growth and Measurable cAMP Activity
The impact of biosensors on the dendrite growth of neurons was measured in primary hippocampal cells that were dissociated and transfected with CEPAC* or EPAC* after 4 days of explantation on a coverslip. After an additional 4 days allowed for biosensor protein expression and dendrite growth, cells were fixed and analyzed. We found more neurons transfected with CEPAC*, revealing a more homogenous distribution of CEPAC* even in spines of dendrites Fig. 6C, whereas EPAC* was clustered in many cases (Fig. 6B), and other neurons were dead. As a parameter for neuronal growth, the total dendrite length of still intact neurons was analyzed. Fig. 6A shows an exemplary primary cell transfected with CEPAC*, including the lines for length measurements. Fig. 6D compares the total dendrite length of 6 neurons/coverslip for each biosensor. EPAC* shows a clear tendency (p = 0.07 for t test) to have a reduced dendrite growth compared with CEPAC*.
FIGURE 6.

Influence of biosensor expression on neurite outgrowth in transfected primary hippocampal cultures. Primary cell cultures of hippocampal neurons on coverslips were transfected with CEPAC* or EPAC* after 4 days of explantation. After a further 4 days of biosensor protein expression, cells were fixed and analyzed. A, an exemplary primary cell transfected with CEPAC*, including lines for length measurements of dendrites. B, an exemplary primary cell with fluorescent granules after transfection with EPAC*. C, three exemplary dendritic spines of primary neurons, showing homogenous distribution of CEPAC* in the spines and dendrites. D, a comparison of total summed neurite length between primary cells transfected with either CEPAC* or EPAC*. E, the percentage of cells reacting to stimulation for each respective biosensor, given as the mean and S.D. (error bars) of cAMP response rates. These experiments were done in N1E cells co-transfected with the 5-HT1AR together with CEPAC* or EPAC* from eight and seven different preparations, respectively.
Measurements of cAMP levels after receptor activation in CEPAC* + 5-HT1AR- and EPAC* + 5-HT1AR-co-transfected cells revealed that not all of these cells reacted to receptor activation. Therefore, we selected a region of interest on every coverslip (e.g. see Fig. 5B) and analyzed a comparable number of cells in their average response rate. The response rates of 7–8 different preparations are presented in Fig. 6D. Cells expressing CEPAC* revealed a much higher response rate of about 89 ± 9% as compared with only 33 ± 7% of cells expressing EPAC*.
DISCUSSION
Most tandem fluorophore FRET biosensors have been designed for ratiometric measurements, which use single fluorescence excitation rather than multi-excitation protocols that require more complex formalisms and calibration steps. It has been shown, however, that a cAMP biosensor with a conventional eCFP/eYFP FRET pair is not optimal for studying physiological processes quantitatively because changes in the ionic environment lead to changes of the acceptor fluorescence intensity (1) that are unrelated to cAMP. Improvements of this biosensor with respect to its FRET efficiency were achieved by exchanging the FRET pair with advanced fluorophores (18). Here, we investigated the consequences of such an improvement on the ion dependence (within the physiological range) and the aggregation behavior of the biosensor. We replaced the eCFP/eYFP FRET pair (EPAC*) with mCerulean and mCitrine (CEPAC*), respectively, in order to allow reproducible and reliable quantitative ratiometric [cAMP] analyses. In the following, we discuss the function, FRET efficiency, ion dependence, and aggregation behavior of the new biosensor in comparison with EPAC*.
CEPAC* has a single cAMP-binding domain (Hill coefficient of 1) and therefore shows the same biosensor function as EPAC*. Binding of cAMP leads to a decrease of acceptor and an increase of donor fluorescence (Fig. 1, A and B). A similar binding affinity toward cAMP can be assumed, because the [cAMP] calibration curves reveal an EC50 value for CEPAC* similar to that for EPAC* and correspond to the value presented by Ponsioen et al. (7) for EPAC*.
The FRET efficiency difference (ΔE) revealed a higher dynamic range for CEPAC* (CEPAC* ΔE = 13.6% versus EPAC* ΔE = 6.5%). Also, other groups have shown that such exchange of the FRET pair by advanced fluorophores results in an increase of the ΔE (18) and improves the signal/noise ratio. The signal/noise ratio of CEPAC* was further improved due to the equally strong brightness of donor and acceptor under experimental conditions (mainly at low [cAMP]; Fig. 1, A and B).
We confirmed that CEPAC* was fully functional by measuring quantitative [cAMP] response curves (Fig. 5B) in single cell experiments after activation and blockade of a Gi-coupled receptor. As expected, CEPAC* detected a decrease of [cAMP] induced by 5-HT1AR activation that was blocked by an antagonist application. Preincubation of cells in 100 nm forskolin increased the [cAMP] on average to 100 μm and in some cells even over 1 mm. Such a large concentration might not happen in all of a cell cytosol under physiological conditions, but this helped us to observe a clear [cAMP] decrease.
With regard to the sensitivity of the FRET signal to changes of H+, chloride, and calcium concentration (Fig. 3), we found different characteristics between the multi-excitation approach EfDA/γ and donor/acceptor ratio using a single excitation. For EfDA/γ, both biosensors exhibit a similar stability at varying ion concentrations, which can be expected because EfDA/γ is insensitive against non-FRET-related intensity changes of the acceptor (1). In contrast, the acceptor/donor ratio of the EPAC* biosensor is heavily disturbed by ionic concentration changes within physiological levels; no such disturbances were found for CEPAC*. These changes were mainly attributed to changes in acceptor fluorescence intensity (Fig. 2). In the case of H+ and Cl−, the Hill values of the present measurements for eYFP (EC50: pH 7.2, and 130 mm [Cl−]) correlate well with published data for the single fluorophore (EC50: pH 6.9, and 110 mm [Cl−]) (34). Such data were not available for the Ca2+ dependence of the used fluorophores. The acceptor/donor ratio of both biosensors is insensitive to direct calcium changes measured in vitro (Fig. 3C, black/gray lines). It is, however, important to note that binding of Ca2+ to calcium buffering proteins results in a proton release (39–41). We mimicked this in vitro by using EGTA as a replacement for a calcium-buffer protein. Under these conditions, CEPAC* exhibits only a slight decrease in acceptor/donor ratio of about 6% by varying [Ca2+] within the functionally important range of 30 nm to 1 μm. In contrast to EPAC*, such alterations in the calcium level lead to major changes of the acceptor/donor ratio (42%; Fig. 3C, blue lines), which cover almost the complete dynamic range of the biosensor (46%; Fig. 1D). In vivo, such changes may not be negligible when calcium is released at high μm concentrations within the microdomains near Ca2+-channels or at release sites from intracellular stores (42–45). In this case, the proton release may change pHi and, therefore, contribute to the EPAC* signal. We ascribe this as a secondary calcium effect on EPAC* in vivo. Such secondary calcium effects can be neglected when CEPAC* is used. In the case of pH, the acceptor/donor ratio changes were found to be about 4 times larger than the complete dynamic range of the biosensor. Within a normal physiological pH range (pH 6.8–7.5), however, the ratio changes were negligible (14%) for CEPAC*, whereas they were significantly higher (71%) for EPAC*. Finally, changes in chloride concentration also influenced the acceptor/donor ratio of EPAC* but to a lesser extent than other ions. However, in the case of CEPAC*, there was no chloride dependence on the acceptor/donor ratio, making it an improved and more suitable biosensor for quantitative ratiometric [cAMP] measurements in physiology.
The disturbance of [cAMP] measurements caused by fluctuations of ion concentrations is an important factor, particularly for neurons, which normally are continuously active and experience permanent influence by neuromodulators often targeting not only the cAMP pathway but directly or indirectly also the calcium signaling cascades (e.g. see Ref. 35). The influence of changes of the pH and chloride concentration on FRET measurements is essential under pathophysiological conditions, such as hypoxia and ischemia. Under such pathophysiological conditions, all three variables, such as H+, Cl−, and Ca2+, accumulate to disturb reliable cAMP measurements.
The pHi in healthy neurons can rapidly change upon activity. For example, in respiratory neurons, the pHi of 7.15 falls up to 0.2 pH unit during synaptic inhibition (14). Glutamate-induced excitotoxicity in hippocampal neurons was found to provoke an acidification of up to 0.5 unit of pHi due to displacement of H+ from internal binding sites by glutamate-induced increase in cytosolic Ca2+ (36). In pathological situations, hypoxia and ischemia are accompanied by a dramatic drop of pHi (decreasing by 0.5–1 unit). This decrease probably results from an immediate blockade of oxidative phosphorylation and activation of glycolysis (37). To simulate such conditions, we evoked mild changes in pHi homoeostasis and analyzed how the two different biosensors reacted. Although CEPAC* was not influenced by pHi fluctuations, a moderate pHi drop from 7.25 to 7.05 resulted in a significant EPAC* biosensor signal equivalent to a change of [cAMP] induced by 1 μm forskolin. Due to the described ion-dependent characteristic of the biosensors, CEPAC* is preferred to EPAC* for the usage of the ratiometric FRET methods.
The ideal behavior of a genetically encoded FRET biosensor is a fast protein expression and a uniform distribution, which was achieved with CEPAC* (Fig. 4). In contrast to EPAC*, CEPAC* showed virtually no sign of protein aggregation and, because of reduced cytotoxicity, allows measurements in small and narrow cellular compartments like dendrites. We suppose that the tendency for aggregation restricts the function of cAMP sensing because our cell experiments exhibited twice the number of responsive cells transfected with CEPAC* as compared with those with EPAC* (Fig. 5C). The aggregation might be caused by the dimerization motif present in eCFP and eYFP. This motif was removed in mCerulean and mCitrine, whereas the biosensor protein backbone was left unmodified in CEPAC*. The slow expression of EPAC* might also hint at problems associated with a failure of chaperone function resulting in incorrect protein folding and therefore aggregation. Such cytotoxicity became obvious in primary hippocampal neuron cultures transfected with either biosensor. The total dendrite length and the maximal length of dendrites in CEPAC*-transfected neurons were nearly twice as large as the values for EPAC*-transfected cells. Although the difference was not highly significant, one must remember the fact that we could only analyze living EPAC* cells. Although the overall appearance of the EPAC* neurons was poorer, many cells showed protein aggregations similar to those seen in N1E cells. Therefore, we assume that many neurons underwent apoptosis before being fluorescently labeled. Such aggregation was virtually absent in CEPAC*-transfected neurons.
In conclusion, we show that the use of ion-dependent FRET pairs like eCFP/eYFP results in significant artifacts in particular for ratiometric FRET measurements (using a single wavelength excitation), assuming physiological fluctuations of intracellular ion concentrations (38). FRET pairs, such as mCerulean/mCitrine, with more stable fluorescent properties with respect to ion concentration and with an enhanced dynamic range of the FRET efficiency response, are superior. This is especially the case when measuring specific physiological processes or in certain samples in which background effects, such as fluctuations in ion concentration, are expected. Additional advantages include faster expression, longer stability, and a reduced tendency to aggregate, which allow measurements in microdomains. The improvements made to the FRET-based [cAMP] biosensors can be implemented for any other FRET-based biosensor.
Acknowledgments
We thank Dr. Kees Jalink (Department of Cellular Biophysics, The Netherlands Cancer Institute), who kindly provided cDNA encoding for the CFP-Epac(δDEP-CD)–YFP fusion construct, and Prof. Dr. Evgeni Ponimaskin (Department of Zelluläre Neurophysiologie (OE4230), Medizinische Hochschule Hannover), who kindly provided cDNA encoding for the 5-HT1AR fusion construct. We are grateful to Dr. Andrew Woehler for expert help and discussions.
This work was supported by the Deutsche Forschungsgemeinschaft through the Research Center for Molecular Physiology of the Brain (FZT 103)/Cluster of Excellence 171.
- eCFP
- enhanced cyan fluorescence protein
- 5-HT1AR
- serotonin receptor subtype 1A
- WAY 100635
- selective 5-HT1AR antagonist
- EPAC*
- cAMP-detecting FRET biosensor CFP–Epac(δDEP-CD)–YFP
- CEPAC*
- cAMP-detecting FRET biosensor mCerulean–Epac(δDEP-CD)–mCitrine
- eYFP
- enhanced yellow fluorescence protein
- N1E-115
- mouse neuroblastoma cell line
- mCerulean
- monomeric CFP with S72A/Y145A/H148D/A206K point mutations
- mCitrine
- monomeric YFP with Q69M/A206K point mutations
- MTS
- 3-(4,5-dimethylthiazol-2-yl)-5-(3-carboxymethoxyphenyl)-2-(4-sulfophenyl)-2H-tetrazolium, inner salt.
REFERENCES
- 1. Salonikidis P. S., Zeug A., Kobe F., Ponimaskin E., Richter D. W. (2008) Biophys. J. 95, 5412–5423 [DOI] [PMC free article] [PubMed] [Google Scholar]
- 2. Zaccolo M., Pozzan T. (2002) Science 295, 1711–1715 [DOI] [PubMed] [Google Scholar]
- 3. de Rooij J., Rehmann H., van Triest M., Cool R. H., Wittinghofer A., Bos J. L. (2000) J. Biol. Chem. 275, 20829–20836 [DOI] [PubMed] [Google Scholar]
- 4. Ponimaskin E. G., Heine M., Zeug A., Voyno-Yasenetskaya T., Salonikidis P. S. (2007) in Serotonin Receptors in Neurobiology (Chattopadhyay A. ed) pp. 19–40, CRC Press, Inc., Boca Raton, FL: [PubMed] [Google Scholar]
- 5. DiPilato L. M., Cheng X., Zhang J. (2004) Proc. Natl. Acad. Sci. U.S.A. 101, 16513–16518 [DOI] [PMC free article] [PubMed] [Google Scholar]
- 6. Nikolaev V. O., Bünemann M., Hein L., Hannawacker A., Lohse M. J. (2004) J. Biol. Chem. 279, 37215–37218 [DOI] [PubMed] [Google Scholar]
- 7. Ponsioen B., Zhao J., Riedl J., Zwartkruis F., van der Krogt G., Zaccolo M., Moolenaar W. H., Bos J. L., Jalink K. (2004) EMBO Rep. 5, 1176–1180 [DOI] [PMC free article] [PubMed] [Google Scholar]
- 8. Miyawaki A., Llopis J., Heim R., McCaffery J. M., Adams J. A., Ikura M., Tsien R. Y. (1997) Nature 388, 882–887 [DOI] [PubMed] [Google Scholar]
- 9. Hoppe A., Christensen K., Swanson J. A. (2002) Biophys. J. 83, 3652–3664 [DOI] [PMC free article] [PubMed] [Google Scholar]
- 10. Wlodarczyk J., Woehler A., Kobe F., Ponimaskin E., Zeug A., Neher E. (2008) Biophys. J. 94, 986–1000 [DOI] [PMC free article] [PubMed] [Google Scholar]
- 11. Woehler A., Wlodarczyk J., Neher E. (2010) Biophys. J. 99, 2344–2354 [DOI] [PMC free article] [PubMed] [Google Scholar]
- 12. Patterson G., Day R. N., Piston D. (2001) J. Cell Sci. 114, 837–838 [DOI] [PubMed] [Google Scholar]
- 13. Jayaraman S., Haggie P., Wachter R. M., Remington S. J., Verkman A. S. (2000) J. Biol. Chem. 275, 6047–6050 [DOI] [PubMed] [Google Scholar]
- 14. Ballanyi K., Mückenhoff K., Bellingham M. C., Okada Y., Scheid P., Richter D. W. (1994) Neuroreport 6, 33–36 [DOI] [PubMed] [Google Scholar]
- 15. Duebel J., Haverkamp S., Schleich W., Feng G., Augustine G. J., Kuner T., Euler T. (2006) Neuron 49, 81–94 [DOI] [PubMed] [Google Scholar]
- 16. Müller M. (2000) Neuroscience 97, 33–45 [DOI] [PubMed] [Google Scholar]
- 17. Yao H., Haddad G. G. (2004) Cell Calcium 36, 247–255 [DOI] [PubMed] [Google Scholar]
- 18. van der Krogt G. N., Ogink J., Ponsioen B., Jalink K. (2008) PLoS One 3, e1916 [DOI] [PMC free article] [PubMed] [Google Scholar]
- 19. Griesbeck O., Baird G. S., Campbell R. E., Zacharias D. A., Tsien R. Y. (2001) J. Biol. Chem. 276, 29188–29194 [DOI] [PubMed] [Google Scholar]
- 20. Rizzo M. A., Springer G., Segawa K., Zipfel W. R., Piston D. W. (2006) Microsc. Microanal. 12, 238–254 [DOI] [PubMed] [Google Scholar]
- 21. Rizzo M. A., Springer G. H., Granada B., Piston D. W. (2004) Nat. Biotechnol. 22, 445–449 [DOI] [PubMed] [Google Scholar]
- 22. Zacharias D. A., Violin J. D., Newton A. C., Tsien R. Y. (2002) Science 296, 913–916 [DOI] [PubMed] [Google Scholar]
- 23. Papoucheva E., Dumuis A., Sebben M., Richter D. W., Ponimaskin E. G. (2004) J. Biol. Chem. 279, 3280–3291 [DOI] [PubMed] [Google Scholar]
- 24. Dityatev A., Dityateva G., Schachner M. (2000) Neuron 26, 207–217 [DOI] [PubMed] [Google Scholar]
- 25. Flögel U., Willker W., Leibfritz D. (1994) NMR Biomed. 7, 157–166 [DOI] [PubMed] [Google Scholar]
- 26. Patton C., Thompson S., Epel D. (2004) Cell Calcium 35, 427–431 [DOI] [PubMed] [Google Scholar]
- 27. Schoenmakers T. J., Visser G. J., Flik G., Theuvenet A. P. (1992) BioTechniques 12, 870–874, 876–879 [PubMed] [Google Scholar]
- 28. Thévenaz P., Unser M. (2007) Microsc. Res. Tech. 70, 135–146 [DOI] [PubMed] [Google Scholar]
- 29. Meijering E., Jacob M., Sarria J. C., Steiner P., Hirling H., Unser M. (2004) Cytometry A 58, 167–176 [DOI] [PubMed] [Google Scholar]
- 30. Lakowicz R. J. (2006) in Principles of Fluorescence Spectroscopy, 3rd Ed., pp 443–476, Springer, New York [Google Scholar]
- 31. Heine M., Ponimaskin E., Bickmeyer U., Richter D. W. (2002) Pflugers Arch 443, 418–426 [DOI] [PubMed] [Google Scholar]
- 32. Gores G. J., Nieminen A. L., Wray B. E., Herman B., Lemasters J. J. (1989) J. Clin. Invest. 83, 386–396 [DOI] [PMC free article] [PubMed] [Google Scholar]
- 33. Robertson R. M., Björnfors E. R., Sillar K. T. (2010) Neuroreport 21, 943–947 [DOI] [PubMed] [Google Scholar]
- 34. Nagai T., Ibata K., Park E. S., Kubota M., Mikoshiba K., Miyawaki A. (2002) Nat. Biotechnol. 20, 87–90 [DOI] [PubMed] [Google Scholar]
- 35. Woehler A., Ponimaskin E. G. (2009) Curr. Mol. Pharmacol. 2, 237–248 [DOI] [PubMed] [Google Scholar]
- 36. Hartley Z., Dubinsky J. M. (1993) J. Neurosci. 13, 4690–4699 [DOI] [PMC free article] [PubMed] [Google Scholar]
- 37. Lipton P. (1999) Physiol. Rev. 79, 1431–1568 [DOI] [PubMed] [Google Scholar]
- 38. Chesler M., Kaila K. (1992) Trends Neurosci. 15, 396–402 [DOI] [PubMed] [Google Scholar]
- 39. Krause K. H., Milos M., Luan-Rilliet Y., Lew D. P., Cox J. A. (1991) J. Biol. Chem. 266, 9453–9459 [PubMed] [Google Scholar]
- 40. Milos M., Schaer J. J., Comte M., Cox J. A. (1986) Biochemistry 25, 6279–6287 [DOI] [PubMed] [Google Scholar]
- 41. Sellers P., Laynez J., Thulin E., Forsén S. (1991) Biophys. Chem. 39, 199–204 [DOI] [PubMed] [Google Scholar]
- 42. Burnashev N., Rozov A. (2005) Cell Calcium 37, 489–495 [DOI] [PubMed] [Google Scholar]
- 43. Koivumäki J. T., Korhonen T., Tavi P. (2011) PLoS Comput. Biol. 7, e1001067 [DOI] [PMC free article] [PubMed] [Google Scholar]
- 44. Parekh A. B. (2008) J. Physiol. 586, 3043–3054 [DOI] [PMC free article] [PubMed] [Google Scholar]
- 45. Shahrezaei V., Delaney K. R. (2004) Biophys. J. 87, 2352–2364 [DOI] [PMC free article] [PubMed] [Google Scholar]