

Abstract
Dirichlet mixture priors provide a Bayesian formalism for scoring alignments of protein profiles to individual sequences, which can be generalized to constructing scores for multiple-alignment columns. A Dirichlet mixture is a probability distribution over multinomial space, each of whose components can be thought of as modeling a type of protein position. Applied to the simplest case of pairwise sequence alignment, a Dirichlet mixture is equivalent to an implied symmetric substitution matrix. For alphabets of even size L, Dirichlet mixtures with L/2 components and symmetric substitution matrices have an identical number of free parameters. Although this suggests the possibility of a one-to-one mapping between the two formalisms, we show that there are some symmetric matrices no Dirichlet mixture can imply, and others implied by many distinct Dirichlet mixtures. Dirichlet mixtures are derived empirically from curated sets of multiple alignments. They imply “background” amino acid frequencies characteristic of these sets, and should thus be non-optimal for comparing proteins with non-standard composition. Given a mixture Θ, we seek an adjusted Θ′ that implies the desired composition, but that minimizes an appropriate relative–entropy–based distance function. To render the problem tractable, we fix the mixture parameter as well as the sum of the Dirichlet parameters for each component, allowing only its center of mass to vary. This linearizes the constraints on the remaining parameters. An approach to finding Θ′ may be based on small consecutive parameter adjustments. The relative entropy of two Dirichlet distributions separated by a small change in their parameter values implies a quadratic cost function for such changes. For a small change in implied background frequencies, this function can be minimized using the Lagrange-Newton method. We have implemented this method, and can compositionally adjust to good precision a 20-component Dirichlet mixture prior for proteins in under half a second on a standard workstation.
Key words: algorithms, combinatorics, linear programming, machine learning, statistics
1. Introduction
Pairwise protein sequence alignments are almost always constructed with the aid of amino acid substitution matrices, used to assign scores to aligned pairs of amino acids. The scores si,j in matrices used for local alignment are implicitly of the log-odds form si,j = log(qi,j/pipj), where the qi,j are “target frequencies” with which amino acids correspond in accurately aligned related sequences, and the pi are “background frequencies” with which amino acids occur in proteins (Karlin and Altschul, 1990; Altschul, 1991). The most sensitive substitution matrices explicitly derive their target and background frequencies from large collections of aligned, related sequences, and the circularity in this procedure is mitigated by considering only alignments that are highly likely to be accurate (Dayhoff et al., 1978; Schwartz and Dayhoff, 1978; Henikoff and Henikoff, 1992).
Although standard substitution matrices such as the PAM and BLOSUM series are derived from protein collections with a particular background frequency vector  , they are sometimes used to compare proteins whose amino acid compositions differ greatly from
  , but this is in general non-optimal (Yu et al., 2003; Altschul et al., 2005). Accordingly, special purpose matrices have been derived for the comparison of certain classes of proteins (Ng et al., 2000; Müller et al., 2001), and a general procedure has been described for adjusting any standard substitution matrix for the comparison of sequences with non-standard compositions (Yu et al., 2003; Yu and Altschul, 2005).
Pairwise substitution matrices are frequently used for multiple protein sequence alignment (Murata et al., 1985; Bacon and Anderson, 1986; Thompson et al., 1994). However, an appealing alternative approach (Altschul et al., 2010) relies instead upon Dirichlet mixture models, which were originally proposed for the comparison of individual sequences to protein profiles (Brown et al., 1993; Sjölander et al., 1996). Like the BLOSUM substitution matrices (Henikoff and Henikoff, 1992), Dirichlet mixtures are derived from collections of protein multiple alignments. They imply symmetric target frequencies for pairwise sequence comparison, which generalize naturally to multiple alignment, as well as a set of standard background amino acid frequencies  . Like pairwise substitution matrices, a Dirichlet mixture should be non-optimal for the comparison of proteins whose amino acid composition differs greatly from
  . Because it requires a large collection of multiple alignments, and a great deal of effort, to derive a particular Dirichlet mixture model (Brown et al., 1993; Sjölander et al., 1996), it is impractical to derive such a model anew for each set of proteins with nonstandard composition one wishes to analyze. Accordingly, it would be useful to be able to adjust a standard Dirichlet mixture for use in a non-standard compositional context. This article's central concern is to describe a reasonable way in which this may be accomplished. A preliminary step, however, is to describe and analyze various connections between Dirichlet mixtures and pairwise substitution matrices that may elucidate both formalisms.
2. Review Of Dirichlet Mixture Priors
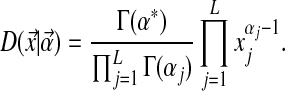
A Bayesian approach to protein sequence alignment and analysis begins with the postulate that, within protein families, the probability of amino acids occurring at a particular position may be described by a multinomial distribution. This distribution is never known precisely, but it may be inferred from a prior belief concerning the probabilities of different multinomial distributions, and observations of amino acids actually found at the position in question. For ease of calculation, it is convenient to assume the prior distribution over multinomials takes the form of a Dirichlet distribution (MacKay, 2003), or a mixture of Dirichlet distributions (Brown et al., 1993; Sjölander et al., 1996). In brief, for an alphabet with L letters, the space of multinomials consists of all L-dimensional vectors  with positive components that sum to 1. Because of this constraint, the space of multinomials is L − 1 dimensional. A Dirichlet distribution D over this space is specified by an L-dimensional vector
  of positive parameters; it is convenient to define
  as
as  . The probability density of the Dirichlet distribution at
  is defined as
 |
(1) |
where the normalizing scalar  ensures that integrating D over its domain yields 1. One may show that the expected value of
  is
is  . Larger values of
  correspond to distributions that are more concentrated near this expected value, whereas values of
  near 0 correspond to distributions with their density concentrated near the space's boundaries. The uniform density is a special case of the Dirichlet distribution that arises when all the αj are 1. For Bayesian analysis it is convenient to use a Dirichlet distribution as a prior because, after the observation of a single letter a, the posterior distribution is another Dirichlet distribution, whose parameter vector
  is identical to
  , except that
  .
.
Available knowledge concerning proteins is much too rich to be captured well by a single Dirichlet prior, because several different regions of multinomial space, corresponding to different natural residue classes (e.g., hydrophobic, charged, aromatic, etc.), should have high prior probabilities. This idea can be captured by a Dirichlet mixture (Brown et al., 1993; Sjölander et al., 1996), which is simply the sum of a finite number M of Dirichlet distributions, each multiplied by a positive mixture parameter mi, with  . We call the parameters of the ith Dirichlet distribution
  , and define
  to be
to be  . Fortunately, Dirichlet mixtures are not much more difficult to work with than single Dirichlet distributions. The expected value of
  is just
  , and the posterior distribution after the observation of a single letter remains a Dirichlet mixture, with easily calculated parameters (Brown et al., 1993; Sjölander et al., 1996; Altschul et al., 2010).
3. Dirichlet Mixtures and Pairwise Substitution Matrices
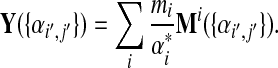
Local pairwise substitution matrices are characterized by their estimates of the probabilities qi,j that, in an accurate alignment of two related sequences, amino acids i and j are aligned at an arbitrary position (Altschul, 1991). Similarly, given a Bayesian prior Θ over multinomial space, one may calculate the probability qi,j of observing the two amino acids i and j at any particular position. An advantage of the Bayesian formalism is that it generalizes naturally to calculating probabilities  for the observation of more than two aligned amino acids (Altschul et al., 2010).
It is possible to specify asymmetric target frequencies qi,j, implying asymmetric substitution scores si,j, for aligning two sequences, and this makes sense when the sequences being compared have differing background amino acid distributions (Yu et al., 2003). The Bayesian formalism implies symmetric target frequencies, and so does not lend itself naturally to the comparison of sequences with differing background distributions.
For an alphabet of size L, a Dirichlet mixture prior with M components has M(L + 1) − 1 free parameters. Each Dirichlet component Di has the usual L Dirichlet parameters  plus a mixture parameter mi, but because the mixture parameters must sum to 1, only M − 1 of them are independent. Note that, so long as the implied probability density is nowhere negative, one need not require the mixture parameters to be positive, although it is intuitively appealing to do so.
Fixing its scale, and specifying a symmetric pairwise substitution matrix for an alphabet of size L by its target frequencies, we observe that the matrix has L(L + 1)/2 − 1 free parameters; the −1 arises from the requirement that the target frequencies sum to 1. For an alphabet of L letters, with L even, a Dirichlet mixture with L/2 components thus has exactly as many free parameters as a symmetric substitution matrix. It is tempting to postulate that, in this case, there is a one-to-one correspondence between L/2-component Dirichlet mixtures and fixed-scale symmetric substitution matrices, up to a relabelling of the Dirichlet components. Were this the case, every symmetric protein substitution matrix, for example, would correspond to an effectively unique 10-component Dirichlet mixture prior.
Unfortunately, no such one-to-one correspondence in general exists. Each Dirichlet mixture, of whatever number of components, implies a unique symmetric substitution matrix. However, the target frequency matrix implied by a Dirichlet mixture must be positive definite (Appendix A), whereas it is perfectly possible to specify symmetric target frequencies that are not positive definite. Furthermore, it is possible to construct distinct L/2-component Dirichlet mixtures that imply identical pairwise target frequencies (Appendix A).
Pairwise substitution matrices (Dayhoff et al., 1978; Schwartz and Dayhoff, 1978; Henikoff and Henikoff, 1992) and Dirichlet mixture priors (Brown et al., 1993; Sjölander et al., 1996) may be derived from the same type of data - curated multiple sequence alignments, assumed to be accurate - but are based upon two distinct formalisms. There is no reason to believe that, for pairwise sequence comparison, Dirichlet mixtures should afford any advantage. In this context, the performance of a Dirichlet mixture is completely determined by its implied pairwise target frequencies, but these frequencies are estimated only indirectly, mediated by the Dirichlet mixture formalism. If fewer than L/2 components are allowed, many unnecessary dependencies among the target frequencies are imposed, whereas even with L/2 or more components, some sets of possible target frequencies are unobtainable. Furthermore, it is in general not computationally feasible to truly optimize Dirichlet mixture parameters given a set of data (Sjölander et al., 1996), and heuristic methods must be employed. In contrast, it is fairly simple to estimate target frequencies directly, and then to construct corresponding substitution matrices (Henikoff and Henikoff, 1992).
Where Dirichlet mixtures gain their advantage is for the alignment of multiple (i.e. more than two) sequences. First, Dirichlet mixtures generalize the theoretically well-founded log-odds scores naturally to the multiple alignment case (Altschul et al., 2010), whereas multiple alignment scores based upon pairwise substitution matrices (Murata et al., 1985; Bacon and Anderson, 1986) have no satisfying theoretical justification. Second, the Dirichlet mixture formalism, especially when more than L/2 components are employed, is able to capture structure in the curated multiple alignment data that must escape pairwise substitution matrices. Of course it is possible to try to fit too many parameters to a given set of data, and it would be interesting to apply the Minimum Description Length (MDL) principle (Grünwald, 2007) to the question of how many Dirichlet components a given set of curated multiple alignment data can optimally support.
4. Adjusting Dirichlet Mixtures For Non-Standard Compositions
4.1. An ideal formulation
To adjust a “standard” pairwise substitution matrix, derived from a set of data with “standard” amino acid frequencies  , for the comparison of sequences with non-standard compositions
  , Yu et al. (2003) took the following approach. They first showed that each substitution matrix implies a specific set of background amino acid frequencies, and therefore proposed to select an “adjusted” matrix from among those that imply
  . They defined the best such matrix as that which is closest, by an appropriate metric, to the original matrix. We propose to adapt this basic strategy to the compositional adjustment of Dirichlet mixtures.
Assume we are given a Dirichlet mixture Θ with M components, and that its ith component Di has Dirichlet parameters  and mixture parameter mi. To analyze proteins with nonstandard amino acid frequencies, we seek an M-component Dirichlet mixture Θ′ whose implied background frequencies are
  , and that minimizes an objective function G(Θ′; Θ). (The notation
  and
and  will apply to Θ′.) Formally, the constraints on the parameters of Θ′ are given by
 |
(2) |
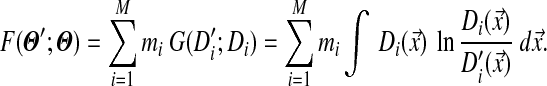
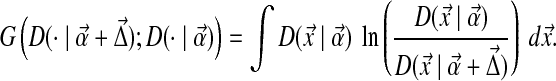
for j from 1 to L. By analogy to Yu et al. (2003), a reasonable choice for G is the relative entropy of Θ′ and Θ:
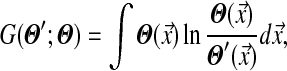 |
(3) |
where the integration is performed over multinomial space. Intuitively, the Θ′ that minimizes G can be thought of as the least surprising Dirichlet mixture, given Θ, that satisfies the constraints (2). G is non-negative, and is 0 only when Θ′ = Θ, but it is not symmetric in Θ′ and Θ.
Unfortunately, it is difficult to work with equation (3) analytically, and furthermore the constraints on the parameters of Θ′ imposed by eq. (2) are nonlinear, and may even imply discontiguous regions of parameter space. We have not been able to find an efficient algorithm for solving this idealized version of the problem, and so reformulate the problem below into a tractable form.
4.2. A practical formulation
The nonlinearity of the constraints on the parameters of Θ′ is our greatest initial problem. The individual components Di of a Dirichlet mixture can be understood as describing certain types of positions found within proteins, and the mixture parameters  can be understood as describing the frequency with which these types of positions tend to arise. Although proteins may have non-standard amino acid compositions for a variety of reasons, it is useful to consider two broad reasons, which have different implications for which parameters of a Dirichlet mixture should change. First, the genomes of certain organisms have strong AT or CG nucleotide biases, which influence the amino acid usage within the organisms' proteomes (Sueoka, 1988; Wan and Wootton, 2000). The frequency with which protein position types are found within these organisms is presumably largely unaffected, but the amino acid frequencies found at all positions are biased in a general direction. For non-standard amino acid frequencies due to this cause, one might therefore consider fixing the mixture parameters
  equal to
  , but letting the parameters of all the Di vary.
In contrast, some protein families have structural features that strongly favor the occurrence of certain types of protein positions (e.g. hydrophobic, charged, etc.), thereby producing non-standard amino acid usage. To adjust a Dirichlet mixture for use with such a family, one might consider fixing the Di, and letting only the mixture parameters vary. We will consider each of these two approaches separately.
4.3. Fixed mixure parameters
Even once one has fixed the mixture parameters  , the constraints imposed by eq. (2) on the remaining parameters remain non-linear. We therefore propose to further restrict the problem by fixing
  equal to
  for each Dirichlet component. In other words, the “peakedness” of each Dirichlet component is fixed, and only its center of mass is allowed to change; this seems to be a reasonable concession in the interest of tractability. Note that there always remain at least as many free parameters as constraints, and furthermore that the constraints are consistent because there is always a feasible solution with
  .
.
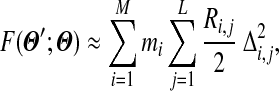
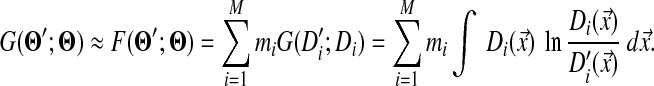
A remaining difficulty is that G(Θ′; Θ) of equation (3) is not analytically tractable, so we seek to approximate it with a different function. As a practical matter, Dirichlet mixtures for proteins are derived primarily from analyses of multiple alignment data (Brown et al., 1993; Sjölander et al., 1996), and the MDL principle (Grünwald, 2007) suggests that two or more components with very similar parameters would be better collapsed into one. Accordingly, we will assume that the densities of individual components of a Dirichlet mixture do not greatly overlap. This allows us to approximate G by
 |
(4) |
F is analytically tractable. First, as described in Appendix B, F can be written in closed form and, given the constraints on the parameters of Θ′, it can be shown to have a unique minimum. However, given the  yielding this minimum, if one were to seek the Dirichlet mixture implying
  and minimizing
 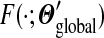 , one would not reconstruct Θ, due to the asymmetry of eq. (4). Accordingly, we have found that an appealing alternative approach is to recast the minimization problem into a local form, as described below.
Imagine changing the background frequencies from  to
to  in a series of N steps, in each of which the background frequencies change by
  . One such step will entail changing Θ to Θ′, whose parameters
  can be written as
  . For N large,
  will be small, and as described in Appendix B, we can write
 |
(5) |
where Ri,j is the trigamma function of αi,j, which can be written most simply as
 |
(6) |
For computational purposes, formulas that converge much more rapidly than eq. (6) are available (Schneider, 1978). Because (5) is quadratic, and the constraints on the Δi,j are linear, we may find the  that minimize F using the Lagrange-Newton method, as described in Appendix C.
Note that Ri,j approaches 1/αi,j for αi,j large, and 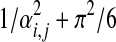 for αi,j small. In other words, as should be intuitively expected, it is less costly to change a large parameter than a small one by an absolute quantity, but more costly to change it by a relative quantity. Furthermore, it is infinitely costly, in aggregate, to change a parameter's value all the way to 0.
As N grows, the aggregate parameter-value changes produced by this repeated local adjustment procedure converge, yielding a  that is distinct from the
  that minimizes eq. (4). Notably, as we show in Appendix C, independent of which “path” one takes from
  to
to  , the identical
  results. In other words, each Dirichlet mixture with fixed
  and
and  belongs to a class of related Dirichlet mixtures that differ only in their implied background frequencies. These classes have no “distinguished” members. While
  gives a special status to the original mixture Θ,
  yields Θ no such status, and can be understood to recognize the role of gradual evolutionary change. Code for calculating the parameters of
  , given Θ and
  , is available from the authors upon request.
4.4. Fixed Dirichlet components
To adjust a Dirichlet mixture for a non-standard background composition, it is also possible to keep the Di fixed and change only the mixture parameters, but several potential problems arise. First, unless there are at least as many Dirichlet components M as letters L, it is unlikely any choice of mixture parameters  will yield the background probabilities
  . If M = L, a unique solution to the constraint eq. (2) may be found by matrix inversion, except in degenerate cases. However, it is possible that some of the implied
  are negative. Even if such a solution were a valid Dirichlet mixture, with probability density nowhere negative, it would not conform to an intuitive understanding of the proper role of the mixture parameters
  . If M > L, one may derive a cost function for changes in
  , and optimize this function subject to the linear constraints. Again, it is possible that no solution with all
  positive exists. In general, while one may always adjust a Dirichlet mixture for a non-standard composition by fixing
  , as described above, there is no guarantee this can be achieved by fixing the Di. We have therefore confined our attention to fixed
  .
.
5. Discussion
Although this article is motivated by the application of Dirichlet mixture priors to protein sequence comparison (Brown et al., 1993; Sjölander et al., 1996; Altschul et al., 2010), for illustrative purposes only it is convenient to consider a three-letter alphabet, whose multinomial space is the interior of an equilateral triangle. In Table 1, we list the parameters of a toy, three-component Dirichlet mixture Θ over such an alphabet. We represent the probability density of Θ in Figure 1 by small blue dots, its center of mass  by a large blue dot, and the center of mass of each of its Dirichlet components by a black dot. Specifying a set of desired background frequencies
 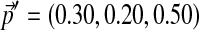 , represented by a large red dot in Figure 1, we used the local adjustment method described above to construct Θ′, whose parameters we give in Table 1. We represent the probability density of Θ′ in Figure 1 by small red dots, and show with arrows the change in the center of mass from Θ to Θ′, as well as that for each of their three components. Several qualitative facts are apparent. First, it is difficult to move a Dirichlet component that is near a boundary of multinomial space closer to that boundary. Second, it is easier to move a diffuse Dirichlet component (i.e. one with relatively low
  ) than a concentrated component (i.e. one with relatively high
  ). Third, the centers of mass of different Dirichlet components may move in different directions.
Table 1.
Parameters for a Baseline Dirichlet Mixture and Its Corresponding Locally Adjusted Mixture
|
Baseline Mixture Θ | |||||
|---|---|---|---|---|---|
| Component i | mi | Dirichlet parameters αi,j |  |
||
| 1 | 0.30 | 350 | 50 | 100 | 500 |
| 2 | 0.30 | 50 | 300 | 150 | 500 |
| 3 | 0.40 | 10 | 30 | 60 | 100 |
| pj: | 0.28 | 0.33 | 0.39 | ||
|
Adjusted Mixture Θ′ | |||||
|---|---|---|---|---|---|
| Component i |  |
Dirichlet parameters
|
 |
||
| 1 | 0.30 | 360 | 36 | 104 | 500 |
| 2 | 0.30 | 61 | 248 | 191 | 500 |
| 3 | 0.40 | 12 | 7 | 81 | 100 |
 |
0.30 | 0.20 | 0.50 | ||
The Dirichlet parameters for Θ′ are shown rounded to the nearest integer. For realistic applications, the values of α* are typically much smaller. We use large values here only for illustrative purposes, so that the densities of distinct Dirichlet components are visually well separated in Figure 1.
FIG. 1.

The local compositional adjustment of a 3-component Dirichlet mixture over a 3-letter alphabet. The small blue dots represent the probability density of the baseline Dirichlet mixture Θ whose parameters are given in Table 1. The large blue dot represents the background frequencies  implied by Θ, i.e. its center of mass. The large red dot represents the desired background frequencies
  , and the small red dots the probability density of the corresponding Dirichlet mixture Θ′ that results from our local adjustment procedure, and whose parameters are given in Table 1. Arrows represent the changes in the centers of mass of the Dirichlet mixture and its constitutent components.
To study the behavior of our compositional adjustment method on a realistic problem, we consider the 20-component Dirichlet mixture for protein sequence comparison called “recode4” that was developed at UCSC (available through UCSC at http://compbio.soe.ucsc.edu/dirichlets/index.html). We refer below to this distribution simply as Θ, and its implied background frequencies as  . We construct a set of biased background frequencies
  (Table 2) from a set of 53 Api-AP2 proteins from Toxoplasma gondii (Altschul et al., 2010), which has a CG-rich genome. To approximate to great accuracy the parameters of the adjusted Θ′ corresponding the
  , we initially use an inordinately high number, 10,000, of local adjustment steps.
Table 2.
Parameter Changes Implied by the Adjustment of a Dirichlet Mixture
| Amino acid | pj |  |
Rj | log2 Rj | mini ri,j | maxi ri,j |
|---|---|---|---|---|---|---|
| A | 8.91 | 11.78 | 1.32 | 0.40 | 0.59 | 3.85 |
| C | 1.47 | 1.87 | 1.27 | 0.34 | 1.00 | 1.74 |
| D | 5.57 | 4.85 | 0.87 | −0.20 | 0.56 | 1.33 |
| E | 5.64 | 7.34 | 1.30 | 0.38 | 0.96 | 2.07 |
| F | 4.25 | 2.65 | 0.62 | −0.69 | 0.41 | 1.87 |
| G | 7.45 | 10.07 | 1.35 | 0.44 | 1.00 | 2.59 |
| H | 2.28 | 2.05 | 0.90 | −0.15 | 0.67 | 2.39 |
| I | 6.22 | 1.33 | 0.21 | −2.23 | 0.08 | 0.71 |
| K | 5.41 | 3.17 | 0.59 | −0.77 | 0.44 | 1.41 |
| L | 9.21 | 7.67 | 0.83 | −0.26 | 0.53 | 3.89 |
| M | 2.33 | 1.12 | 0.48 | −1.05 | 0.33 | 0.95 |
| N | 4.27 | 2.20 | 0.51 | −0.96 | 0.36 | 1.12 |
| P | 3.87 | 7.45 | 1.92 | 0.94 | 1.01 | 3.01 |
| Q | 3.77 | 3.98 | 1.06 | 0.08 | 0.93 | 1.90 |
| R | 4.54 | 7.88 | 1.73 | 0.79 | 1.00 | 4.02 |
| S | 5.96 | 12.37 | 2.07 | 1.05 | 1.02 | 4.88 |
| T | 5.62 | 5.16 | 0.92 | −0.12 | 0.64 | 2.39 |
| V | 7.84 | 5.18 | 0.66 | −0.60 | 0.37 | 2.15 |
| W | 1.56 | 0.84 | 0.54 | −0.89 | 0.39 | 0.98 |
| Y | 3.84 | 1.04 | 0.27 | −1.88 | 0.09 | 0.84 |
The 20-component Dirichlet mixture “recode4” implies the background frequencies  . When adjusted for background frequencies
  , the frequency of amino acid j changes by a factor Rj, and its corresponding Dirichlet parameter within the ith Dirichlet component changes by a factor ri,j. Even when Rj > 1, some of the ri,j may be less than 1.
For a particular amino acid j, the ratio  describes the factor by which its background frequency is required to change, while the ratio
  describes the factor by which its expected frequency is adjusted within Dirichlet component i. In Table 2 we show, for each amino acid, the ratio Rj, as well as the minimum and maximum of the ratios ri,j over all 20 Dirichlet components Di. Note that when Rj > 1, which specifies an increase in the background frequency for amino acid j, although the expected frequency of j tends to increase in most Dirichlet components, it may actually decrease in some, as seen by the fact that mini(ri,j) may be less than 1. This is due to competing “pulls” by various amino acids on the centers of mass of the various Dirichlet components.
To study how many steps  should be divided into to achieve reasonable accuracy in calculating Θ′, we define
  to be the distribution yielded by our local algorithm with N equal-sized steps, and assume that
  is a reasonably good approximation to Θ′. We plot in Figure 2, for N ≤ 1,000, the maximum relative error in estimating the parameters of Θ′ by those of
  . In this example, N = 146 is sufficient to estimate all
  to a precision of better than 1%, which should be more than sufficient for most purposes. Averaged over three runs on an Intel Xeon 2.4 GHz E7440 CPU, this requires 0.041 seconds.
FIG. 2.

The maximum relative error in estimating the the parameters of an adjusted Dirichlet mixture, as a function of the number of adjustment steps. The baseline Dirichlet mixture Θ is the 20-component “recode4” over the amino acid alphabet, developed at UCSC, whose implied background frequencies  are shown in Table 2. Given the desired background frequencies
  specified in Table 2, we calculated the parameters of the corresponding adjusted Θ′ to great precision using our local adjusment procedure with 10,000 steps. The graph shows the maximum relative error in estimating the parameters of Θ′ using N local adjustment steps. As shown by the dotted lines, N = 146 is sufficient to obtain a maximum relative error of 1%.
We expect that the more extreme the change in background frequencies required, the larger N must be to achieve a given degree of precision. To test this hypothesis, we first generated 1,000 sets of background frequencies  centered on
  , by randomly sampling multinomial space using a Dirichlet distribution with parameter vector
  . For each set, we calculated the parameters of the adjusted Θ′ to great precision by using our local adjustment algorithm with 10,000 steps. Finally, we calculated the minimum number of steps N required to estimate all the parameters of Θ′ to within 1%, and plotted N against A, the mean absolute value of log2 Rj (Fig. 3). As can be seen, N indeed tends to grow with A, with N = 600 steps usually sufficient for A ≤ 0.7, and N = 1,200 steps usually sufficient for A ≤ 1. The execution time required grows approximately linearly with N, so compositional adjustments to a 20-component Dirchlet mixture, with these values for N, can be accomplished in approximately 0.17 and 0.34 seconds respectively.
FIG. 3.

The number of adjustment steps as a function of changes in background frequencies. We take the baseline Θ to be “recode4”, as described in Figure 2. We generated 1,000 sets of “desired” background frequencies  centered on
  by sampling from a single Dirichlet distribution with parameters αj = 75pj. For each
  , we estimated the parameters of its corresponding Θ′ using 10,000 local adjustment steps, and then calculated the minimum number of steps N required to estimate all the parameters of Θ′ to within 1%. We sorted the
  into bins according to the quantity
 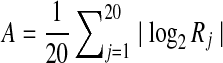 , the mean absolute value of the log factor by which the pj must change. For each bin, dots represent the observed mean value of N, with error bars showing one standard deviation for this estimate. Triangles represent the 90th percentile for values of N within each bin. The particular case studied in Table 2 and Figure 2 is shown by an “x.”
It is possible to construct artificial examples, with A large, for which a very large number of steps is required to achieve good precision in estimating the parameters of Θ′. However, for natural classes of real proteins, it is unusual for A to exceed 1. The representative example given in Table 2 and Figure 2, with A = 0.712 and N = 146, is shown by an “x” in Figure 3. The number of steps it requires to achieve good precision ranks in the 25th percentile of the random examples with A near 0.7.
We have assumed throughout that all the specified frequencies  are non-zero. However, if
  is derived from the observed frequencies in a small collection of proteins, where certain amino acids may be completely absent, it is important to add pseudocounts. This insures that the frequencies
  are all positive, and that A is never very large.
6. Conclusion
Dirichlet mixture priors are an important formalism for multiple protein sequence alignment. A given mixture Θ implies a specific set of amino acid background frequencies  , and should be non-optimal for the analysis of proteins with non-standard background frequencies
  . It is impractical to construct a new Dirichlet mixture from scratch for each new composition, so we have sought a method for adjusting Θ to be consistent with any specified
  . First, by allowing only the centers of mass of the Dirchlet components that constitute Θ to vary, we linearize the problem's constraints. Second, assuming a relative-entropy-based distance function, we derive a local, quadratic cost function for changes to a Dirichlet distribution's center of mass. This permits us to calculate optimal changes to the parameters of Θ for small changes to
  , and we may integrate these changes to derive a unique
  corresponding to
  . For practical problems, several hundred adjustment steps are sufficient for calculating the parameters of
  to good precision, allowing the compositional adjustment of a Dirichlet mixture to be accomplished in well under a second.
7. Appendix
A. Correspondences between Dirichlet mixture priors and pairwise substitution matrices
First, we show that the pairwise target frequencies implied by a Dirichlet mixure must be positive definite. Given a Dirichlet mixture prior, the probability of observing the letter j twice at a given position is
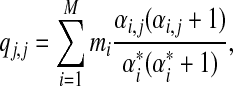 |
(7) |
while the probability of observing the letter j followed by a different letter k is
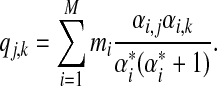 |
(8) |
Obviously, the matrix Q = [qj,k] is symmetric. To show that Q is also positive definite, one can use the matrix-vector form of Q. Simply define 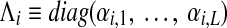 and
and 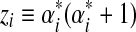 . Then Q can be expressed as
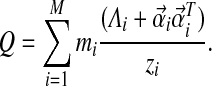 |
(9) |
This implies Q is positive definite, because  is positive definite for each i.
Second we show that the L/2-component Dirichlet mixture corresponding to a particular set of of target frequencies need not be unique, as can be established by a simple example. Let  denote a Dirichlet distribution with the parameters
  . The 4 × 4 target frequency matrix Q implied by a special 2-component Dirichlet mixture
  is also generated by distinct 2-component Dirichlet mixtures. Let Λx = diag(1, x, 1, x),
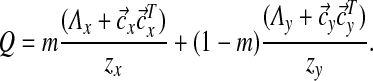
 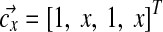 , zx = (2x + 2)(2x + 3), Λy = diag(1, y, 1, y),
 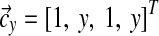 , and zy = (2y + 2)(2y + 3). Then Q can be expressed as
 |
We found, through some tedious algebra, that Q is also implied by a family of 2-component Dirichlet mixtures. The family is
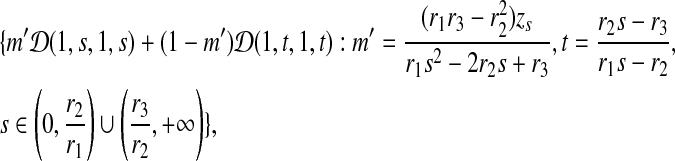 |
where
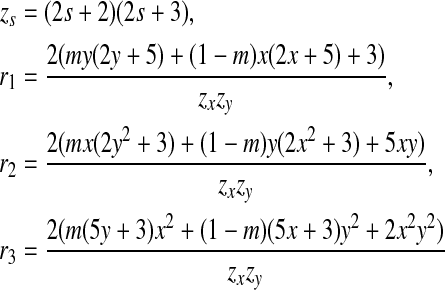 |
For example, letting m = 0.25, x = 2 and y = 4 gives us a Dirichlet mixture  . We can calculate r1 = 0.012771, r2 = 0.039177, and r3 = 0.132900. Hence the legal range for free variable s is
 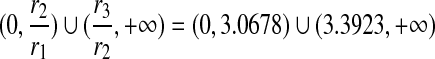 . If we let s = 2.5, then we have a Dirichlet mixture
  ; if we let s = 10, then we have another Dirichlet mixture
  . Both Θ2 and Θ3 imply the same matrix of target frequencies as implied by Θ1.
B. Closed form, convexity, and local form of the approximate cost function F
Based on the approximation (4) described in the main text, the divergence G(Θ′; Θ) between two Dirichlet mixtures Θ and Θ′ is approximated by
 |
That is, we need to focus on only one mixture component at a time. Therefore we drop the component index, and the indices below label only the amino acids.
For a given Dirichlet component, we rewrite eq. (1) to express the probability density distribution (given the Dirichlet parameters) explicitly as
 |
(10) |
If one were to shift the implied background frequencies from  by
by  (requiring of course that
 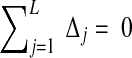 ), the distribution becomes
  . We are interested in computing the Kullback-Leibler distance from
 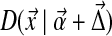 to
to  :
:
 |
(11) |
Using eq. (10), we find that [with 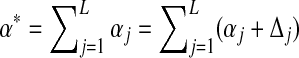 ]
]
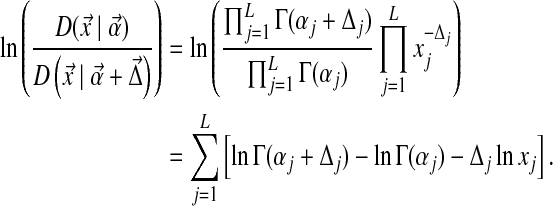 |
(12) |
Consequently,
 |
(13) |
where the last equality comes from the fact that  , and ψ(x) ≡ (d/dx) ln Γ(x) is the digamma function. Note that the digamma function can be expressed as
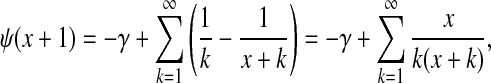 |
(14) |
where γ is Euler's constant. Restoring the component index, one may now write the approximate cost function F in closed form as
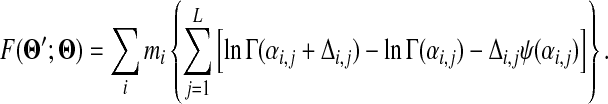 |
(15) |
We now establish that F is convex when viewed as a function of the multiple variables {Δi,j}, and that given the constraints of eq. (2), F must have a unique minimum. We first observe from eq. (15) that F's dependences on {Δi,j} are decoupled from each other. Therefore, it is sufficient to prove that
 |
is a convex function of Δ. Using eq. (14), the second derivative of f is
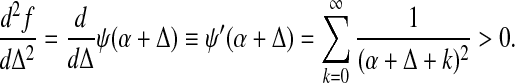 |
(16) |
This proves the convexity of F. Since the constraints are linear in Δi,j, upon the introduction of Lagrange multipliers into the minimization procedure, the introduced linear terms in Δi,j do not change the convexity of F. That is, the minimum of F, if it exists, must be unique. Since Γ(α + Δ) →∞ for Δ → (−α)+ and for Δ →∞, while f = 0 for Δ = 0, F must have a minimum.
To derive a local form of cost function F, we consider expanding the cost function to quadratic order in Δi,j. It is obvious that the second and third terms inside the square brackets in (15) are exactly the zeroth and first order terms of the preceding function, when expanded around αi,j. For small ∣Δi,j∣, the expression in (15) is thus led by
 |
(17) |
Using eq. (16), it is apparent that Ri,j, defined in the main text, is given by
 |
C. The Lagrange-Newton method and the path independence of the local form of F
To obtain the Dirichlet parameter changes associated with an infinitesimal change in the background amino acid frequencies, one only needs to minimize the local form of F, eq. (17), subjected to the necessary constraints. Let us consider changing the background frequencies  by adding
  . We will consider the
  to be infinitesimal quantities. Assume that the Dirichlet parameters change correspondingly from αi,j to αi,j + Δi,j. It is apparent that Δi,j must satisfy the following constraints:
 |
(18) |
 |
(19) |
To seek the set  that satisfies these constraints and minimizes F, we minimize the local form of F, eq. (17), by introducing a Lagrange multiplier for each of the constraints. Specifically, minimizing
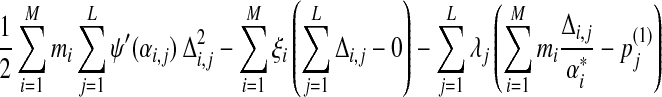 |
(20) |
yields
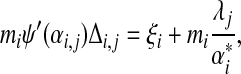 |
or
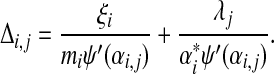 |
(21) |
Substituting (21) into eq. (18), we find
 |
(22) |
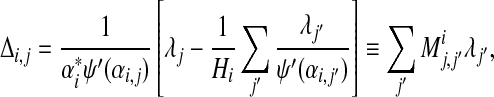 |
(23) |
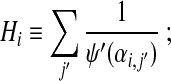
where
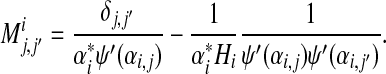 |
(24) |
Substituting (23) into eq. (19), we obtain
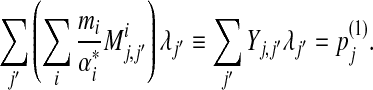 |
(25) |
Therefore, in matrix notation, we can write the final solution as
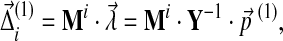 |
(26) |
where
 |
Eq. (26) gives the changes in Dirichlet parameters corresponding to a small change in the target frequencies, demonstrating that  is of the same order as
  . It is evident that the matrix elements of M and Y depend on the set {αi′,j′}.
If one performs another infinitesimal background frequency change  , the cumulative Dirichlet parameter changes become
 |
(27) |
On the other hand, if one changes the background frequencies first by  and then by
  , the cumulative changes become
 |
(28) |
To compare eqs. (27) and (28), we expand the quantities around αi,j. Since the matrix Y is a linear combination of Mi, the expansion reduces to the differentiation of Mi with respect to αi,j. Using eq. (24), we obtain after some calculation
 |
(29) |
We further note that
 |
Therefore, to obtain the second order in background frequency changes in eq. (27), we may write
 |
(30) |
The symmetry between Δ(1) and Δ(2) shown above indicates that reversing the order of operations yields the same result. That is, it does not matter whether one changes the background frequencies by  followed by
  or vice versa. A continuation of this result implies that once the new background frequencies
  are chosen, the compositionally adjusted Dirichlet parameters do not depend on which path one takes to reach
  , as long as local optimization is applied every step of the way.
It is worth remarking that having ψ′(αi,j) as the elastic constant associated with the displacement Δi,j is not critical for the proof of path independence. As long as the elastic constant for Δi,j is a positive, continuous, and differentiable function of αi,j, the proof of path independence holds.
Acknowledgments
This work was supported by the Intramural Research Program of the National Library of Medicine at National Institutes of Health.
Disclosure Statement
No competing financial interests exist.
References
- Altschul S.F. Amino acid substitution matrices from an information theoretic perspective. J. Mol. Biol. 1991;219:555–565. doi: 10.1016/0022-2836(91)90193-A. [DOI] [PMC free article] [PubMed] [Google Scholar]
- Altschul S.F. Wootton J.C. Gertz E.M., et al. Protein database searches using compositionally adjusted substitution matrices. FEBS J. 2005;272:5101–5109. doi: 10.1111/j.1742-4658.2005.04945.x. [DOI] [PMC free article] [PubMed] [Google Scholar]
- Altschul S.F. Wootton J.C. Zaslavsky E., et al. The construction and use of log-odds substitution scores for multiple sequence alignment. PLoS Comput. Biol. 2010;6:e1000852. doi: 10.1371/journal.pcbi.1000852. [DOI] [PMC free article] [PubMed] [Google Scholar]
- Bacon D.J. Anderson W.F. Multiple sequence alignment. J. Mol. Biol. 1986;191:153–161. doi: 10.1016/0022-2836(86)90252-4. [DOI] [PubMed] [Google Scholar]
- Brown M. Hughey R. Krogh A., et al. Using Dirichlet mixture priors to derive hidden Markov models for protein families. Proc. First Int. Conf. Intell. Syst. Mol. Biol. 1993:47–55. [PubMed] [Google Scholar]
- Dayhoff M.O. Schwartz R.M. Orcutt B.C. A model of evolutionary change in proteins. 345–352. In: Dayhoff M.O., editor. Atlas of Protein Sequence and Structure. Suppl. 3. Vol. 5. National Biomedical Research Foundation; Washington, DC: 1978. [Google Scholar]
- Grünwald P.D. The Minimum Description Length Principle. MIT Press; Cambridge, MA: 2007. [Google Scholar]
- Henikoff S. Henikoff J.G. Amino acid substitution matrices from protein blocks. Proc. Natl. Acad. Sci. USA. 1992;89:10915–10919. doi: 10.1073/pnas.89.22.10915. [DOI] [PMC free article] [PubMed] [Google Scholar]
- Karlin S. Altschul S.F. Methods for assessing the statistical significance of molecular sequence features by using general scoring schemes. Proc. Natl. Acad. Sci. USA. 1990;87:2264–2268. doi: 10.1073/pnas.87.6.2264. [DOI] [PMC free article] [PubMed] [Google Scholar]
- MacKay D.J.C. Information Theory, Inference, and Learning Algorithms. Cambridge University Press; New York: 2003. [Google Scholar]
- Müller T. Rahmann S. Rehmsmeier M. Non-symmetric score matrices and the detection of homologous transmembrane proteins. Bioinformatics. 2001;17(Suppl. 1):S182–S189. doi: 10.1093/bioinformatics/17.suppl_1.s182. [DOI] [PubMed] [Google Scholar]
- Murata M. Richardson J.S. Sussman J.L. Simultaneous comparison of three protein sequences. Proc. Natl. Acad. Sci. USA. 1985;82:3073–3077. doi: 10.1073/pnas.82.10.3073. [DOI] [PMC free article] [PubMed] [Google Scholar]
- Ng P.C. Henikoff J.G. Henikoff S. PHAT: a transmembrane-specific substitution matrix. Predicted hydrophobic and transmembrane. Bioinformatics. 2000;16:760–766. doi: 10.1093/bioinformatics/16.9.760. [DOI] [PubMed] [Google Scholar]
- Schneider B.E. Trigamma function. J. Royal Stat. Soc. Series C. 1978;27:97–99. [Google Scholar]
- Schwartz R.M. Dayhoff M.O. Matrices for detecting distant relationships, 353–358. In: Dayhoff M.O., editor. Atlas of Protein Sequence and Structure. Suppl. 3. Vol. 5. National Biomedical Research Foundation; Washington, DC: 1978. [Google Scholar]
- Sjölander K. Karplus K. Brown M., et al. Dirichlet mixtures: a method for improved detection of weak but significant protein sequence homology. Comput. Appl. Biosci. 1996;12:327–345. doi: 10.1093/bioinformatics/12.4.327. [DOI] [PubMed] [Google Scholar]
- Sueoka N. Directional mutation pressure and neutral molecular evolution. Proc. Natl. Acad. Sci. U.S.A. 1988;85:2653–2657. doi: 10.1073/pnas.85.8.2653. [DOI] [PMC free article] [PubMed] [Google Scholar]
- Thompson J.D. Higgins D.G. Gibson T.J. CLUSTAL W: improving the sensitivity of progressive multiple sequence alignment through sequence weighting, position-specific gap penalties and weight matrix choice. Nucleic Acids Res. 1994;22:4673–4680. doi: 10.1093/nar/22.22.4673. [DOI] [PMC free article] [PubMed] [Google Scholar]
- Wan H. Wootton J.C. A global compositional complexity measure for biological sequences: AT-rich and GC-rich genomes encode less complex proteins. Comput. Chem. 2000;24:71–94. doi: 10.1016/s0097-8485(99)00048-0. [DOI] [PubMed] [Google Scholar]
- Yu Y.-K. Altschul S.F. The construction of amino acid substitution matrices for the comparison of proteins with non-standard compositions. Bioinformatics. 2005;21:902–911. doi: 10.1093/bioinformatics/bti070. [DOI] [PubMed] [Google Scholar]
- Yu Y.-K. Wootton J.C. Altschul S.F. The compositional adjustment of amino acid substitution matrices. Proc. Natl. Acad. Sci. USA. 2003;100:15688–15693. doi: 10.1073/pnas.2533904100. [DOI] [PMC free article] [PubMed] [Google Scholar]