

Abstract
Models of visual selective attention have suggested that the representation of specific features characterizing a target object is enhanced in the visual cortex, at the cost of competing task-irrelevant information. In psychophysical studies, however, such attentional enhancement has been shown to result in reduced perceptual sensitivity when maintained over periods of several seconds. Two experiments examined the relationship between target detection behavior and electrocortical facilitation in human visual cortex during sustained attention under competition, in near real time. Steady-state visual evoked potentials (ssVEPs) were used in a change detection paradigm, in which a stream of flickering grating stimuli containing target events was fully overlapping with distractor faces (experiment 1) or competing complex scenes (experiment 2), covering the same part of the visual field. Beamformer source localization was used to test plausibility of lower-tier visual cortex involvement in modulation of the ssVEP signal. Results of both experiments suggest that early overallocation of visual cortical resources to the attended stimulus stream is associated with rapid reduction of electrocortical facilitation and poor change detection across the entire trial. By contrast, temporally balanced dynamics in visual cortex predicted accurate change detection. Together, the present results support models of sustained selective attention that emphasize competition for resources in lower-tier visual cortex. These models can be extended by a temporal dimension, on which attentive behavior is characterized by frugal resource sharing across the viewing time.
Introduction
Accurate visual perception of target events, despite distraction, and immediate contingent action are hallmarks of adaptive human behavior. Particularly when observers view overlapping or complex arrays, the visual cortex has been suggested to enhance the representation of specific features or the location of the target object, at the expense of competing task-irrelevant information (Desimone and Duncan, 1995). Functional neuroimaging (Kastner and Ungerleider, 2000) and animal studies (Reynolds et al., 1999) have provided empirical support for such a notion and have described a network of structures that send bias signals to visual cortex (e.g., frontal and parietal cortex in the case of spatial attention) (Szczepanski et al., 2010). Likewise, electrophysiological studies in humans have reliably found evidence for sustained enhancement of neural mass activity when attending to a specific location or object feature over several seconds (Müller et al., 2006). By contrast, psychophysics studies examining effects of attention on contrast sensitivity over time suggested initial benefits, but severe costs after 2–4 s of attentive compared with nonattentive perception (Ling and Carrasco, 2006).
This raises the question of whether a pattern of initial enhancement and subsequent reduction of perceptual sensitivity underlies poor performance in sustained attention, and whether such a pattern is reflected in large-scale visual cortical activity. Cognitive neuroscience work has begun to address these questions in the context of dual task processing, often adopting viewpoints suggesting resource sharing (Shapiro et al., 2006), overinvestment of resources (Olivers et al., 2007) into the stimulus stream, or limited access to central capacities (Jolicoeur, 1999). The experimental tasks used in this context typically draw on higher-order cognitive processes, involving a variety of cortical structures over longer time intervals. In the present study, we examined neural mass activity in lower-tier visual cortex during sustained attention, focusing on the electrocortical response evoked by continuously flickering Gabor gratings.
In two experiments, we used dense-array EEG together with steady-state visual evoked potential (ssVEP) methodology to obtain a near-real-time measure of neural mass responses to a flickering Gabor patch that underwent occasional phase reversals, while competing for resources with overlapping faces (experiment 1) or complex naturalistic pictures (experiment 2). The ssVEP is an oscillatory response of visual cortex to flickering stimuli and is substantially increased with attention (Regan, 1989; Müller et al., 1998b). This measure is characterized by high signal-to-noise ratio and allows tagging different objects in visual cortex by flickering them at different rates. Thus, signals from spatially overlapping stimuli can be easily separated in the frequency domain. Time-frequency analyses can be applied to describe the time course of visual resource allocation to a specific stimulus during competition (Wang et al., 2007). Based on the literature reviewed above, we expected that accurate perception of target events is associated with balanced dynamics over time, but that a marked initial increase followed by a drop in visual cortex activity predicts errors during target detection.
Materials and Methods
Experiment 1: competition between attended Gabor patches and distractor faces
Participants.
Participants were 19 undergraduate students (6 male; mean age, 18.6 years; SD, 1.1 years) from the University of Florida, without any family history of photic epilepsy. Participants received course credits for their participation and gave written informed consent. All procedures were approved by the institutional review board of the University of Florida.
Design and procedure.
Seventy-two pictures were selected from the Karolinska Directed Emotional Faces database (Lundqvist et al., 1998), showing faces with angry, happy, and neutral expressions in 12 female and 12 male actors. All stimuli were converted to grayscale images and displayed against a gray background on a 19 inch computer monitor with a vertical refresh rate of 60 Hz. On each experimental trial, a face picture was presented in the middle of the screen for 3000 ms. Faces were shown in a flickering mode either at a frequency of 15 or 20 Hz to evoke ssVEPs. Over this flickering face stimulus, a transparent Gabor patch was superimposed, flickering at either 20 or 15 Hz, respectively (Fig. 1).
Figure 1.

Schematic layout of the compound stimulus in experiment 1. In each trial, a face flickering at either 15 or 20 Hz was overlaid with a Gabor patch, flickering at the other frequency (20 and 15 Hz, respectively). Occasionally, the Gabor patch was exchanged by its antiphasic counterpart. Overall, the trials included zero-, one-, or two-phase changes in the Gabor patch stream.
The driving frequencies of the face stimulus and the Gabor patch were always different to ensure distinct frequency tagging of each stimulus stream. The flickering stream of the Gabor patch consisted of either the same patch throughout the trial (zero change) or was replaced within the stream either once by its antiphasic image (one change) or twice (two changes) at pseudo-random times (first change between 666 and 1333 ms, second change between 1666 and 2333 ms) within the flickering stream. The compound stimulus stream subtended a horizontal visual angle of 4.9° and a vertical visual angle of 6.3°. The distance between the screen and the participants' eyes was 1.0 m.
Participants were asked to pay attention to the superimposed Gabor patch only and to report after each trial, by pressing a key, how many changes they had observed (change detection task). To counterbalance the tagging frequencies, one block of stimuli (72 trials) was presented with the faces flickering at 15 Hz and the Gabor patches flickering at 20 Hz, whereas in the second block the tagging frequencies were interchanged. The order of blocks was counterbalanced across participants. Before the actual experimental run, participants were given 16 practice trials. During the practice trials, participants received feedback about their performance (“correct,” “error,” or “missed”) immediately after each response. If it was ensured that the participant had understood the task and performed above chance, the experiment was started. Otherwise, the practice trials were repeated.
EEG recording and data analysis.
The EEG was continuously recorded from 256 electrodes using an Electrical Geodesics system, referenced to Cz, digitized at a rate of 250 Hz, and on-line bandpass filtered between 0.1 and 50 Hz. Electrode impedances were kept at <50 kΩ, as recommended for the Electrical Geodesics high-impedance amplifiers. Off-line, a low-pass filter of 40 Hz was applied, and epochs of 600 ms before stimulus onset and 3600 ms after stimulus onset were extracted. Artifact rejection was also performed off-line, following the procedure proposed by Junghöfer et al. (2000). Using this approach, trials with artifacts were identified based on the distribution of statistical parameters of the EEG epochs extracted (absolute value, SD, maximum of the differences) across time points, for each channel, and—in a subsequent step—across channels. Sensors contaminated with artifacts were replaced by statistically weighted, spherical spline interpolated values. The maximum number of approximated channels in a given trial was set to 20. These criteria also led to exclusion of trials contaminated by vertical and horizontal eye movements. For interpolation and all subsequent analyses, data were arithmetically transformed to the average reference. Artifact-free epochs were averaged separately based on task performance (correct vs incorrect response) for the six combinations of facial expressions and tagging frequency to obtain ssVEPs containing both driving frequencies.
Time-varying amplitudes of ssVEP epochs for each condition were obtained by means of convoluting the EEG time series with complex Morlet wavelets. The two driving frequencies (15 and 20 Hz) were used as center frequencies, with a mean ratio of 14 of the analysis frequency f0 and the width of the wavelet in the frequency domain σf. As a consequence, the width of the wavelets in the frequency domain changes as a function of f0, resulting in an SD of 1.07 Hz in the frequency domain and an SD of 148 ms in the time domain for the wavelet centered at 15 Hz, and SDs of 1.43 Hz in the frequency domain and 111 ms in the time domain for the wavelet at 20 Hz, respectively. Thus, for each trial the time frequency responses were calculated for both frequencies, representing either the cortical response to the Gabor patch or the face stimulus. Fully crossing face conditions with stimulation frequencies, all permutations of faces and Gabor patches, were extracted from the compound ssVEP signal. Thus, a time-varying measure of the amount of processing resources devoted to one stimulus in the presence of another stimulus (competitor) was obtained.
Because the main objective of this study was to describe the cortical signature on trials where participants detected the changes, compared with trials in which they failed to do so, the ssVEP amplitudes were averaged separately for correct and incorrect trials, and for the three facial expressions. Facial expressions were kept separate, because it was possible that neutral faces would be weaker competitors than emotional expressions. This manipulation thus allowed us to test for any distractor–target interactions over time. Given the unequal distribution of correct and incorrect trials (3:1), error trials were not separated for different categories (miss 1 target, miss 2 targets, false alarms of 1 target, false alarms of 2 targets), and a matching procedure was applied to obtain overall equal-sized samples. To this end, of the correct trials there were as many trials randomly chosen to match the number of incorrect trials across conditions. To examine the time course of attentional engagement, ssVEP amplitudes were averaged across time points in the following three time windows: between 100 and 700 ms, 800–1400 ms, and 1700–2300 ms after picture onset. As was seen in previous work (Müller et al., 2008) amplitudes of the ssVEPs were most pronounced at electrode locations near the medial occipital electrode Oz, over the occipital pole. We therefore averaged all signals spatially, across a medial-occipital cluster comprising site Oz and its seven nearest neighbors (Electrical Geodesics sensors: 125, 126, 127, 137, 138, 139, 149, 150).
Statistical analysis.
Mean SSVEP amplitudes were analyzed by repeated-measures ANOVAs containing the within-subject factors tagged stimulus (face vs Gabor patch), facial expression (angry vs neutral vs happy), time (100–700, 800–1400, and 1700–2300 ms), and response (correct vs incorrect). Significant effects were followed up by planned ANOVAs and simple planned contrast analyses. Specifically, interactions involving the time and response factors were followed up (1) by means of planned contrast analyses for each response type across the three time windows, to examine differences between time windows, and (2) by means of t tests comparing correct and incorrect trials for each time window, to examine effects of response accuracy on ssVEP amplitude during each time segment. These post hoc tests allowed us to quantify the predictions made regarding the overall time dynamics in trials differing in behavioral accuracy as well as regarding specific differences at particular points in time (e.g., early neural overengagement in the task stream). A significance level of 0.05 (two-tailed) was used for all analyses. The Greenhouse–Geisser correction for violation of sphericity was used if necessary. Throughout this article, the uncorrected degrees of freedom, the corrected p values, the Greenhouse–Geisser ε, and the partial η2 (ηp2) are reported (Picton et al., 2000). Response data were averaged for hits (indicating the correct number of 1 or 2 changes), misses, correct rejections (indicating 0 changes when 0 changes were shown), and false alarms (indicating changes when no changes were shown).
Beamformer source localization.
In an effort to examine source configurations underlying the scalp-recorded ssVEP, we applied a frequency-domain beamformer [dynamic imaging of coherent sources (DICS)] filter as suggested by Gross et al. (2001). To this end, the time domain-averaged ssVEP of each individual participant was transformed into the frequency domain using Welch's periodogram method. Separate frequency spectra were obtained for the baseline period and the middle second of the viewing period, in which the ssVEP signal was stable and of maximum amplitude. The baseline period was padded with zeros to 1000 ms, for parallel frequency resolution of baseline and signal spectra. Beamformer analysis estimates the contribution of a given voxel in the brain to activity recorded on the scalp within a specified time-frequency window by minimizing contributions from all other voxels in source space, thereby implementing a spatial filter to identify neural generators of measured scalp activity. The DICS beamformer was applied to the 15 and 20 Hz oscillatory activity occurring during the 1000 ms of the viewing period relative to the 1000 ms baseline period. Beamformer source reconstructions were obtained separately for each participant in the time interval of interest, using in-house software and the FieldTrip open source toolbox (http://www.ru.nl/fcdonders/fieldtrip). A volume conduction model was derived from an average brain, segmented into gray matter, white matter, and CSF, extracting conduction compartments of skin, skull, and brain. The leadfield matrix was calculated using the boundary element method, assuming sources were constrained to the gray matter. Sources of electrocortical oscillatory activity at the stimulation frequencies were then expressed as multiples of the baseline and displayed on a three-dimensional standard brain.
Experiment 2: competition between attended Gabor patches and complex naturalistic pictures
To identify potential effects of distractor type, experiment 1 was repeated in a new sample, using 72 affectively neutral pictures from the International Affective Pictures System (IAPS) (Lang et al., 2005) as the distractors. Pictures depicted natural scenes involving humans in activities of daily life, but no portraits of faces (IAPS numbers are available from authors upon request). They were shown in grayscale and were not flickered, to maximize their perceptibility and minimize ssVEP variability due to uneven distribution of brightness and contrast across the picture. Participants were 16 undergraduate students (5 male; mean age, 19.4 years; SD, 1.4 years). All other procedures and analyses were as described for experiment 1, with the exception that no factor of emotional expression/content was included. Instead, we tested whether certain error types differed in terms of temporal dynamics in experiment 2, with more trials per cell available in this experiment. Again, we expected that a nonflickering salient competitor would draw resources from a primary task (Müller et al., 2008), and that initial overinvestment of visual resources in the task stream would predict poor target detection accuracy later in the trial.
Results
Experiment 1
Change detection performance
Overall, no influence of facial expression on task performance was observed. Thus, accuracy indices were collapsed across this condition for further analysis. In trials with no phase change (i.e., no target), participants falsely reported a change in 20.1% (false alarms; SD, 22.1%), whereas they correctly identified no change in 79.1% (correct rejections; SD, 22.6%) of trials. They missed the change in 25.0% (misses; SD, 23.7%) of one-change trials, and in 29.1% (SD, 23.3%) of two-change trials. Participants correctly detected the change in 63.8% (hits; SD, 27.6%) of one-change and 45.5% (SD, 23.6%) of two-change trials. The sensitivity measure d′ for one target was 1.23, and 0.72 for two targets, suggesting that participants performed well in an overall challenging task. Given this pattern of errors, we collapsed the ssVEP within two broad response categories: all correct trials versus all incorrect trials. Forming subaverages for different error types was not possible, as the number of trials per average would be too small.
ssVEP
The superposition stimulus reliably evoked steady-state responses, as can be seen from the frequency power spectra obtained by fast Fourier transform (FFT). FFT was applied to the EEG data for a time window from 200 to 3000 ms after stimulus onset. Clear peaks of spectral power were observed for the two driving frequencies, most prominently over occipital sensors (Fig. 2).
Figure 2.

Frequency power spectra as derived by FFT for five representative electrodes (10–20 system) in experiment 1, averaged across all 19 subjects. Clear peaks of the driving frequencies 15 and 20 Hz are detected and are most pronounced at the occipital electrode.
No influence of facial expressions on ssVEP amplitudes was observed. Overall, the mean amplitudes of the ssVEPs decreased as a function of time (F(2,36) = 5.63, p = 0.021, ηp2 = 0.24). The ssVEPs in response to Gabor patches compared with faces were differentially modulated by time, as the significant two-way interaction time × tagged stimulus indicates (F(2,36) = 3.45, p = 0.043, ηp2 = 0.16). Furthermore, the ssVEP amplitudes during correct trials changed differently over time compared with incorrect trials, in which participants did not detect the change in the Gabor patch stream (F(2,36) = 4.72, p = 0.015, ηp2 = 0.21). Importantly, the ssVEP amplitudes of faces and Gabor patterns were differentially modulated by time during trials with correct compared with trials with erroneous responses, as the significant three-way interaction, time × response × tagged stimulus, indicates (F(2,36) = 4.73, p = 0.015, ηp2 = 0.21).
Because we were interested in the differential brain dynamics during incorrect and correct trials, separate ANOVAs for the two response types were conducted. In correct trials, no differences in ssVEP amplitudes as a function of tagged stimulus (face vs Gabor patch) or time were found. In incorrect trials, the ssVEPs decreased over time (F(2,36) = 10.77, p < 0.001, ηp2 = 0.37). Moreover, the ssVEP amplitudes in response to Gabor patches were different across the three time intervals, whereas no differences were found for the face stimuli (F(2,36) = 6.89, p = 0.003, ηp2 = 0.26) (Fig. 3). To examine whether initial overinvestment in the task stream specifically distinguished the visual cortical response in the incorrect trials, paired t tests were conducted comparing amplitudes in correct and incorrect trials for each time segment. In the first time window, incorrect trials tended to be associated with greater ssVEP amplitudes than correct trials (t(18) = −1.82, p = 0.085, two-tailed) but failed to reach the 0.05 threshold. No difference was observed during the second time window, but incorrect trials showed lower amplitudes than correct trials in the last time segment (t(18) = 2.84, p = 0.011).
Figure 3.

Mean ssVEP amplitudes (+SEM) elicited by Gabor patches and faces, respectively, in the three analyzed time windows, separated for correct and incorrect responses in the change detection task.
Separate post hoc comparisons for each tagged stimulus showed significant time-dependent differences between correct and incorrect trials for Gabor patches only (F(2,36) = 10.55, p < 0.001, ηp2 = 0.37). In incorrect trials, higher amplitudes were observed for the first interval compared with both of the later ones, time (F(2,36) = 12.49, p = 0.001, ηp2 = 0.41), and simple contrasts 1 versus 2 (F(1,18) = 17.31, p = 0.001, ηp2 = 0.49), and 1 versus 3 (F(1,18) = 16.21, p = 0.001, ηp2 = 0.47). No differences between time intervals were found in correct trials. The topographies for the mean ssVEP amplitudes in the three analyzed time windows are given in Figure 4.
Figure 4.
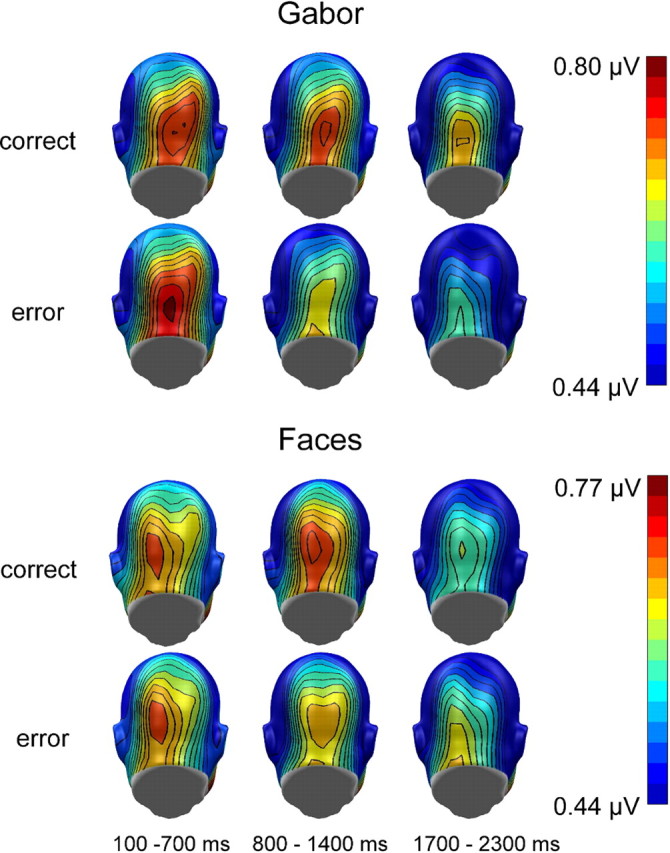
Grand mean topographical distribution of the ssVEP amplitudes in response to faces and Gabor patches as a function of change detection performance, collapsed over the two driving frequencies. Grand means are averaged across three time windows (100–700, 800–1400, and 1700–2300 ms) after stimulus onset. Note that scales used for faces and Gabor patches are different.
Beamformer source analysis
DICS beamformer imaging of the ssVEP responses to faces and Gabor patches revealed strong cortical generators of the 15 and 20 Hz oscillations (collapsed) in lower-tier visual areas (calcarine fissure). The surface projections of these sources are shown in Figure 5.
Figure 5.

Source projections of the ssVEP responses on the right hemisphere of a standard inflated brain template. Change is shown in SDs over prestimulus baseline level. Strong sources were found in areas of primary visual cortex (calcarine fissure) in response to face as well as Gabor patch oscillations. Note that scales used for both faces and Gabor patches are different.
Experiment 2
Change detection performance
Consistent with experiment 1, the phase-shift detection task was taxing, with 16.5% false alarms (SD, 24.0%), 83.5% correct rejections (SD, 29.0%), 21.4% misses in one-change trials (SD, 17.6%), and 29.1% misses in two-change trials (SD, 23.3%). Participants correctly detected the changes in 78.6% of one-change trials (hits; SD, 22.6%) and 70.9% of two-change trials (SD, 21.0%). The corresponding d′ for one-target trials was 1.74; d′ for two-target trials was 1.53, overall slightly better than in experiment 1. t Tests indicated that these differences were not statistically significant.
ssVEP
As observed in experiment 1, ssVEPs decreased over time (F(1,30) = 40.03, p < 0.001, ηp2 = 0.73). The overall analysis of correct and incorrect trials demonstrated differential modulation of ssVEP amplitudes across the three time windows (F(2,30) = 24.77, p < 0.001, ηp2 = 0.62) (Fig. 6, topographies for the mean ssVEP amplitudes in the three analyzed time windows).
Figure 6.

Grand mean topographical distribution of the ssVEP amplitudes in response to Gabor patches as a function of change detection performance, collapsed over the two driving frequencies in experiment 2. Grand means are averaged across three time windows (100–700, 800–1400, and 1700–2300 ms) after stimulus onset.
Follow-up ANOVA on correct trials alone showed no differences in ssVEP amplitudes as a function of time. In incorrect trials, the ssVEPs decreased over time (F(2,30) = 50.52, p < 0.001, ηp2 = 0.77). Separate paired comparisons for the three time windows showed significantly higher ssVEP amplitudes for the first compared with both latter time windows, simple contrasts 1 versus 2 (F(1,15) = 100.40, p < 0.001, ηp2 = 0.87) and 1 versus 3 (F(1,15) = 72.63, p < 0.001, ηp2 = 0.83). The mean ssVEP amplitudes in response to Gabor patches for the three time intervals are illustrated in Figure 7. Again, time-specific differences between the response types were examined using paired t tests comparing amplitudes in correct and incorrect trials for each time segment. In the first time window, incorrect trials were associated with greater ssVEP amplitudes than correct trials (t(15) = −4.99, p < 0.001). This pattern reversed in the second time window, in which correct trials showed higher amplitudes than incorrect trials (t(15) = 3.92, p < 0.01). This same difference was seen in the third window (t(15) = 3.38, p = 0.004).
Figure 7.

Mean ssVEP amplitudes (+SEM) elicited by Gabor patches in experiment 2 in the three analyzed time windows, separated for correct and incorrect responses in the change detection task.
Because the affective content of the distractors was not manipulated in experiment 2, more trials were available. This increase in trial number was used to conduct analyses comparing different error types in terms of the ssVEP time dynamics: ssVEP amplitudes were extracted as described above for the three time segments under consideration and were averaged according to two criteria. In a first step, we compared misses (defined as all errors in which the participant reported fewer targets than actually presented) and false alarms (defined as all errors in which the participant reported more targets than actually presented) using an ANOVA with the factors of error type (misses, false alarms) and time segment (3 time segments). In a second ANOVA with the same design, we compared errors in trials with one target and errors in trials with two targets, again using 2 × 3 ANOVA. Although both ANOVAs showed the main effect of time (F values, 33.9 and 63.4, respectively), the main effects of error type and interactions of error type and time did not reach significance (all F values <2.6). We conclude that the patterns observed here are not specific to a particular type of error.
Discussion
How is correct target detection mirrored in the dynamics of neural population activity in low-level visual areas during competition of multiple overlapping objects? To examine this question, the present study used the time-varying ssVEP amplitude evoked by flickering Gabor patches. The ssVEP reflects the large-scale neural activity in visual cortex, enabling researchers to assess whether engagement of visual areas by a stimulus changes over time (Müller et al., 1998a, 2008). Here, we tested whether successful deployment of sustained attention is associated with a specific temporal pattern of visual engagement. Based on psychophysical work, we expected initial overengagement followed by substantial decrease of neural population activity in visual cortex in incorrect trials, and a more balanced and sustained pattern in correct trials. Two overlapping streams were shown in experiment 1, tagged at different flickering frequencies: Gabor patches were the task-relevant stream, with phase reversals serving as target events; face stimuli were used as competitors, because they have been shown to be effective intrinsic cues, attracting attention (Pessoa et al., 2002). The physical properties (contrast and spatial frequency) of the target stream in our study remained constant across the experimental session and within a trial. As a main result, greater allocation of resources to the target stream during the first 700 ms of stimulus presentation compared with later stages of attentional processing was clearly associated with errors in change detection. Such relative overallocation was followed by a dramatic decline of ssVEP amplitudes. In contrast, the visual response to the Gabor patch remained stable over time in trials with correct responses, suggesting that a balanced dynamics of visual source allocation is associated with sustained sensitivity to target events.
The finding of temporal decrease in attention allocation as a predictor of erroneous performance in change detection was replicated in experiment 2, where naturalistic complex visual scenes served as distractors, and no manipulation of affective content was implemented. Experiment 2 also showed pronounced early neural overengagement in the task stream during incorrect trials, but not during correct trials, a difference that did not reach statistical significance in experiment 1. The present results highlight the advantage of a balanced level of visual resource allocation over time during sustained attention. By contrast, an early overengagement of visual resources to the task-relevant stimulus is associated with deficits later in time, which in turn is related to missing target events, and hence represents a less adaptive process of sharing resources over time.
The relevance of resource sharing across time for successful attentive selection is in line with literature discussing the attentional blink (AB) phenomenon (Raymond et al., 1992). In the AB paradigm, participants are asked to identify two or more distinct targets embedded in a distractor stream. Attending to a first target then tends to impair identification of a second target, particularly when the two targets are separated by at least one distractor and ∼200–500 ms of time (Di Lollo et al., 2005). Although the present task involves detection rather than identification and recurrent identical, rather than distinct, target events, similarities exist between sustained attention tasks as used here and the AB. Neuroscience studies of the AB have consistently shown greater neural response amplitudes to the first target and smaller amplitudes to the second target in trials, in which the second target was missed (Kranczioch et al., 2007; Keil and Heim, 2009). Such changes have been interpreted in the context of resource-sharing accounts of visual information processing (Shapiro et al., 2006). In this perspective, strategic sharing of resources can be a function of effortful conscious processing or can occur outside awareness (Shapiro et al., 2006). Due to the nature of our present task, no inferences about the effect of one target on a subsequent target can be drawn here. Consequently, parallels between the AB and sustained attention in terms of attention dynamics are constrained to the temporal dynamics of time varying ssVEP amplitudes (Keil and Heim, 2009), and do not address critical aspects of the AB such as the interaction among targets as well as among targets and distractors (Vul et al., 2008).
As opposed to the complex interplay of working memory and vision that underlies the attentional blink, the present study used an approach in which sustained attention to low-level visual features was investigated, focusing on lower-tier visual cortex. Because visual resources are most strongly challenged in situations characterized by competition, we used a change detection paradigm in which the target stream competed with task-irrelevant but intrinsically interesting distractors (faces or complex scenes) that occupied the same sector of the visual field. The present results suggest that a strong initial biasing toward the Gabor patch (i.e., the task) features may result in a relative loss of neural signal gain later on. Such evidence for trade-off phenomena during allocation of limited resources is consistent with studies investigating spatial competition (Müller and Hübner, 2002; Wang et al., 2007), which have shown that electrophysiological enhancement when attending to specific locations is associated with commensurate amplitude reduction for competing locations. The present findings extend such trade-off effects by adding a temporal dimension. Trade-off effects were not seen across stimuli or locations, but across time points. Such a temporal pattern is consistent with psychophysical work reporting loss of contrast sensitivity over time during sustained attention (Ling and Carrasco, 2006). These results have been interpreted as heightened habituation on the basis of heightened neural gain, as afforded by attention. The present study suggests that such fluctuations in perceptual processing are mirrored in neural population activity as measured by ssVEPs.
Source estimation of the oscillatory brain response strongly supports the notion that the majority of the scalp-recorded ssVEP signals originate from lower-tier visual cortex, including area V1. This is in line with recent neuroimaging work reporting major contributions to the ssVEP from V1 and V5 (Di Russo et al., 2007). The present findings also support the idea that sensory gain at low levels of the visual hierarchy is involved in visual selective attention (Serences and Yantis, 2006), which has also been supported by fMRI evidence in studies using the AB design (Stein et al., 2008; Williams et al., 2008). It is important, however, to note that evidence for primary current sources in lower-tier visual cortex does not exclude the possibility of previous coactive sources in the brain (possibly in deep structures to which EEG is blind). The present source configuration also is compatible with re-entrant modulation of early visual cortex, in which other cortical or deep areas modulate the primary current source but are themselves not visible to the ssVEP method, as their modulatory input into visual areas may not be time locked to the flickering frequency.
Together, the present results highlight a strong correlation between a balanced level of visual cortical resource allocation over time and high detection accuracy during sustained attention. In a world of stimuli competing for attentional resources, overamplification of sensory signals to the task-relevant features seems to lead to a larger decrease of this cortical facilitation later in the processing stream, which most likely results in missing the change of a relevant feature. In line with results from feature- as well as object-based attention and resource-sharing approaches of attention, the dynamic pattern of attentional resource allocation observed here points to the assumption that a balanced level of resource allocation over time is a more effective strategy of deploying sustained attention. Future work manipulating the level of task-related oscillatory activity in visual cortex may examine whether this correlation reflects a beneficial causal role of balanced cortical engagement for task performance, or whether it represents an epiphenomenon of successful attention control.
Footnotes
This research was supported by NIMH (Grant R01 MH084932–02 to A.K.). We thank Kayla Gurak, Forest Gruss, and Michael Gray for help in data acquisition.
References
- Desimone R, Duncan J. Neural mechanisms of selective visual attention. Annu Rev Neurosci. 1995;18:193–222. doi: 10.1146/annurev.ne.18.030195.001205. [DOI] [PubMed] [Google Scholar]
- Di Lollo V, Kawahara J, Shahab Ghorashi SM, Enns JT. The attentional blink: resource depletion or temporary loss of control? Psychol Res. 2005;69:191–200. doi: 10.1007/s00426-004-0173-x. [DOI] [PubMed] [Google Scholar]
- Di Russo F, Pitzalis S, Aprile T, Spitoni G, Patria F, Stella A, Spinelli D, Hillyard SA. Spatiotemporal analysis of the cortical sources of the steady-state visual evoked potential. Hum Brain Mapp. 2007;28:323–334. doi: 10.1002/hbm.20276. [DOI] [PMC free article] [PubMed] [Google Scholar]
- Gross J, Kujala J, Hamalainen M, Timmermann L, Schnitzler A, Salmelin R. Dynamic imaging of coherent sources: studying neural interactions in the human brain. Proc Natl Acad Sci U S A. 2001;98:694–699. doi: 10.1073/pnas.98.2.694. [DOI] [PMC free article] [PubMed] [Google Scholar]
- Jolicoeur P. Restricted attentional capacity between sensory modalities. Psychon Bull Rev. 1999;6:87–92. doi: 10.3758/bf03210813. [DOI] [PubMed] [Google Scholar]
- Junghöfer M, Elbert T, Tucker DM, Rockstroh B. Statistical control of artifacts in dense array EEG/MEG studies. Psychophysiology. 2000;37:523–532. [PubMed] [Google Scholar]
- Kastner S, Ungerleider LG. Mechanisms of visual attention in the human cortex. Annu Rev Neurosci. 2000;23:315–341. doi: 10.1146/annurev.neuro.23.1.315. [DOI] [PubMed] [Google Scholar]
- Keil A, Heim S. Prolonged reduction of electrocortical activity predicts correct performance during rapid serial visual processing. Psychophysiology. 2009;46:718–725. doi: 10.1111/j.1469-8986.2009.00824.x. [DOI] [PMC free article] [PubMed] [Google Scholar]
- Kranczioch C, Debener S, Maye A, Engel AK. Temporal dynamics of access to consciousness in the attentional blink. Neuroimage. 2007;37:947–955. doi: 10.1016/j.neuroimage.2007.05.044. [DOI] [PubMed] [Google Scholar]
- Lang PJ, Bradley MM, Cuthbert BN. Gainesville, FL: University of Florida; 2005. International affective picture system (IAPS): affective ratings of pictures and instruction manual. [Google Scholar]
- Ling S, Carrasco M. When sustained attention impairs perception. Nat Neurosci. 2006;9:1243–1245. doi: 10.1038/nn1761. [DOI] [PMC free article] [PubMed] [Google Scholar]
- Lundqvist D, Flykt A, Öhman A. Karolinska Directed Emotional Faces (KDEF) Stockholm: Karolinska Institutet; 1998. [Google Scholar]
- Müller MM, Hübner R. Can the spotlight of attention be shaped like a doughnut? Psychol Sci. 2002;13:119–124. doi: 10.1111/1467-9280.00422. [DOI] [PubMed] [Google Scholar]
- Müller MM, Picton TW, Valdes-Sosa P, Riera J, Teder-Sälejärvi WA, Hillyard SA. Effects of spatial selective attention on the steady-state visual evoked potential in the 20–28 Hz range. Brain Res Cogn Brain Res. 1998a;6:249–261. doi: 10.1016/s0926-6410(97)00036-0. [DOI] [PubMed] [Google Scholar]
- Müller MM, Teder-Sälejärvi W, Hillyard SA. The time course of cortical facilitation during cued shifts of spatial attention. Nat Neurosci. 1998b;1:631–634. doi: 10.1038/2865. [DOI] [PubMed] [Google Scholar]
- Müller MM, Andersen S, Trujillo NJ, Valdés-Sosa P, Malinowski P, Hillyard SA. Feature-selective attention enhances color signals in early visual areas of the human brain. Proc Natl Acad Sci U S A. 2006;103:14250–14254. doi: 10.1073/pnas.0606668103. [DOI] [PMC free article] [PubMed] [Google Scholar]
- Müller MM, Andersen SK, Keil A. Time course of competition for visual processing resources between emotional pictures and foreground task. Cereb Cortex. 2008;18:1892–1899. doi: 10.1093/cercor/bhm215. [DOI] [PubMed] [Google Scholar]
- Olivers CN, van der Stigchel S, Hulleman J. Spreading the sparing: against a limited-capacity account of the attentional blink. Psychol Res. 2007;71:126–139. doi: 10.1007/s00426-005-0029-z. [DOI] [PubMed] [Google Scholar]
- Pessoa L, Kastner S, Ungerleider LG. Attentional control of the processing of neutral and emotional stimuli. Brain Res Cogn Brain Res. 2002;15:31–45. doi: 10.1016/s0926-6410(02)00214-8. [DOI] [PubMed] [Google Scholar]
- Picton TW, Bentin S, Berg P, Donchin E, Hillyard SA, Johnson R, Jr, Miller GA, Ritter W, Ruchkin DS, Rugg MD, Taylor MJ. Guidelines for using human event-related potentials to study cognition: recording standards and publication criteria. Psychophysiology. 2000;37:127–152. [PubMed] [Google Scholar]
- Raymond JE, Shapiro KL, Arnell KM. Temporary suppression of visual processing in an RSVP task: an attentional blink? J Exp Psychol Hum Percept Perform. 1992;18:849–860. doi: 10.1037//0096-1523.18.3.849. [DOI] [PubMed] [Google Scholar]
- Regan D. New York: Elsevier; 1989. Human brain electrophysiology: evoked potentials and evoked magnetic fields in science and medicine. [Google Scholar]
- Reynolds JH, Chelazzi L, Desimone R. Competitive mechanisms subserve attention in macaque areas V2 and V4. J Neurosci. 1999;19:1736–1753. doi: 10.1523/JNEUROSCI.19-05-01736.1999. [DOI] [PMC free article] [PubMed] [Google Scholar]
- Serences JT, Yantis S. Selective visual attention and perceptual coherence. Trends Cogn Sci. 2006;10:38–45. doi: 10.1016/j.tics.2005.11.008. [DOI] [PubMed] [Google Scholar]
- Shapiro K, Schmitz F, Martens S, Hommel B, Schnitzler A. Resource sharing in the attentional blink. Neuroreport. 2006;17:163–166. doi: 10.1097/01.wnr.0000195670.37892.1a. [DOI] [PubMed] [Google Scholar]
- Stein T, Vallines I, Schneider WX. Primary visual cortex reflects behavioral performance in the attentional blink. Neuroreport. 2008;19:1277–1281. doi: 10.1097/WNR.0b013e32830bab02. [DOI] [PubMed] [Google Scholar]
- Szczepanski SM, Konen CS, Kastner S. Mechanisms of spatial attention control in frontal and parietal cortex. J Neurosci. 2010;30:148–160. doi: 10.1523/JNEUROSCI.3862-09.2010. [DOI] [PMC free article] [PubMed] [Google Scholar]
- Vul E, Hanus D, Kanwisher N. Delay of selective attention during the attentional blink. Vision Res. 2008;48:1902–1909. doi: 10.1016/j.visres.2008.06.009. [DOI] [PMC free article] [PubMed] [Google Scholar]
- Wang J, Clementz BA, Keil A. The neural correlates of feature-based selective attention when viewing spatially and temporally overlapping images. Neuropsychologia. 2007;45:1393–1399. doi: 10.1016/j.neuropsychologia.2006.10.019. [DOI] [PMC free article] [PubMed] [Google Scholar]
- Williams MA, Visser TA, Cunnington R, Mattingley JB. Attenuation of neural responses in primary visual cortex during the attentional blink. J Neurosci. 2008;28:9890–9894. doi: 10.1523/JNEUROSCI.3057-08.2008. [DOI] [PMC free article] [PubMed] [Google Scholar]