Abstract
Single molecule free solution hydrodynamic separation (SML-FSHS) cohesively integrates cylindrical illumination confocal spectroscopy with free solution hydrodynamic separation. This technique enables single molecule analysis of size separated DNA with 100% mass detection efficiency, high sizing resolution and wide dynamic range, surpassing the performance of single molecule capillary electrophoresis. Furthermore, SML-FSHS required only a bare fused silica microcapillary and simple pressure control rather than complex high voltage power supplies, sieving matrices, and wall coatings. The wide dynamic range and high sizing resolution of SML-FSHS was demonstrated by separating both large DNA (23 vs. 27 kbp) and small DNA (100 vs. 200 bp) under identical conditions. Separations were successfully performed with near zero sample consumption using as little as 5 pL of sample and 240 yoctomoles (~150 molecules) of DNA. Quantitative accuracy was predominantly limited by molecular shot noise. Furthermore, the ability of this method to analyze of single molecule nanosensors was investigated. SML-FSHS was used to examine the thermodynamic equilibrium between stochastically open molecular beacon and target-bound molecular beacon in the detection of E. coli 16s rRNA targets.
Capillary electrophoresis (CE) remains the most widely used analytical method for high-resolution separation of DNA and other biological molecules. With the help of laser-induced fluorescence (LIF), the detection limit can be reduced to typical levels of 10−18 to 10−21mol1,2 and single-molecule capillary electrophoresis (SM-CE) becomes possible.3-6 Such techniques are limited by low mass detection efficiency (<1%), narrow DNA sizing dynamic range, the necessity for viscous sieving matrices, and the complexities of high voltage injection and separation schemes.
We report a method for coupled single molecule analysis of size separated DNA that surpasses the performance of SM-CE. By integrating cylindrical illumination confocal spectroscopy (CICS)7,8 with free solution hydrodynamic separation (FSHS)9,10, we demonstrated size specific single molecule analysis of DNA that required <100 molecules per band and only picoliters of sample. FSHS is a unique separation platform for two reasons. First, it has an unmatched combination of wide DNA sizing dynamic range and high sizing resolution. High resolution separation can be performed in a single run across a 1000-fold range of DNA sizes.9 Second, it has near zero sample consumption requiring injection volumes of only 5 pL. However, the low detection sensitivity of early demonstrations still required high DNA concentrations for detection (ng/μL), limiting its application as an analytical method for rare or low abundance samples. Furthermore, accurate quantification of the separated peaks (e.g. sub-populations of DNA fragments) using bulk fluorescent intensity is challenging as rigorous calibration is required to reduce bias arising from the variable fluorescent intensity of different length DNA fragments. To date, no demonstration of quantification using FSHS has been made. The development of a highly sensitive and accurate quantification method could enable FSHS as a power analytical tool for rare samples in clinical diagnostics, biomarker detection, and unamplified genetic analysis
By using the laser sheet of CICS for detection in contrast to a small spot in LIF, 100% mass detection efficiency of single molecules within the separation capillary was achieved. In addition, direct single molecule counting improved quantitative accuracy by eliminating reference curves and decoupling fluorescent intensity from abundance. This method was used to separate both large (23 vs. 27 kbp) and small DNA (100 vs. 200 bp) under the same conditions and required only inexpensive microcapillary, simple pressure control, and standard buffers. This technique was also used in a single molecule assay to detect a bacterial 16s rRNA sequence with molecular beacon nanosensors. Because the separation was non-denaturing, we were able to investigate the thermodynamic equilibrium between molecular beacons in the bound-open state versus unbound-stochastically open state.
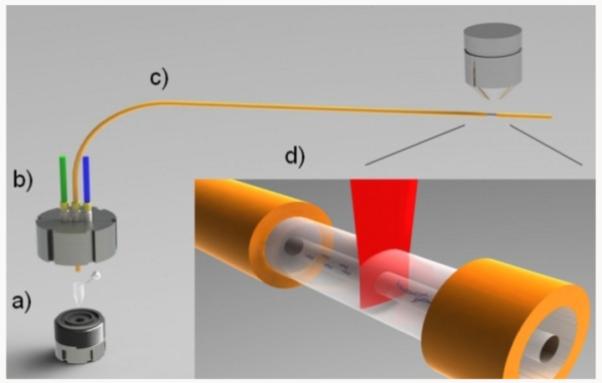
Single molecule free solution hydrodynamic separation (SML-FSHS) was performed using the apparatus illustrated in Figure 1. A small injection chamber was designed to house a 200 μL PCR tube. When pressure was applied to the chamber via the blue port, sample was driven from the tube into the 2 μm ID, 75 cm long, fused silica microcapillary shown in yellow. The green port was connected to a digital pressure gauge to monitor chamber pressure. Meanwhile, the CICS observation volume was focused into the detection window at the opposite end of the capillary. The laser illumination sheet, shown in red, had a 1/e2 diameter of 36 μm, considerably larger than the 2 μm capillary lumen. The confocal aperture, not shown, enabled light collection only from the center 7 μm of the laser line where the illumination was most uniform. In combination, these two elements created a 7 × 2 μm (w x h) CICS observation volume capable of 100% mass detection efficiency of all molecules within the capillary.8 To perform a separation, a tube containing TE buffer was first placed into the chamber and used to fill the capillary with loading buffer. The tube was then swapped out for a 2nd tube containing the sample to be analyzed. An ~11s injection was performed to create a ~5 pL sample plug. Finally, a 3rd tube containing TE elution buffer was placed into the chamber and pressure was applied. In all experiments, 100 psi of pressure was used. CICS analysis was performed at the opposite end of the capillary immediately following the final pressure application. Fluorescence data was acquired as a function of time to form a raw avalanche photodiode (APD) fluorescence trace which was analyzed using either bulk fluorescence or single molecule analysis to form a chromatogram. Peak fitting analysis was performed on the final chromatograms to identify the peak parameters.
Figure 1.

Schematic illustration of the SML-FSHS system. The system comprises: a) a stainless steel injection chamber, b) pressure control ports, c) separation capillary, and d) CICS analysis region.
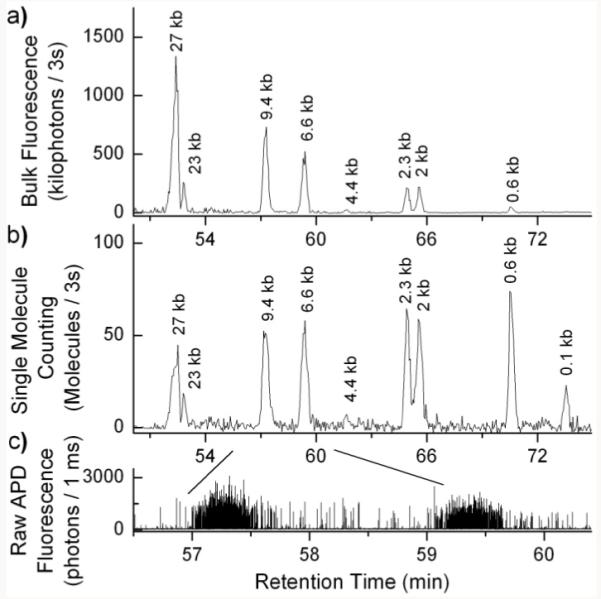
Figure 2 shows chromatograms and raw fluorescence data of TOTO-3 labeled λ Hind iii digest DNA at 5 ng/μL concentration separated using SML-FSHS. Each spike in the raw APD fluorescence data (Figure 2c) represents a single DNA molecule. A cursory examination of the data shows that within the peak regions there is a high density of single DNA molecules that travel together along the capillary whereas outside the peak regions there is a low number of background molecules. For bulk fluorescence analysis (Figure 2a), the raw fluorescence data was integrated over 3s periods to form a chromatogram. For single molecule analysis (Figure 2b), a thresholding algorithm was used to identify single molecule bursts within the raw fluorescence data. These identified bursts were then summed over 3s periods to form a chromatogram.
Figure 2.

Free solution hydrodynamic separation chromatograms of λ Hind iii digest DNA taken using CICS. The raw fluorescence data c) was analyzed using a) bulk fluorescence and b) single molecule counting. Analysis was performed at 5 ng/μL.
Previously reported demonstrations of FSHS were performed at 25 ng/μL, where bulk fluorescence spectroscopy could be used9. However, at 5 ng/μL, the limitations of bulk FSHS can be seen in Figure 2a. Because each fragment was present at equal molar ratio, the fluorescent intensity of each peak scaled directly with DNA length. Based on size, the intensity of the 0.1 kb peak should be hundreds of times lower than that of the 23 kb peak. In this case, it was rendered undetectable by bulk fluorescence. Alternatively, when the same analysis was performed using single molecule FSHS (SML-FSHS), each fragment was detected equally. This can be qualitatively seen in Figure 2b where all the peaks have comparable size regardless of length. Occasionally, elevated fluorescence background arising from residual polyimide in the detection window can compromise the S/N ratio for the smallest DNA fragments. Though the 0.1 kb peak appears underrepresented, it is still clearly detectable above baseline. The 4.4 kb fragment is almost entirely absent due to near complete annealing to the 23 kb fragment, creating a new 27 kb fragment. These factors further are illustrated in Supporting Figure S-1. Both bulk and single molecule analysis give nearly identical retention time curves (Supporting Figure S-2). Detailed analysis parameters are provided in Supporting Table 1.
SML-FSHS is unique in that it has a wide dynamic range and is able to separate both long and short DNA within the same run. Conventional methods, such as agarose gel electrophoresis and pulsed field gel electrophoresis, do not possess the same combination of resolution, dynamic range, and sensitivity.11,12 23 kb vs. 27 kb fragments can be separated under the same conditions as 2 kb vs. 2.3 kb and 100 bp vs. 200 bp fragments. Given the current configuration (L = 75 cm, ID = 2 μm, P = 100 psi) and results, the minimum sizing resolutions at 125, 2027, and 23130 bp are 37, 147, and 2108 bp, respectively. The separation mechanism is thought to occur through wall exclusion and is non-linear with DNA length.13,14 The finite gyration radius of each molecule limits the proximity at which it can approach the wall. When combined with the Poiseuille flow profile, each molecule experiences a different average flow velocity dependent on its size. Higher DNA sizing resolution can be obtained by transitioning to a smaller diameter or longer capillary. 5 nucleotide resolution has been previously demonstrated using a 1 μm ID capillary.15
Significant variations in sizing resolution have been seen from capillary manufacturing tolerances. Resolution between the 2027 and 2322 bp peaks varied from 1.1 to 3.4 across a 50 m batch of capillary. We estimate this was due to a ~0.4 μm variation in capillary ID. This dimensional variation also has a significant effect on absolute retention time which can be reduced through calibration or, perhaps, the precision fabrication tolerances achievable in microfluidics. Additionally, the staining ratio can have adverse effects on the DNA separation efficiency. At higher dye:bp ratios, greater amounts of background DNA were seen between the separated peaks. We suspect this is due to the dimeric TOTO-3 dye stochastically bridging adjacent DNA molecules16,17 and creating new, pseudo-randomly sized DNA fragments. This effect can be minimized by optimizing the staining protocol (Supporting Figure S-3) or transitioning to a monomeric dye.
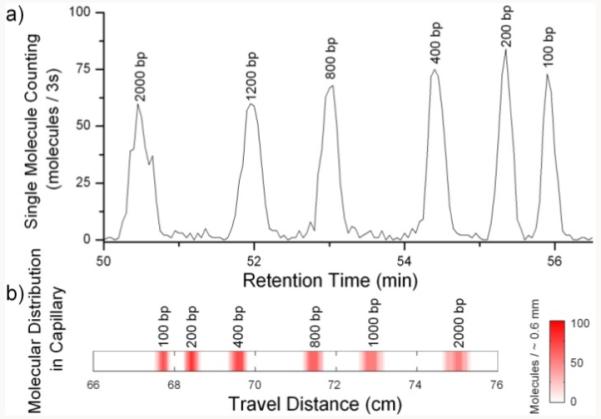
To test the sizing resolution and detection sensitivity, SML-FSHS was performed on a TOTO-3 labeled 100 bp DNA ladder. Figure 3a shows a single molecule chromatogram taken at 0.25 ng/μL total concentration. Once again each peak appears with equal magnitude. Each of the peaks was fully resolved as the resolution between adjacent peaks varied from 3.0 to 5.9. Calculations of theoretical plate number show that the separation efficiency was also very high. Plate number ranged from 151,000 to 533,000 across the peaks. In other experiments, we have attained plate numbers over 1,400,000. The time domain data in Figure 3a is remapped into a spatial domain heat map in Figure 3b to illustrate the distribution of molecules as they travel down the capillary. A retention time curve is shown in Supporting Figure S-4 along with peak parameters in Supporting Table 2.
Figure 3.

SML-FSHS analysis of a 100 bp DNA ladder using 610 yoctomoles of DNA depicted as a) a retention time chromatogram and b) a spatial distribution heat map.
With a 7.6 pL injection volume, 610 yoctomoles of DNA were analyzed which is 2-3 orders of magnitude lower than standard CE-LIF1,2 and previous FSHS.9 Quantification was performed by direct single molecule counting without the need for reference samples. Whereas 368±19 DNA molecules were expected, an average of 353±38 molecules was detected in each of the six peaks. If the slightly underrepresented 100 bp peak is excluded, the average increases and the standard deviation decreases to 368±16 molecules, matching the predicted value based on injection volume and Poisson variability. 100 bp DNA labeled with TOTO-3 is quite dim, approximately 2-3 times less bright than a single fluorophore such as Cy5, Because a thresholding algorithm is used to identify single molecule bursts, the limited S/N ratio of the smallest 100 bp fragments can lead to reduced mass detection efficiency (i.e. the total proportion of injected molecules which are actually detected) as some small fluorescent bursts are mistaken for background fluctuations. This effect was not seen for the 200 bp and larger DNA which have sufficient S/N ratio to avoid these thresholding artifacts, suggesting that a brighter intercalating dye or a single fluorophore label such as Cy5 could help. Furthermore, this suggests that, for all but the dimmest molecules, SML-FSHS has 100% mass detection efficiency and high quantification accuracy that is limited predominantly by molecular shot noise.5 This agrees with our previous data that demonstrates 100% mass detection efficiency within a 2 μm deep microchannel.8
The projected limit of detection (i.e. the minimum number of injected molecules necessary for a resolvable chromatogram peak) for the 400 bp peak (S/N = 3) approaches 27 yoctomoles (~16 molecules). For small DNA, we have obtained well differentiated chromatograms with as few as 240 yoctomoles (~150 molecules). Supporting Figure S-5 shows a chromatogram consisting of ~ 70 molecules per peak. At such low levels, the quantitative accuracy was limited by mass loss within the capillary in addition to molecular shot noise though the exact mechanisms are unclear.
As a final test, we investigated whether SML-FSHS could be used to enhance a typical single molecule assay. Many solution phase nanosensor assays are designed to be homogeneous because of difficulty in separating unbound probes and fluorophores.18 For example, molecular beacon probes are theoretically designed to bind and fluoresce only in the presence of specific DNA target, eliminating the need to remove unbound probes. However, in practice unbound probes stochastically fluctuate between open and closed states even in the absence of target. This difficulty in distinguishing between target-bound beacon and stochastically open beacon increases fluorescence background and reduces assay sensitivity. Many approaches have been taken to reduce background and increase beacon sensitivity.19,20
A 24 bp molecular beacon was designed to detect a region of the E. coli 16s rRNA sequence.21 Bulk fluorescence experiments were first performed to verify functionality of the beacon. A serial dilution of the rRNA target was performed from 128 nM down to 0.25 nM and hybridized to 5 nM molecular beacon in TE buffer. A substantial increase in fluorescence was seen when the target concentration was varied from 2 to 128 nM (Supporting Figure S-6). Below 2 nM, little change in fluorescence was seen. The high background fluorescence level indicated that even in absence of target, large numbers of beacons remained stochastically open. This was due to the intrinsic thermodynamic equilibrium between the conformational states and the lack of MgCl2 in the buffer.
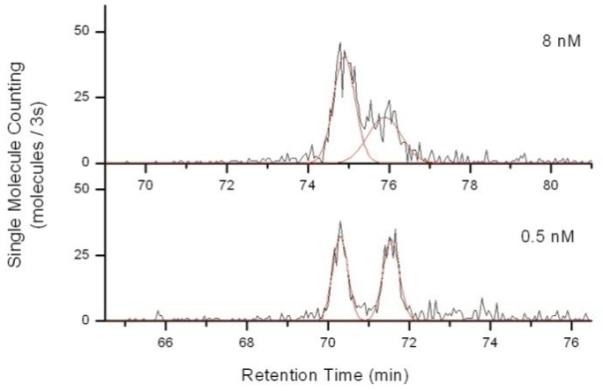
For SML-FSHS analysis, the 8 nM target and 0.5 nM target pairs were chosen. Figure 4 shows the resultant single molecule chromatograms. Peak fits are shown in red. The first peak corresponded to the larger target bound molecular beacon complex while the second peak corresponded to the smaller beacon only complex. Any signal present in the second peak could only arise from beacons that were stochastically open. Closed beacons and unbound target could not be seen. A slight shift in retention time is seen due to capillary ID variation.
Figure 4.

SML-FSHS analysis of a 16s rRNA target using a molecular beacon. The earlier peak and later peak correspond to target bound beacon and stochastically open beacon, respectively.
From this data, it is evident why the sensitivity of the molecular beacon decreases so rapidly below 1 nM. As the target concentration decreased, the number of target bound beacons decreased (1st peak) while the number of stochastically open beacons remained constant (2nd peak). At 0.5 nM target concentration, the number of target bound beacons and stochastically open beacons was nearly equal at 303 and 314 molecules, respectively. In the absence of separation, these bursts are indistinguishable from one another and the fluorescent background swamps out the target induced signal. However, with SML-FSHS the true signal can be resolved from background based on size of the bound complex. Thus, this method can be used to optimize nanosensor design at low target concentrations and potentially be extended to heterogeneous single molecule assays to separate unbound background probes.
In conclusion, we have demonstrated SML-FSHS, a method that cohesively integrates a simple and high resolution size based separation with high sensitivity single molecule analysis. Because of the seamless integration between the low mass loss separation method and high mass detection efficiency CICS, analysis could be performed using only yoctomoles of DNA and picoliters of sample. With further development, this method could be applied to a bevy of applications where CE and HPLC are currently utilized but with greatly reduced cost due the simple apparatus and materials that are required. The wide dynamic range could enable new applications where slower and less sensitive methods such as pulsed field gel electrophoresis are used. Each run consumes only minute amounts of standard buffers and sample. Capillaries are inexpensive and require no special preparation. Separation requires only a small chamber and simple pressure control. The CICS detection system is no more complex than a standard LIF system. Furthermore, SML-FSHS can also be used in single molecule assays to improve sensitivity and specificity by reducing background and increase assay content through multiplex analysis. New single molecule assays can be designed that are heterogeneous in format since separation and detection are cohesively coupled. Finally, due to the simple separation apparatus and design, throughput can be easily enhanced by utilizing capillary arrays or microfluidic formats.
Supplementary Material
Acknowledgment
Financial support was provided by the National Institutes of Health (Grants R21-CA120742, U54-CA151838, and P50-CA058184), National Science Foundation (Grants 0546012, 0730503, 0725528, and 0967375), and AACR Stand Up to Cancer (SU2C) – Epigenetics Dream Team
Footnotes
Supporting Information Available: Experimental section and chromatogram peak fit data. This material is available free of charge via the Internet at http://pubs.acs.org.
REFERENCES
- (1).Kostal V, Katzenmeyer J, Arriaga EA. Anal Chem. 2008;80:4533–50. doi: 10.1021/ac8007384. [DOI] [PMC free article] [PubMed] [Google Scholar]
- (2).Frost NW, Jing M, Bowser MT. Anal Chem. 2010;82:4682–98. doi: 10.1021/ac101151k. [DOI] [PubMed] [Google Scholar]
- (3).Haab BB, Mathies RA. Anal Chem. 1999;71:5137–45. doi: 10.1021/ac990644t. [DOI] [PubMed] [Google Scholar]
- (4).Haab BB, Mathies RA. Anal Chem. 1995;67:3253–60. doi: 10.1021/ac00114a023. [DOI] [PubMed] [Google Scholar]
- (5).Chen D, Dovichi NJ. Anal Chem. 1996;68:690–696. [Google Scholar]
- (6).Effenhauser CS, Bruin GJM, Paulus A, Ehrat M. Anal Chem. 1997;69:3451–3457. doi: 10.1021/ac9703919. [DOI] [PubMed] [Google Scholar]
- (7).Liu KJ, Brock MV, Shih Ie M, Wang TH. J Am Chem Soc. 2010;132:5793–8. doi: 10.1021/ja100342q. [DOI] [PMC free article] [PubMed] [Google Scholar]
- (8).Liu KJ, Wang TH. Biophys J. 2008;95:2964–75. doi: 10.1529/biophysj.108.132472. [DOI] [PMC free article] [PubMed] [Google Scholar]
- (9).Wang X, Veerappan V, Cheng C, Jiang X, Allen RD, Dasgupta PK, Liu S. J Am Chem Soc. 2010;132:40–1. doi: 10.1021/ja909233n. [DOI] [PubMed] [Google Scholar]
- (10).Iki N, Kim Y, Yeung ES. Anal Chem. 1996;68:4321–4325. [Google Scholar]
- (11).Finney M. Pulsed-Field Gel Electrophoresis. John Wiley & Sons, Inc.; 2001. [DOI] [PubMed] [Google Scholar]
- (12).Voytas D. Agarose Gel Electrophoresis. John Wiley & Sons, Inc.; 2001. [Google Scholar]
- (13).Stein D, van der Heyden FH, Koopmans WJ, Dekker C. Proc Natl Acad Sci U S A. 2006;103:15853–8. doi: 10.1073/pnas.0605900103. [DOI] [PMC free article] [PubMed] [Google Scholar]
- (14).Tijssen R, Bos J, van Kreveld ME. Anal Chem. 1986;58:3036–3044. [Google Scholar]
- (15).Wang X, Wang S, Veerappan V, Byun CK, Nguyen H, Gendhar B, Allen RD, Liu S. Anal Chem. 2008;80:5583–9. doi: 10.1021/ac800549k. [DOI] [PMC free article] [PubMed] [Google Scholar]
- (16).Glazer AN, Rye HS. Nature. 1992;359:859–61. doi: 10.1038/359859a0. [DOI] [PubMed] [Google Scholar]
- (17).Kim Y, Morris MD. Anal Chem. 1994;66:1168–74. doi: 10.1021/ac00079a035. [DOI] [PubMed] [Google Scholar]
- (18).Zhang CY, Yeh HC, Kuroki MT, Wang TH. Nat Mater. 2005;4:826–31. doi: 10.1038/nmat1508. [DOI] [PubMed] [Google Scholar]
- (19).Santangelo PJ, Nix B, Tsourkas A, Bao G. Nucleic Acids Res. 2004;32:e57. doi: 10.1093/nar/gnh062. [DOI] [PMC free article] [PubMed] [Google Scholar]
- (20).Wang L, Yang CJ, Medley CD, Benner SA, Tan W. J Am Chem Soc. 2005;127:15664–5. doi: 10.1021/ja052498g. [DOI] [PubMed] [Google Scholar]
- (21).Xi C, Balberg M, Boppart SA, Raskin L. Appl Environ Microbiol. 2003;69:5673–8. doi: 10.1128/AEM.69.9.5673-5678.2003. [DOI] [PMC free article] [PubMed] [Google Scholar]
Associated Data
This section collects any data citations, data availability statements, or supplementary materials included in this article.


