

Abstract
Malignant astrocytomas, the most common primary brain tumors, are predominantly fatal. Improved treatments will require a better understanding of the biological features of high-grade astrocytomas. To better understand the role of neuronal PAS 3 (NPAS3) in diseases in human beings, it was investigated as a candidate for astrocytomagenesis based on the presence of aberrant protein expression in greater than 70% of a human astrocytoma panel (n = 433) and most notably in surgically resected malignant lesions. In subsequent functional studies, it was concluded that NPAS3 exhibits features of a tumor-suppressor, which drives the progression of astrocytomas by modulating the cell cycle, proliferation, apoptosis, and cell migration/invasion and has a further influence on the viability of endothelial cells. Of clinical importance, absence of NPAS3 expression in glioblastomas was a significantly negative prognostic marker of survival. In addition, malignant astrocytomas lacking NPAS3 expression demonstrated loss of function mutations, which were associated with loss of heterozygosity. While overexpressed NPAS3 in malignant glioma cell lines significantly suppressed transformation, the converse decreased expression considerably induced more aggressive growth. In addition, knockdown NPAS3 expression in a human astrocyte cell line in concert with the human papillomavirus E6 and E7 oncogenes induced growth of malignant astrocytomas. In conclusion, NPAS3 drives the progression of human malignant astrocytomas as a tumor suppressor and is a negative prognostication marker for survival.
Primary brain tumors are among the top five causes of cancer-related death, with a predominance of malignant gliomas in adults (∼60%) and children (∼30%).1 The World Health Organization classifies astrocytomas, the most common glial tumor, into four grades, with glioblastoma, World Health Organization grade IV, the most prevalent (>50%) and of highest histologic grade.1 Although pathologically indistinguishable, there are two clinically distinct subtypes of glioblastomas, namely, primary and secondary, both of which correspond to at least two distinct pathways of genetic progression.1 Moreover, recent molecular classification studies using genomics-based approaches have further established glioblastomas as among the neural, proneural, mesenchymal, and classic subtypes.2 The ongoing Cancer Genome Project2–9 has identified more than 220 minimally critical regions in the human genome including a deletion of the locus containing the NPAS3 gene, which may be involved in the pathogenesis of high-grade astrocytomas.
NPAS3 is a member of the neuronal PAS transcription factor gene family, basic helix-loop-helix Period–aryl hydrocarbon receptor–single minded genes that have diverse roles including cancer development and neurobehavior.10–17 NPAS3 maps to human chromosome 14, spanning across approximately 884 kb of genomic sequence over 11 exons. There are currently six predicted but not yet fully validated transcript isoforms. Although NPAS3 is expressed in nontransformed human astrocytes,14 only one transcript isoform, NM_022123, was expressed in astrocytes after sequencing of the transcript. This transcript isoform encodes a 901–amino acid protein with a basic helix-loop-helix DNA binding domain, C-terminus nuclear localization signal, and protein-protein dimerization domains (PAS and PAC domains), regions reminiscent of and validated as transcription factors.12,15 NPAS3 is expressed as early as gastrulation with roles that include neurogenesis and lung formation.15–17 In addition to expression in astrocytes, NPAS3 expression has been identified in progenitor cells of the subventricular zone and dentate gyrus of the human hippocampus,14 anatomical regions that have profound roles in neurogenesis.18 Further detailed IHC analysis of NPAS3 expression during human fetal brain development revealed largely confined expression in the nucleus of cells in the ventricular zone and hippocampus in the first trimester, with more widespread progressive increases becoming more apparent in the molecular layer and layer III of the maturing neocortex during the second and third trimesters.14 In a spatiotemporally controlled manner in the cerebellum, nuclear expression has also been identified in basket cells and in Bergmann's glia, with some cytoplasmic staining evident in the internal granule layer of neurons.14
After initial cloning of the NPAS3 gene,13 the objective of the present study was to investigate the role of this gene in diseases in human beings. Previous studies have suggested a potential role of NPAS3 in congenital neurobehavioral and neurodevelopmental anomalies.12,13,19 However, no nonpolymorphic mutations have yet been identified in human subjects with isolated neurobehavioral deficits,20 leading to the postulation that the neurobehavioral deficit documented in the original family13 was not an isolated clinical phenomenon but perhaps a consequence of midline structural anatomical defects of the nervous system.16 Furthermore, deletion of chromosome 14 with NPAS3 has been reported in numerous tumors including oligodendrogliomas, melanomas, and carcinomas of the breast, prostate gland, and urogenital tract, as compared with normal nonneoplastic tissues,5,21–23 but with yet to be characterized functional roles in these cancers. The incentive to investigate NPAS3 as a candidate gene for astrocytoma (an acquired disease) originated after discovering genome findings archived by the Cancer Genome Project,2–9 with as many as 80% of astrocytomas exhibiting deletion of chromosome 14 (including NPAS3 cytogenetic region) and from prescreening of 433 surgically resected astrocytoma specimens using IHC for astrocytoma candidate genes that identify greater than 70% with aberrant NPAS3 protein expression. From these preliminary findings, the hypothesis of the role of NPAS3 in astrocytomas was tested. After undertaking extensive functional analysis of NPAS3, including expression and mutation studies, and functional assays using human glioma cell lines and nontransformed astrocyte cell lines, the present study collectively demonstrated evidence that NPAS3 has features of a tumor suppressor that determines the progression of malignant astrocytomas in humans. A wide spectrum of mutations involving NPAS3 was identified in glioblastoma surgical specimens, some of which were characterized as having loss of function and associated loss of heterozygosity. Absence of NPAS3 expression has also been correlated with highly proliferative glioblastomas and with decreased overall patient survival. While loss of NPAS3 expression accelerates transformation of human glioma cell lines, the converse increased expression reverses transformation. Loss of NPAS3 expression also acts in concert with other progression signaling pathways such as pRB and p53 to induce the aggressive transformation of a well-characterized human astrocyte cell line. NPAS3 determines the progression of astrocytomagenesis by controlling the cell cycle, proliferation, apoptosis, and cell migration and invasion of human glioma cell lines and astrocytes and by influencing the viability of human umbilical vein endothelial cells.
Materials and Methods
Western Blot Analysis
Protein lysates were obtained from all parental and engineered cell lines using the Mammalian Cell Lysate Kit (Sigma-Aldrich Corp., St Louis, MO). Approximately 20 μg protein was electrophoresed on 10% acrylamide gel and transferred to polyvinylidene difluoride membranes. The Western blots were incubated with a rabbit polyclonal antibody to NPAS3 (Sigma-Aldrich Corp.) at room temperature for 4 hours. The blots were stripped with Western blot stripping buffer (Pierce Chemical Co., Rockford, IL) and re-probed using β-actin monoclonal clone AC-15 (Sigma-Aldrich Corp.) to detect loading differences. All primary antibodies were detected using Protein G-HRP (Zymed Laboratories, Inc., South San Francisco, CA).
IHC Analysis
FFPE sections were deparaffinized, followed by antigen heat retrieval in Tris-EDTA, pH 9.0, using a digital decloaking chamber (Biocare Medical Inc., Concord, CA) at 120°C for 2 minutes, then allowed to cool to room temperature for 20 minutes. Endogenous peroxidase and biotin activities were blocked using, respectively, 3% hydrogen peroxide and an avidin/biotin blocking kit (Lab Vision Corp., Fremont, CA). After further blocking for 15 minutes with 10% normal goat serum, sections were incubated at room temperature in a moist chamber with rabbit polyclonal NPAS3 antibody (Sigma-Aldrich Corp.; 1:300), rabbit polyclonal glial fibrillary acidic protein (GFAP) antibody (Dako Corp., Carpenteria, CA; 1:600), or rabbit polyclonal Ki-67 (clone MIB1) antibody (Abcam Inc., Cambridge, MA; 1:100) for 1 hour. This was followed by incubation for another 30 minutes using biotinylated goat anti-rabbit IgG linking antibody (Vector Laboratories, Inc., Burlingame, CA), then with treatment for 30 minutes using horseradish peroxidase–conjugated ultra-streptavidin labeling reagent (ID Labs Inc., London, ON, Canada). After washing well in Tris-buffered saline solution, color development was performed in freshly prepared NovaRed solution (Vector Laboratories, Inc.), and sections were counterstained lightly using Mayer's hematoxylin, dehydrated in alcohols, cleared in xylene, and mounted in Permount (Fisher Scientific Co., Ottawa, ON, Canada). IHC staining for NPAS3 expression was manually reviewed and graded for both strength (0, none; 1, weak; and 2, strong) and distribution (<25%, 25% to 50%, and >50% of tumor cells) based on the staining properties of the tumor tissues versus control and healthy brain tissues. Elevated expression was noted in specimens that had strongly stained cells (score of 2) with distribution greater than 50%. Normal expression was noted in specimens that had strongly stained cells (score of 2) with distribution of 25% to 50%. Reduced expression was noted in specimens that had weakly stained cells (score of 1) with distribution less than 25%. Absent expression was noted in specimens that had no staining (score of 0) with distribution greater than 50%.
Double IHC
Paraffin sections were dewaxed using standard methods. Antibody heat retrieval was in Tris-EDTA buffer, pH 9, in a digital decloaking chamber (Biocare Medical Inc., Concord, CA) at 120°C for 2 minutes. Endogenous peroxidase and biotin activities, respectively, were blocked using 3% aqueous hydrogen peroxide and an avidin/biotin blocking kit (Lab Vision Corp., Fremont, CA). Sections were also blocked with 10% normal goat serum for 15 minutes before staining with rabbit polyclonal antibody to NPAS3 (Sigma-Aldrich Corp.) at 1:300 dilution for 1 hour at room temperature in a moist chamber. This was followed by color development for 30 minutes via treatment with biotinylated goat anti-rabbit IgG and freshly prepared 3,3′ diaminobenzidine solution (Dako Corp.). After washing well in running tap water, avidin/biotin blocking was performed again before sections were treated with 10% normal goat serum for 15 minutes. Rabbit polyclonal antibody to GFAP was applied for 1 hour at 1:2000 dilution at room temperature. This was followed by color development for 30 minutes via treatment with biotinylated goat anti-rabbit IgG linking antibody (Vector Laboratories, Inc.) and horseradish peroxidase–conjugated streptavidin labeling reagent (ID Labs Inc.). Sections were washed well in Tris-buffered saline solution and developed with freshly prepared Bajoran Purple solution (Biocare Medical Inc.). After washing well in tap water, sections were lightly counterstained with Mayer's hematoxylin, dehydrated in graded alcohols, cleared in xylene, and mounted (Permount).
Double Immunofluorescence Cytochemistry
NHA-TERT cells were grown as adherent cells for 48 hours on four-well chamber slides (BD Biosciences, Franklin Lakes, NJ) in DMEM (Dulbecco's modified Eagle's medium) with 10% fetal calf serum (FCS) (both from Wisent, Inc., St-Bruno, QC, Canada). After removal of growth media, cells were fixed in ice-cold acetone for 5 minutes, then treated using ice-cold methanol for another 5 minutes. Cells were washed with PBS before incubation with 0.5% blocking buffer (Hoffman-La Roche Inc., Nutley, NJ) in PBS for 2 hours at room temperature and with rabbit polyclonal antibodies to GFAP and NPAS3. These polyclonal antibodies were, however, first labeled with monoreactive Cy3 and Cy5 (CyDye; GE Healthcare, Piscataway, NJ), with Cy3 conjugated to the GFAP antibody and Cy5 conjugated to the NPAS3 antibody. After co-incubation with the antibodies, the cells were washed four times for 20 minutes each at room temperature and counterstained with DAPI (Dako Corp.). Images were captured using an Eclipse 80i microscopy system with bright field and fluorescence features, a Digital Sight DS-Ri1 high-resolution camera, and NIS-Elements BR software (all from Nikon Instruments Inc., Melville, NY).
FISH with Bacterial Artificial Chromosome Probe
For fluorescence in situ hybridization (FISH) paraffin slides were dewaxed using standard methods, incubated in 1 mol/L sodium thiocyanate at 80°C for 45 minutes, and washed with water four times before treatment with protease (Abbott Molecular, Abbott Laboratories, Abbott Park, IL) for 10 minutes at 37°C. The slides were again washed several times in distilled water and aged in 70% ethanol. RPMI-66M11 bacterial artificial chromosome (BAC) clone DNA was prepared using the Qiagen Large-Construct Kit (Qiagen GmbH, Hilden, Germany). Two micrograms of BAC DNA was labeled with digoxigenin-11-dUTP by nick translation for 150 minutes at 15°C using standard methods. The probe was checked using standard gel electrophoresis to ensure that approximately 200 to 400 bp was optimally labeled, and purified using the PCR purification kit (Qiagen GmbH), which enabled equilibration in 50 mmol/L Tris, pH 7.5, 1 mmol/L EDTA, and 0.1% SDS. The probe was mixed with human Cot-1 DNA (Invitrogen Corp., Carlsbad, CA), denatured at 75°C for 5 minutes, and directly transferred to ice. The dewaxed slides stored in 70% ethanol were washed six times with tap water at room temperature, denatured in 70% highly deionized formamide (American Bioanalytical, Inc., Natick, MA) and 2× standard saline citrate (SSC), pH 5, for 10 minutes. These slides were transferred to 70% ethanol and subjected to gradual washes with 100% ethanol. Slides were dried at 37°C before applying the probe to the center of the slide, which was then sealed with a coverslip and rubber cement, followed by overnight incubation at 37°C in a humid chamber. The next day, the slides were washed three times with 50% formamide in 2× SSC, pH 7.0, at 45°C for 5 minutes each, then in 0.1× SSC at 60°C three times each for 5 minutes. Slides were rinsed in 2× SSC, blocked in 4× SSC/5% bovine serum albumin for 30 minutes at 37°C, and incubated with the primary antibody (sheep anti-digoxin; Abcam Inc.) for 2 hours at room temperature. Slides were washed three times with 4× SSC/0.1% Tween-20 at 37°C. The slides were blocked again in 4× SSC/5% bovine serum albumin for 30 minutes at 37°C, incubated with a secondary antibody [TRITC (tetramethyl rhodamine isothiocyanate)–rabbit anti-sheep; Jackson ImmunoResearch Laboratories, Inc., Bar Harbor, ME]. Washes and blockings were repeated, followed by a final signal amplification step by hybridizing with a tertiary antibody (TRITC–goat anti-sheep). Slides were finally washed three times with 4× SSC/0.1% Tween-20, air dried in the dark, and gently counterstained with DAPI (Dako Corp.). Images were captured using an Eclipse 80i microscopy system with bright field and fluorescence features, a Digital Sight DS-Ri1 high-resolution camera, and NIS-Elements BR software (all from Nikon Instruments Inc.).
DNA Sequence Mutation and Polymorphism Analysis
Fifty nanograms of genomic DNA was used in amplifying the coding regions in each of the 11 exons encompassing the NPAS3 gene in human glioma cell lines and human operative glioblastoma specimens, and the respective patient's blood DNA, using Platinum HiFi Taq polymerase (Invitrogen Corp.). Only exons identified as having a glioblastoma point mutation were further selected for polymorphic mutation studies using 50 ng blood genomic DNA from 50 healthy individuals, which was commercially obtained from the Human Random Control DNA panel (Sigma-Aldrich Corp.). The PCR primers and cycle conditions are given in Table 1. In brief, the PCR cycle was denaturation at 94°C for 5 minutes, followed by 35 cycles at 94°C for 30 seconds, annealing for 30 seconds at a temperature given in Table 1, and an extension at 68°C for a duration given in Table 1. A final extension of 5 minutes at 68°C was performed for each PCR reaction. PCR products were electrophoresed on 1% agarose gels, gel purified (Gel Extraction Kit; Qiagen GmbH), and sequenced using the forward and reverse primers that were used to produce each PCR product (Table 1). Chromatograms were analyzed using commercially available software (FinchTV, version1.4; Geospiza, Inc., Seattle, WA), and the sequences were subjected to alignment with wild-type sequence using FASTA (http://www.ebi.ac.uk/Tools/fasta33/index.html) to identify mutations. Specimens with an identified mutation were confirmed using re-sequencings.
Table 1.
Primers Used in Mutation Analyses of the Human NPAS3 Gene
| Primer | Forward primer | Reverse primer | Tm | PCR Product size (bp) | Extension time (seconds) |
|---|---|---|---|---|---|
| Ex1 | 5′-GGGGAGAGAGGCAAAAAGTA-3′ | 5′-GGTTCAATAAACAGAAAAGTGTT-3′ | 58 | 120 | 5 |
| Ex2 | 5′-CACATTCTCACTCCTTTGATT-3′ | 5′-CCTTTTACTGATGTGTTAGGTG-3′ | 55 | 271 | 5 |
| Ex3 | 5′-TTTTAAGTTATAGGTGCACAGC-3′ | 5′-AAGCTTCTTTTTGTTTTAAAGG-3′ | 55 | 115 | 5 |
| Ex4 | 5′-TATTCTTTTTCCTGCAGTCC-3′ | 5′-AGAATCTAAAATTGTTTTACTTACTTG-3′ | 55 | 131 | 5 |
| Ex5 | 5′-CCTTTCTCTCGCCCTCTA-3′ | 5′-GGTTTGCAATTCCCACCT-3′ | 55 | 210 | 5 |
| Ex6 | 5′-TGTCTGTATTTTTGTATTCCTCA-3′ | 5′-AACCGGCTTACCTTATATCC-3′ | 55 | 154 | 5 |
| Ex7 | 5′-CTGTACTTAATGTTGTTTTACAGG-3′ | 5′-GCAAATGAAAACAAAAAC-3′ | 55 | 242 | 5 |
| Ex8 | 5′-AGCCTGTGTTCTTCTCTTTG-3′ | 5′-CCACACAGGAGGTACTTACA-3′ | 55 | 149 | 5 |
| Ex9 | 5′-TTTCGCCAGTGCTGAATA-3′ | 5′-AATAGAAAAGAAGTAGAAAATATACCT-3′ | 55 | 182 | 5 |
| Ex10 | 5′-AGTGCCTCCCTTCCACAG-3′ | 5′-GAACATGGAAAAGAAGGAAT-3′ | 55 | 168 | 5 |
| Ex11-a | 5′-CCCCACACAGAGGACAAC-3′ | 5′-GTTTCCGCCTTTTCTTGC-3′ | 55 | 400 | 25 |
| Ex11-b | 5′-ACCAGAAGCGCAAGAAAA-3′ | 5′-GCGCCGAACTGAGTCTTG-3′ | 55 | 409 | 25 |
| Ex11-c | 5′-GCCCGCAAGACTCAGTTC-3′ | 5′-AACGGTCCTGACATGTTG-3′ | 55 | 479 | 25 |
| Ex11-d | 5′-ACATGTCAGGACCGTTCG-3′ | 5′-ACCTTAGAAGAAGACAAAACG-3′ | 55 | 407 | 25 |
Tm, melting temperature.
Methylation Assays
Approximately 250 ng genomic DNA isolated from randomly selected glioblastoma specimens in conjunction with three normal brain specimens were subjected to quantitative methylation analyses of the CpG island mapping on human chromosome 14 at nucleotides 32471845 to 32473830 using instructions specified with the Methyl-Profiler qPCR Primer Assay Kit for Human NPAS3 (SABiosciences Corp., Frederick, MD). The methylation status of this CpG island in specimens tested was assessed on undigested genomic DNA, genomic DNA digested with a methylation-sensitive restriction enzyme that digested unmethylated and partially methylated DNA, genomic DNA digested with a methylation-dependent enzyme that digested highly methylated DNA, and genomic DNA digested with both methylation-sensitive and methylation-dependent enzymes. The relative amounts of genomic DNA in the hypermethylated, hypomethylated, and unmethylated groups were quantified using real-time PCR as specified in the kit. All assays were performed in triplicate.
Loss of Heterozygosity Analysis
Fifty nanograms of genomic DNA isolated from glioblastoma specimens and patient blood were used to amplify single nucleotide polymorphism (SNP) genetic markers mapping within and flanking the NPAS3 gene. SNP markers were selected from the Ensembl database (http://www.ensembl.org) and the dbSNP database (http://www.ncbi.nlm.nih.gov/projects/SNP). The PCR primers are listed in Table 2. The PCR cycle used was 94°C for 5 minutes, 35 cycles of 94°C for 30 seconds, 58°C for 30 seconds, and 68°C for 30 seconds, followed by 68°C for 5 minutes. PCR products were electrophoresed on 1% agarose gels, gel purified (Qiagen Gel Extraction Kit), and sequenced using the forward and reverse primers that were used to produce each PCR product. Chromatograms were analyzed using FinchTV software (version 1.4; Geospiza, Inc.). All findings of loss of heterozygosity were confirmed by re-sequencings.
Table 2.
PCR Primers Used for Loss-of-Heterozygosity Analysis in a Panel of SNP Genetic Markers Mapping in and Flanking the NPAS3 Gene
| Primer | dbSNP ID | Forward primer | Reverse primer | PCR product size (bp) |
|---|---|---|---|---|
| SNP1 | rs36059107 | 5′-GGCATCATTGCCTGATTCTT-3′ | 5′-CCCTTTTTCTCCATCCACAA-3′ | 369 |
| SNP2 | rs61980341 | 5′-CCCACCCAAATCTCATCTTG-3′ | 5′-CTTTTCAGCAACACCCCACT-3′ | 369 |
| SNP3 | rs61974912 | 5′-GGGCCATAGATACCTCACGA-3′ | 5′-ATTTCCCAGTGCAAGAAAGC-3′ | 369 |
| SNP4 | rs8005131 | 5′-GGTATGAAAAACAAAGTGCCTGA-3′ | 5′-AGTGAACATCTACACCAACAGAAAA-3′ | 400 |
| SNP5 | rs56790127 | 5′-CCTTCTTTAGCCACGCTCAC-3′ | 5′-GGATGAGGCACCATCTGAGT-3′ | 382 |
| SNP6 | rs12433161 | 5′-AAGACCCTCCTCACCGAAAT-3′ | 5′-TTTGGACCATGATGACAAGG-3′ | 406 |
| SNP7 | rs10483431 | 5′-AGACATACAACCACAATACTTTCG-3′ | 5′-CACACATGGTGTCCCCCTAT-3′ | 403 |
| SNP8 | rs12432716 | 5′-CATAGTGACTCCCTACTGTCTACCC-3′ | 5′-AAAATGTTGCCACCACAATG-3′ | 406 |
| SNP9 | rs35370449 | 5′-TTGGTCCTCAAACACAATCCT-3′ | 5′-TGAAATAAACATGCATACACAAAA-3′ | 380 |
| SNP10 | rs10141860 | 5′-TTGGCATATGGGATGGAAAT-3′ | 5′-TGGGTTACTGGGTGTTCCTC-3′ | 400 |
| SNP11 | rs61974973 | 5′-GCCAGAAACCAACCTGAGTG-3′ | 5′-CCACTCTCCCACAATGGTCT-3′ | 400 |
| SNP12 | rs61974988 | 5′-CTGTCCCCCACCCATAAAAG-3′ | 5′-GGCAATTACTTTTGGTTTTTGC-3′ | 375 |
| SNP13 | rs60324856 | 5′-ATTCATCGATTCCCAACAGC-3′ | 5′-GCTCGCTGCTAGAACATGC-3′ | 387 |
| SNP14 | rs1958055 | 5′-AAGTCCTTGGCACTTGATGG-3′ | 5′-TGGGGATTATGGGAGCTACA-3′ | 442 |
| SNP15 | rs2297118 | 5′-GTCTCCAGTGGTTTGCTTCC-3′ | 5′-TTTCCATTTTGCTGGCCTTA-3′ | 402 |
| SNP16 | rs28658465 | 5′-TGGGTTGTTTTGCTTTCCTT-3′ | 5′-CATTCTAGTCACAGGCCAGAAA-3′ | 372 |
| SNP17 | rs8019077 | 5′-TGCAGCTCAGTGCTCAACTT-3′ | 5′-ACAACCACGAGACCCATGAT-3′ | 404 |
| SNP18 | rs1055762 | 5′-TCTAACTGAGGCTAATTTTGCAACT-3′ | 5′-TGGTTTCAACCCAGAAATAAGAA-3′ | 181 |
| SNP19 | rs60260386 | 5′-CCTGTGAAGACTGTGTCTGTGTT-3′ | 5′-TGTGACATGTATGAGAATCTACAAAA-3′ | 359 |
| SNP20 | rs61973028 | 5′-CGCAGGTGCCATTTTCATA-3′ | 5′-GCCCATTGTTCAGCTTTGAT-3′ | 350 |
Engineering NPAS3 Knockdown, Re-Expression, or Overexpression in Astrocyte and Glioma Cell Lines
A NPAS3 cDNA plasmid from the Dana Farber/Harvard Cancer Center DNA Resource Core (Harvard Medical School, Cambridge, MA) was subcloned into pcDNA3.1 (+) using standard methods. This plasmid was subsequently mutated with respective glioblastoma patient mutations using the Quick Change II Site-Directed Mutagenesis Kit (Agilent Technologies, Inc., Santa Clara, CA) and with oligomers given in Table 3. The PCR cycle used was 95°C for 1 minute, 18 cycles at 95°C for 50 seconds, 60°C for 50 seconds, and 68°C for 5 minutes, followed by 68°C for 7 minutes. NPAS3 short hairpin RNA (shRNA) plasmids cloned into the psiLV-U6 vector were obtained from GeneCopoeia, Inc. (Rockville, MD). The NPAS3 shRNA 1 plasmid targeted 5′-CCACTGACAACACTCTTGA-3′ of exon 5, and the NPAS3 shRNA 2 plasmid targeted 5′-CGGTGTGCACATCAAATCA-3′ of exon 6. Control plasmids used in this study included a scrambled shRNA plasmid (Addgene Inc., Cambridge, MA) and the pcDNA3.1 (+) vector. Astrocyte and glioma cell lines were transfected using lipofectamine 2000 (Invitrogen Corp.) and with the various plasmids used in the study. Stable clones that expressed scrambled shRNAs or NPAS3 shRNAs were selected with 2 μg/mL puromycin, and the other plasmids were selected for stable clones using 450 μg/mL G418 (both from Invitrogen Corp.).
Table 3.
Oligomers Used for Site-Directed Mutagenesis on the Human NPAS3 Gene
| Primer | Sense | Antisense |
|---|---|---|
| GBM1 | 5′-GGGAAAAGAAAACTATGAGTTCTATGAATTGG-3′' | 5′-CCAATTCATAGAACTCATAGTTTTCTTTTCCC-3′ |
| GBM2 | 5′-GGGGGACCCTCCGGGGAACTTGCGAATGGAAGG-3′ | 5′-CCTTCCATTCGCAAGTTCCCCGGAGGGTCCCCC-3′ |
| GBM3 | 5′-GACAGGCAGCAGTGTCTTTTGACTATGTCCACCCCGGAG-3′ | 5′-CTCCGGGGTGGACATAGTCAAAAGACACTGCTGCCTGTC-3′ |
Standard and Quantitative RT-PCR Analysis
Total RNA was extracted from normal brain, glioma specimens, and the cell lines NHA-TERT and knocked down for expression of NPAS3 using the RNeasy Mini Kit (Qiagen Corp.). Two micrograms of total RNA was subjected to cDNA synthesis using the One-Step RT-PCR Kit (Invitrogen Corp.) in 20-μL reactions. The final reaction product was increased in volume to 200 μL using double-distilled water. Two microliters was used for subsequent standard or real-time PCR. For standard RT-PCR, the β-actin gene was used as a control with the following primers: forward, 5′-AGGTGACAGCATTGCTTCTG-3′; and reverse, 5′-CCTGGGCCATTCAGAAATTA-3′. Real-time RT-PCR analyses in search of genes regulated by NPAS3 in NHA-TERT were accomplished using the Pathway Finder PCR Arrays (SABiosciences Corp.). Each reaction was set up in triplicate with 96-well microtiter plates using the SsoFast Evagreen PCR SYBR Green Kit (Applied Biosystems, Inc., Foster City, CA). The PCR cycle was 94°C for 4 minutes, 94°C for 20 seconds, and 55°C for 20 seconds, followed by 72°C for 5 seconds for 40 cycles and was performed using a CFX-96 Real-Time PCR Machine (BioRad Laboratories, Inc., Hercules, CA). Relative changes in expression were determined by differences in the CT values of the test gene verses control genes (HPRT and β-actin).
Cell Cycle Assay
Cells were harvested and resuspended in 50 μL PBS or HBSS plus 2% FCS, followed by fixing in 1 mL 80% ice-cold ethanol for 30 minutes. Subsequently, the cells were treated in 50 μg propidium iodide in 0.6% NP-40 plus 100 mg RNase A for 30 minutes at room temperature before filtering through 85-μm Nitex meshes. The cells were subjected to flow cytometry using a FACScan machine, and the data were analyzed using Cell Quest Pro software (both from BD Biosciences). G1 cell cycle assays were also undertaken using a normal human immortalized astrocyte culture transiently transfected within 48 hours with the pcDNA3.1 vector plasmid, wild-type NPAS3:pcDNA3.1 plasmid, or NPAS3 mutant variants. In general, all cell cycle assays were performed in triplicate, and the data are given as mean ± SEM. Statistical analysis was performed using the unpaired two-tailed Student's t-test. P < 0.05 was considered statistically significant.
MTS Assay
About 5000 cells in 100 μL DMEM with 10% FCS were plated in 96-well plates and grown over 6 days at 37°C in 5% CO2. Cell viability or proliferation was evaluated at days 0, 2, 4, and 6 using the MTS [3-(4,5-dimethylthiazol-2yl)-5-(3-carboxymethoxyphenyl)-2-(4-sulfophenyl)-2H-tetrazolium] assay (Promega Corp., Madison, WI) in accordance with the manufacturer's instructions. Assays were performed in triplicate. Statistical analysis was performed using the unpaired two-tailed Student's t-test. P < 0.05 was considered significant.
Caspase 3/7 Assay
Approximately 5000 cells in 100 μL DMEM with 10% FCS were plated in 96-well plates and subjected to Caspase 3/7 assays (Promega Corp.) in accordance with the manufacturer's instructions. In parallel experiments, cells were also treated with 10 μmol/L camptothecin (Sigma-Aldrich Corp.) for 1 hour before Caspase 3/7 assays. Assays were performed in triplicate. Statistical analysis was performed using the unpaired two-tailed Student's t-test. P < 0.05 was considered significant.
Endothelial Cell Viability or Proliferation Assay
Conditioned DMEM with 10% FCS (ATCC) was harvested from the supernatants of the panel of engineered and parental glioma and astrocyte cell lines after growing cells for 3 days at 37°C in 5% CO2. The conditioned media supplemented with additional 10% FCS (Invitrogen Corp.) were used to grow a human umbilical vascular endothelial cell line (HUVEC) (ATCC). The viability or proliferation of HUVEC cells was evaluated over 6 days using the MTS assay, as described above. All assays were performed in triplicate. Data are given as mean ± SEM. Statistical analysis was performed using unpaired two-tailed Student's t-test.
Invasion Assays
Approximately 0.6 × 10⁶ cells were grown for 48 hours in migration and invasion chambers as specified by the CytoSelect Cell Invasion assay fluorometric kit (Cell Biolabs Inc, San Diego, CA). The invasion index of all datasets from engineered cell lines was normalized to the respective relative fluorescence unit values of the parental cell lines. The normalized invasion index of each parental cell line was set at a value of 1. All assays were performed in triplicate. Data are given as mean ± SEM. Statistical analysis was performed using unpaired two-tailed Student's t-test.
Soft Agarose Assays
Standard soft agarose assays were performed on 7000 cells grown in 12-well plates, with the bottom layer having 0.5% agarose and the top layer of cells suspended in a final concentration of 0.35% low-melting-point agarose (Invitrogen Corp.). Anchorage-independent growth assays were performed over 21 days by incubating the cells at 37°C in 5% CO2. Colonies were stained with 0.005% crystal violet (Sigma-Aldrich Corp.) and scored using an inverted microscope. All assays were performed in triplicate. Data are given as mean ± SEM. Statistical analysis was performed using the unpaired two-tailed Student's t-test. P < 0.05 was considered significant.
In Vivo Tumor Growth Assays
Approximately 1 × 10⁶ cells were stereotactically delivered into the frontal lobe of NOD-SCID mice. All mice were sacrificed at 3 months after injection (study end point) or earlier depending on the presence of neurologic symptoms. Ten NOD-SCID mice were studied per engineered glioma cell line examined, and 20 NOD-SCID mice were studied per engineered human astrocyte cell line examined. Mouse brains were harvested, fixed in 10% buffered formalin, and embedded in paraffin. Standard IHC and neuropathologic analyses were performed using 10-μmol/L sections. Comparative size estimates of tumors induced from the different groups of engineered glioma cell lines were determined using NIS Elements BR 3.10 software (Nikon Instruments Inc.). For a given tumor mass, the summed areas were multiplied by the sum of section thickness and intersection gap (4 mm) to obtain an estimate of the total tumor volume (in millimeters cubed).
Overall Survival Analyses
Overall survival curves were constructed using the Kaplan-Meier method, and the log-rank test was subsequently used to assess differences between curves, followed by pairwise multiple comparison using the Bonferroni multiple-comparison method when appropriate.24,25 The 95% confidence interval for survival probability was estimated using the complementary log-log transform method.26 Univariate Cox regression analysis was used to assess the association between individual patient characteristics (gene expression, age, and sex) and the survival end point. The multivariable Cox proportional hazards regression model was used to assess the association between gene expression and overall survival time, controlling for potential confounding variables such as age and sex. Unadjusted and adjusted hazard ratios and their 95% confidence intervals were reported. Proportional hazard assumption was checked using the Kolmogorov-type supremum test based on 1000 simulated replications.27 For comparisons of glioma cell line genotypes, because of the relatively small sample size (n = 10 per genotype), exact permutation-based P values of the log-rank test were calculated to validate the conventional asymptotic log-rank test.25,26 All statistical analyses were performed using commercially available software (SAS version 9.2; SAS Institute Inc., Cary, NC).26 All P values were two-sided. P < 0.05 was considered statistically significant.
Results
Loss of NPAS3 Expression Is Associated with Highly Proliferative Malignant Astrocytomas in Humans
During the initial cloning and characterization of NPAS3, it was determined that NPAS3 is ubiquitously expressed in both fetal and adult human brains.14 Using IHC and immunofluorescent cytochemistry, NPAS3 expression was demonstrated in several cell types of the human nervous system including as a nuclear protein in nontransformed astrocytes (see Supplemental Figures S1 and S2 at http://ajp.amjpathol.org). In keeping with genomic data from the Cancer Genome Project that demonstrated aneuploidies of human chromosome 14 with NPAS3 in as many as 80% of astrocytomas,2–9 IHC prescreening for candidate genes for astrocytoma identified greater than 70% of surgically resected astrocytoma specimens (n = 433) with aberrant NPAS3 expression (Figure 1A). It was discovered that while NPAS3 was expressed as a nuclear protein in nontransformed human astrocytes (see Supplemental Figures S1 and S2 at http://ajp.amjpathol.org), absence or reduction in NPAS3 expression was evident in 52% to 54% of high-grade (grades III and IV) astrocytomas, as compared with only 11% to 20% of low-grade (grades I and II) astrocytomas (Figure 1A). Specimens with absent NPAS3 expression were substantially more common than those with approximately 50% reduced expression (Figure 1A). Furthermore, approximately 75% of tested secondary glioblastomas (determined from the clinical history) demonstrated absent NPAS3 expression (Figure 1A). Overall, the tumor panel documented no cytoplasmic patterns of NPAS3 expression; rather, 7% to 8% of grades I and II astrocytomas and 28% to 30% of grades III and IV astrocytomas with increased NPAS3 expression were identified (Figure 1A). Most remarkable, absence of NPAS3 expression in glioblastomas correlated with the highest proliferative index, which was determined using the percentage of nuclei positive for Ki-67 (MIB1) expression (Figure 1B). To further investigate the clinical significance of NPAS3 expression in glioblastomas, the overall survival of 77 patients from the panel of 275 specimens was examined (see Supplemental Figure S3 at http://ajp.amjpathol.org). These 77 surgically resected glioblastomas were selected in a nonbiased manner from patients in whom sufficient clinical history data were available to perform overall survival studies. In addition, overall survival studies were performed on three patterns of NPAS3 expression (normal, absent, and elevated) in glioblastomas because functional studies described hereafter identified significant differences in the effects on the three patterns of NPAS3 expression and on the progressive growth of gliomas. From this study, patients with glioblastomas that exhibited absent NPAS3 expression were identified as having the poorest overall survival in comparison with patients with glioblastomas that demonstrated normal or increased NPAS3 expression (P < 0.001, log-rank test) (see Supplemental Figure S3 at http://ajp.amjpathol.org). However, no significant difference was noted in overall survival in patients with glioblastomas that demonstrated either normal or increased NPAS3 expression (P > 0.05, long-rank test) (see Supplemental Figure S3 at http://ajp.amjpathol.org). Collectively, these findings of aberrant and, in particular, absent NPAS3 expression in high-grade astrocytomas (including secondary glioblastomas) in comparison with low-grade astrocytomas are similar to the expression patterns of late-stage acting tumor progression factors. Of clinical importance, absence of NPAS3 expression in glioblastomas correlates well as a negative prognostication marker for survival.
Figure 1.
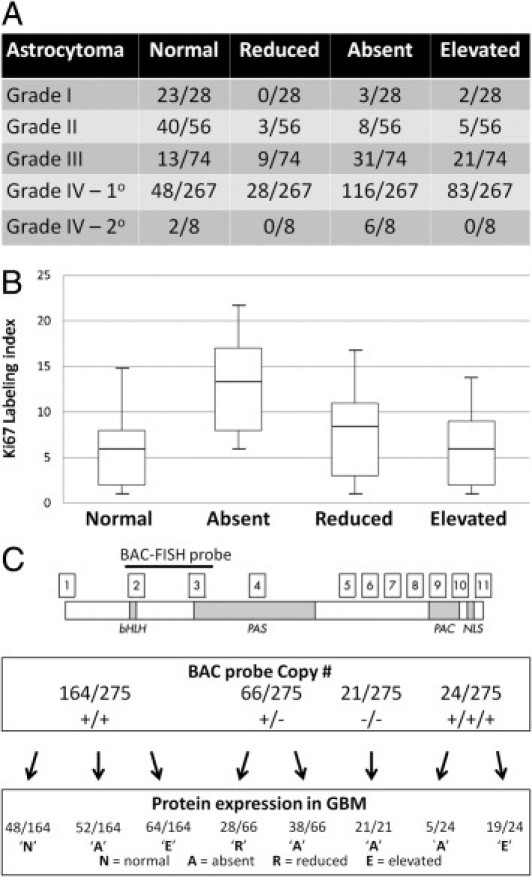
Expression and copy number mutation analyses of NPAS3. A: Using IHC, four patterns of NPAS3 protein expression are identified in 433 surgically resected astrocytomas (grades 1 to 4), with predominant aberrant expression (mostly absent expression) in high-grade astrocytomas (grades 3 and 4) and secondary glioblastomas. Examples of patterns of NPAS3 expression are shown in Supplemental Figure S3 (available at http://ajp.amjpathol.org). B: Box-and-whisker plots demonstrate expression index of Ki-67 (MIB1) in four categories of NPAS3 expression noted in glioblastomas. C: Standard FISH analysis of 275 glioblastomas with an RPMI-66M11 BAC FISH probe that spans exons 2 and 3 of NPAS3 identified four patterns of FISH signals, which correlated with aberrant NPAS3 protein expression in the glioblastoma panel. Examples of FISH signals are shown in Supplemental Figure S2 (available at http://ajp.amjpathol.org).
Glioblastomas Demonstrate Loss-of-Function Mutations Associated with Loss of Heterozygosity
Because aberrant NPAS3 protein expression is predominant in high-grade astrocytomas (Figures 1A; see also Supplemental Figure S2 at http://ajp.amjpathol.org), molecular genetic mutation studies were performed to discern potential causes for these expression patterns. Only glioblastomas (n = 275) from the human tumor panel were analyzed, with focus on the most clinically severe tumor type compared with astrocytic tumors of lower grades. The standard FISH method was used to first screen this tumor panel with a BAC probe of approximately 120 kb (Figure 1C; see also Supplemental Figure S4 at http://ajp.amjpathol.org). The BAC probe spanned exons 2 and 3, which encode the basic helix-loop-helix DNA binding domain and PAS dimerization domain, regions critical to mediate the function of NPAS3 and are recognized by the antibody used for IHC screening in the present study. Deletion of this interval, such as exon 2, is thought to be a loss-of-function mutation (Figure 2C). While 21 of the glioblastomas with deletions of both copies of the BAC probe exhibited absent NPAS3 protein expression (Figure 1C), specimens with one and two copies, and even three copies, of this probe also demonstrated absent NPAS3 expression (Figure 1C). Among these latter specimens tested, a subset demonstrated hypermethylation of the NPAS3 gene, which may potentially explain the absent protein and RNA expression (see Supplemental Table S1 at http://ajp.amjpathol.org). In addition, the possibility of a mutation that affects the binding of the NPAS3 antibody is an alternative explanation for such expression patterns of NPAS3. In 28 of 66 glioblastomas with one copy of the BAC probe, NPAS3 expression was decreased by approximately 50% (Figure 1C), whereas in 64 glioblastomas with two copies and 19 glioblastomas with three copies of the BAC probe, NPAS3 expression was increased (Figure 1C). Overall, glioblastomas with normal, reduced, or increased NPAS3 protein and RNA expression were not hypermethylated within NPAS3 (see Supplemental Table S1 at http://ajp.amjpathol.org).
Figure 2.
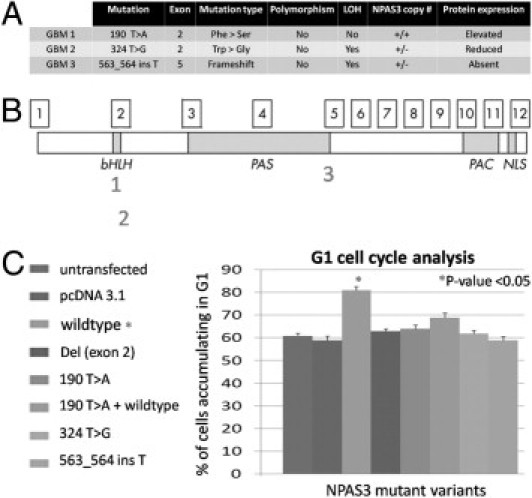
NPAS3 DNA sequence mutation analyses in glioblastomas. A: Three glioblastomas with point mutations that correlated with aberrant NPAS3 protein expression and with either one or two copies of the NPAS3 RPMI-66M11 BAC FISH probe were identified. Chromatograms are shown in Supplemental Figure S5 (available at http://ajp.amjpathol.org). B: Map positions of mutations on the NPAS3 protein. C: Functional assays on the glioblastoma mutations using G1 cell cycle analysis on an immortalized human astrocyte cell line.
In addition to analyzing the glioblastomas for large DNA mutations (deletions or amplifications), NPAS3 also was investigated to identify point mutations by sequencing all exons encompassing the protein-coding regions of the gene. Three glioblastomas demonstrated point mutations in exons 2 and 5 of NPAS3 (Figure 2, A and B; see also Supplemental Figure S5 at http://ajp.amjpathol.org). These mutations seemed to be nonpolymorphic based on their absence in 100 chromosomes from the DNA of 50 healthy subjects (Figures 2A; see also Supplemental Figure S5 at http://ajp.amjpathol.org). In addition, two patient glioblastoma mutations were identified with a loss of heterozygosity of the NPAS3 locus, after genotyping the glioblastoma DNA and patient blood DNA with a panel of 20 SNP markers mapping within and flanking the NPAS3 locus (see Supplemental Figure S6 at http://ajp.amjpathol.org). Inasmuch as NPAS3 expression modulates the cell cycle of a human astrocyte cell line (described hereafter), functional assays were performed on the glioblastoma NPAS3 mutations using G1 cell cycle assays (Figure 2C). All three NPAS3 protein isoforms encoding patient glioblastoma mutations were identified as nonfunctional, rendering human astrocytes unable to accumulate in the G1 phase, in comparison with the wild-type NPAS3 protein. One of these loss-of-function mutations demonstrated a frameshift point mutation in exon 5 (Figure 2A) that correlated with absent NPAS3 protein expression in the glioblastoma, possibly as a consequence of non-sense mediated RNA decay.28 Furthermore, another substitution mutation was identified in exon 2 and correlated with reduced NPAS3 expression in the glioblastoma with one copy of the BAC FISH probe (Figure 2A). The tryptophan to glycine amino acid substitution in NPAS3 resulted in an expressed but nonfunctional protein (Figure 2A), possibly as a consequence of structural changes in the DNA binding domain. One glioblastoma specimen (GBM1) with no loss of heterozygosity of NPAS3 identified from the panel of SNP markers (see Supplemental Figure S6 at http://ajp.amjpathol.org) demonstrated a heterozygous mutation in exon 2 that correlated with increased protein expression (Figure 2A). This mutation was a phenylalanine to serine substitution and resulted in a nonfunctional protein (Figure 2C), possibly as a consequence of structural changes within the DNA binding domain. Furthermore, this heterozygous mutation exhibited a dominant-negative effect because the co-expression of the wild-type NPAS3 protein with the NPAS3 mutant variant did not induce cells to accumulate in the G1 phase (Figure 2C). From this observation, it was postulated that some glioblastomas with increased NPAS3 protein expression identified (Figures 1A; see also Supplemental Figure S2 at http://ajp.amjpathol.org) may also harbor dominant-negative loss-of-function mutations. In those glioblastomas with unidentified mutations, the possibility of mutations elsewhere in the gene or genome cannot be excluded using our methods. This may involve mechanisms such as hypermethylation or epigenetic silencing,29 as identified in the panel of glioblastomas (see Supplemental Table S1 at http://ajp.amjpathol.org). Large numbers of loss-of-function nonpolymorphic mutations have been identified in NPAS3 that are associated with loss of heterozygosity in glioblastomas; a similarity found in tumor-suppressor genes.
NPAS3 Expression Affects Transformation of Human Malignant Glioma Cell Lines
Discovery of predominant aberrant NPAS3 expression in surgically resected human astrocytoma specimens associated with loss-of-function mutations prompted investigation of NPAS3 expression in human malignant glioma cell lines. Using Western blot analysis, absence of NPAS3 protein expression was identified in two of four malignant human glioma cell lines (Figure 3A, left panel). No mutations in the coding regions of the gene were identified in the four glioma cell lines. Next investigated was the targeted effects of stable and constitutive knockdown, overexpression, and re-expression of NPAS3 in the U343 (with NPAS3 not endogenously expressed) and U118 (with NPAS3 endogenously expressed) cell lines (Figure 3A, right panel). It was noted that a constitutively re-expressed or overexpressed NPAS3 in the U343 and U118 glioma cell lines (Figure 3A, right panel) promoted significant (P < 0.01) decreases in proliferation (Figure 3B), with substantial cell accumulation in the G1 and sub-G1 cell cycle phases but with decreases in the S phase (Figure 3D). To confirm these cell cycle findings, significant increases were identified in apoptosis even in the presence of a camptothecin apoptosis inducer (Figure 3C) when NPAS3 expression was increased in U118 and U343. Compared with other cell lines, parental U118 and U343 cell lines demonstrate relatively low migratory/invasive properties. Increased NPAS3 expression in both of these cell lines still did not induce changes in the migratory/invasive properties in vitro (see Supplemental Figure S7A at http://ajp.amjpathol.org). However, conditioned media harvested from these cell lines with increased NPAS3 expression led to a significant (P < 0.01) reduction in the in vitro viability of a HUVEC cell line (see Supplemental Figure S8A at http://ajp.amjpathol.org). Finally studied were the effects of NPAS3 expression on the transformation of glioma cell lines. In U343 and U118, when NPAS3 expression was increased, significant (P < 0.01) reduction in anchorage-independent growth in soft agarose (Figure 3E) and in vivo intracranial tumor growth in NOD-SCID mice (n = 10 of 10 mice tested for each engineered cell type) were observed (Figure 3F). Overall, tumors were reduced by greater than 70% (Figure 3F), which resulted in NOD-SCID mice surviving significantly longer over a 3-month study end point (Figure 3G).
Figure 3.
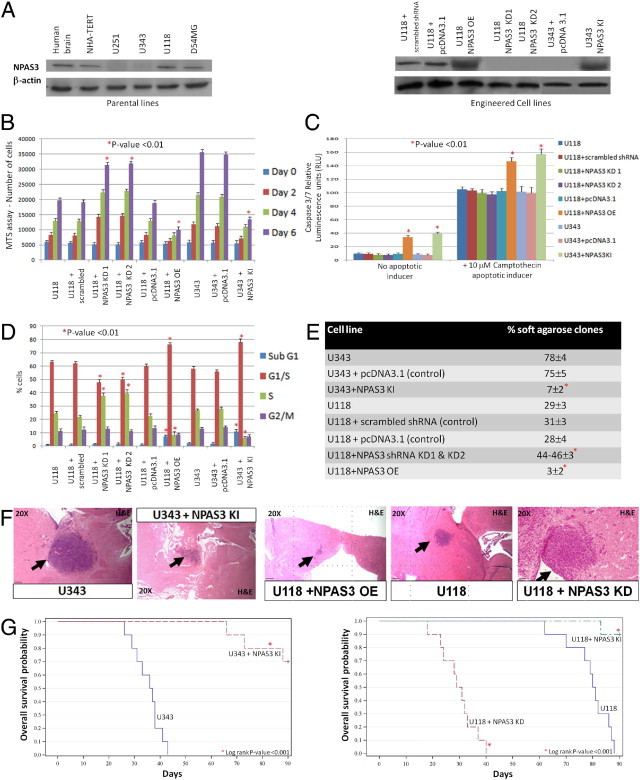
Functional evaluation of NPAS3 protein expression in human malignant glioma cell lines. A: Left panel, Western blot analysis using a panel of glioma cell lines and a β-actin–positive control. Right panel. Protein expression levels of NPAS3 in engineered U343 and U118 glioma cell lines and with the NPAS3 shRNA plasmids targeting exons 5 and 6. B: MTS assays (performed in triplicate) performed over 6 days. C: Caspase 3/7 apoptosis assays (performed in triplicate) in the presence of camptothecin apoptotic inducer. D: FACS analysis (performed in triplicate) using cells stained with propidium iodide. E: Anchorage-independent growth assays in agarose over 21 days. F: Stable re-expressed or overexpressed NPAS3 in U118 and U343 significantly decreased in vivo intracranial tumor dimensions in NOD-SCID mice (n = 10 of 10) by greater than 70%, whereas the converse stable knockdown NPAS3 expression induced more aggressive hyperproliferative, vascularized, invasive in vivo intracranial anaplastic astrocytomas in NOD-SCID mice (n = 10 of 10). All images were captured from brains harvested at 1 month after injection. G: Kaplan-Meirer survival plots demonstrate that stable elevated expression of NPAS3 in U343 and U118 significantly improved overall survival in NOD-SCID mice harboring intracranial growth of these cells, whereas the converse stable knockdown NPAS3 expression in U118 significantly resulted in poorer overall survival of NOD-SCID mice. The study end point was 3 months after injection, with 10 mice per group of engineered glioma cell lines tested.
In converse experiments, stable and constitutive knockdown NPAS3 expression with two independent sets of shRNAs (efficiency >80%; Figure 3A, right panel) significantly (P < 0.01) augmented proliferation of the U118 glioma cell line (Figure 3B) and resulted in a decrease in cells accumulating in the G1 cell cycle phase and accompanied by an increase in cells in the S phase (Figure 3D) but with no change in apoptosis (Figure 3C). Compared with the parental cell lines, these cells also demonstrated increased (P < 0.05) in vitro migratory/invasive properties (see Supplemental Figure S7A at http://ajp.amjpathol.org). In addition, conditioned media harvested from these engineered cells induced an increase (P < 0.05) in the in vitro viability of a HUVEC cell line (see Supplemental Figure S8A at http://ajp.amjpathol.org). Finally, constitutive knockdown NPAS3 expression in the U118 glioma cell line (>80% efficiency; Figure 3A, right panel) significantly (P < 0.01) increased anchorage-independent growth in soft agarose (Figure 3E) and further induced more aggressive hyperproliferative, vascularized, and invasive in vivo intracranial tumor growth, resulting in a significant decrease in overall survival of NOD-SCID mice over a 3-month study end point (n = 10 of 10 mice tested for each engineered cell type) (Figure 3, F and G). Collectively, the data suggest that NPAS3 expression can modify the transformation potential of glioma cell lines. Thus, loss of NPAS3 expression induces more aggressive growth in vitro and in vivo, whereas the converse increased expression suppresses growth, properties inherent in tumor-suppressor genes.
NPAS3 Acts as a Tumor-Suppressive Progression Factor to Induce Transformation of Astrocytes in Humans
After NPAS3 was identified as a nuclear protein in nontransformed astrocytes (see Supplemental Figure S1 at http://ajp.amjpathol.org) but with predominant aberrant expression in high-grade astrocytomas (Figures 1A; see also Supplemental Figure S2 at http://ajp.amjpathol.org), the influence of NPAS3 expression in the transformation of astrocytes in humans fewer than five passages was examined. The well-characterized human fetal astrocyte cell line model immortalized with telomerase,30,31 denoted herein as NHA-TERT, was used rather than human primary astrocyte cultures, which pose problems because senescence occurs by 20 days in culture. NHA-TERT, which is genetically stable and unable to transform by itself, is a superb model for study of genetic interactions that can induce pathologic variants of astrocytomas.30,31 It was observed that stable knockdown NPAS3 expression (efficiency >80%; Figure 4A) alone in the parental astrocyte cell line (NHA-TERT), did not significantly (P > 0.05) change proliferation, apoptosis, migration/invasion, or even cell cycle phases (Figures 4, B–D; see also Supplemental Figure S7B at http://ajp.amjpathol.org). Further, it could not induce either in vitro transformation in soft-agarose (Figure 4E) or in vivo tumor growth in NOD-SCID mice (n = 20 of 20 mice tested). Conditioned media harvested from this cell line, however, induced an increase (P < 0.05) in the in vitro viability of a HUVEC cell line (see Supplemental Figure S8B at http://ajp.amjpathol.org).
Figure 4.
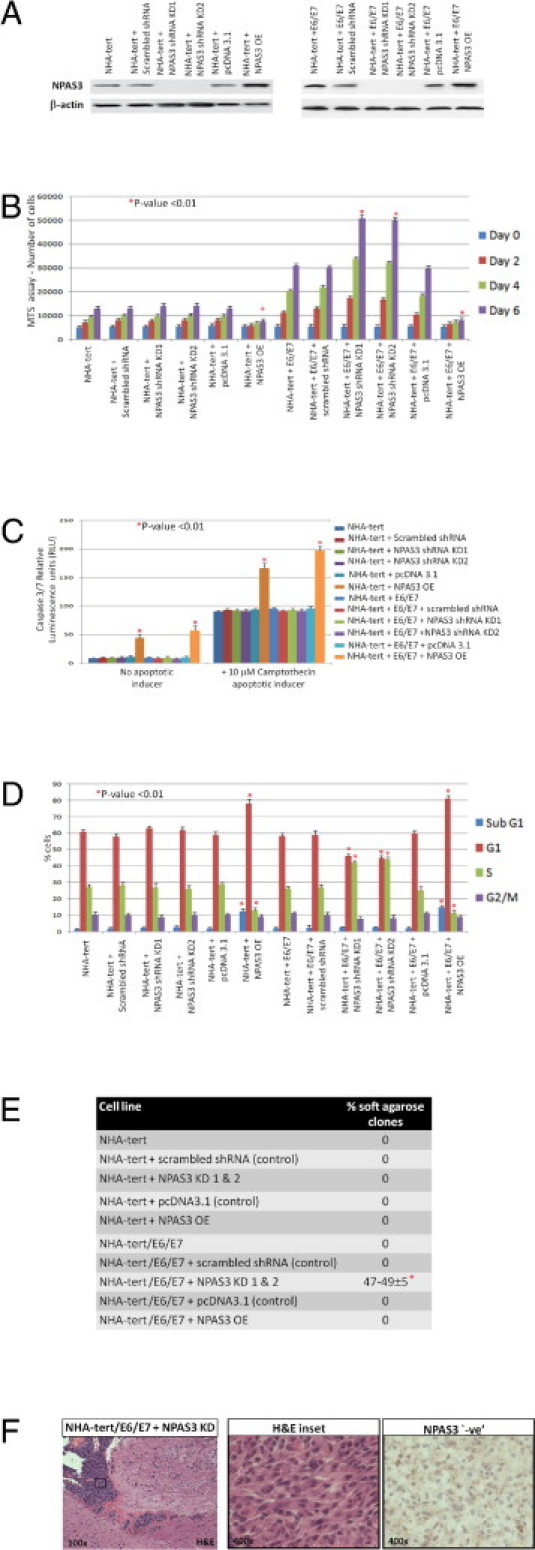
Functional evaluation of NPAS3 expression in human astrocytes. A: Western blot analysis of NPAS3 expression in a panel of engineered astrocyte cell lines, with β-actin as a positive control, and with the NPAS3 shRNA plasmids targeting exons 5 and 6. B: MTS assays (performed in triplicate) over 6 days. C: Caspase 3/7 apoptosis assays (performed in triplicate) in the presence of camptothecin apoptotic inducer. D: FACS analysis (performed in triplicate) with cells stained with propidium iodide. E: Anchorage-independent growth assays in agarose over 21 days. F: Stable knockdown NPAS3 expression induced in vivo intracranial growth of only NHA-TERT/E6/E7 cells in NOD-SCID mice (n = 4 of 20) at approximately 2½ months after injection (3-month study end point) in tumors reminiscent of anaplastic astrocytomas that demonstrated absent NPAS3 expression and pathologic features including nuclear atypia, high mitotic index, vascularity, and invasiveness.
NPAS3, however, acts as a tumor-suppressive progression factor to drive transformation only in the presence of other genes predisposed to gliomagenesis. Thus, a stable knockdown NPAS3 with two independent sets of shRNA (efficiency >80%; Figure 4A), in concert with the human papillomavirus E6 and E7 oncogenes, which inhibit the pRB and p53 signaling pathways,30,31 promoted a significant (P < 0.01) increase in proliferation (Figure 4B), resulting in no decrease in cells accumulating in the G1 phase but in the S phase (Figure 4D) and no change in apoptosis (Figure 4, C and D). These cells also demonstrated a significant (P < 0.05) increase in their in vitro migratory/invasive properties (see Supplemental Figure S7B at http://ajp.amjpathol.org). Moreover, conditioned media harvested from these cells significantly (P < 0.05) improved the in vitro viability of a HUVEC cell line (see Supplemental Figure S8B at http://ajp.amjpathol.org). Furthermore, knockdown NPAS3 expression in NHA-TERT/E6/E7 induced transformation in soft agarose (Figure 4E) and promoted the growth of tumors similar to anaplastic astrocytomas in NOD-SCID mice (n = 4 of 20) by 2.5 months (Figure 4F).
In the converse experiments, stable overexpressed NPAS3 in NHA-TERT and NHA-TERT/E6/E7 (Figure 4A) promoted significant (P < 0.01) decreases in proliferation (Figure 4B), with cells accumulating in the G1 and sub-G1 cell cycle phases (Figure 4D) but with decreases in the S phase (Figure 4D). An increase in cells of the sub-G1 phase (Figure 4D) was confirmed using caspase 3/7 assays, which demonstrated a significant increase in apoptosis even in the presence of the apoptosis inducer camptothecin (Figure 4C). Both the parental NHA-TERT and NHA-TERT/E6/E7 cell lines are relatively noninvasive. Elevated NPAS3 expression in these two cell lines did not further modify the in vitro invasive/migratory properties (see Supplemental Figure S7B at http://ajp.amjpathol.org). However, conditioned media harvested from both cell lines with increased NPAS3 expression induced a decrease in the in vitro viability of a HUVEC cell line (see Supplemental Figure S8B at http://ajp.amjpathol.org). Finally, NHA-TERT and NHA-TERT/E6/E7 with elevated NPAS3 expression were overall unable to grow in soft agarose (Figure 4E) and even in vivo in NOD-SCID mice (n = 20 of 20) over the 3-month study end point.
To understand the mechanism by which NPAS3 drives transformation in astrocytes via regulated genes, a candidate gene approach was used, with Cancer PathwayFinder PCR arrays (SABiosciences Corp.) (see Supplemental Table S2 at http://ajp.amjpathol.org). The expression of genes regulated by NPAS3 was discerned by comparing genes being differentially expressed using real-time RT-PCR analyses in the NHA-TERT cell line with and without NPAS3 expression. After examining approximately 82 genes involved in distinct cancer pathways, loss of NPAS3 expression in NHA-TERT identified 6 genes with significantly decreased expression and another 19 genes with significantly increased expression (see Supplemental Table S2 at http://ajp.amjpathol.org). The six genes with decreased expression were CDKN1A(p21Waf1), CDKN2A(p16Ink4), CASP8, FAS, TNFRSF1A, and NME1. These genes regulate processes such as the cell cycle, cell death, and cell migration/invasion. The 19 genes with increased expression were ATM, CDC25A, AKT1, ERBB2, JUN, MYC, ITGA1, ITGA2, ITGA3, ITGB3, ITGB5, MCAM, FGFR2, VEGFA, MET, MMP1, MMP2, MTA1, and PLAUR. These genes regulate processes such as the cell cycle, cell migration/invasion, angiogenesis, and intracellular growth factor signal transduction pathways. Collectively, the data suggest that NPAS3 expression can modify the transformation potential of human astrocytes as a tumor-suppressive progression factor and by perturbing the expression of genes in key cancer-signaling pathways.
Discussion
To understand the role of NPAS3 in diseases in humans after the initial cloning of this gene,13 there is evidence to support the role of NPAS3 in an acquired disease, namely, malignant astrocytoma. In addition, no previous studies, including those by our group,16,20 have yet demonstrated a strong link between NPAS3 with any congenital disease such as holoprosencephaly. The present study was initiated from a search for astrocytoma candidate genes using data derived from the Cancer Genome Project and pre-screenings of our panel of 433 surgically resected astrocytoma specimens. Thus, data from the Cancer Genome Project obtained from the analyses of astrocytoma specimens using SNP arrays, methylation arrays, cDNA microarrays, comparative genomic hybridization arrays, spectral karyotyping, and standard cytogenetic analysis initially demonstrated that as many as 80% of specimens had chromosome 14 deletions (including NPAS3 cytogenetic interval) and aberrant NPAS3 expression.2–9 Moreover, recently refined molecular classifications of glioblastomas using genomics-based methods have identified chromosome 14 deletions with NPAS3, which are common in the proneural subtype, followed by the mesenchymal and neural subtypes, but with none detected in the classic subtype.2 To further strengthen the link between NPAS3 and neoplasia, chromosome 14 deletion leading to expected loss of NPAS3 expression has also been reported in oligodendrogliomas, mixed gliomas, and nonglial tumors including esophageal, breast, prostate gland, and renal carcinomas, and melanomas,5,21–23 compared with normal control tissues. However, the functional role of NPAS3 in these cancers has yet to be determined.
To substantiate the role of NPAS3 in cancers in humans, the present study is the first to provide robust evidence that NPAS3 has functional features similar to those of a tumor suppresser, which drives late progression of human malignant astrocytomas. This is based on the following observations: i) absent NPAS3 expression was predominant in high-grade astrocytomas, including secondary glioblastomas, compared with low-grade astrocytomas, demonstrating consistency with an expression pattern typical of tumor-suppressive late-stage progression factors; ii) absent NPAS3 expression in surgically resected glioblastomas correlated with a higher proliferative index; iii) loss-of-function mutations (large deletions, hypermethylation, and point mutations: frameshift, missense) in NPAS3 that are associated with loss of heterozygosity of the NPAS3 locus were identified in glioblastoma specimens, as typically noted with tumor-suppressor genes, and furthermore, the point mutations were determined to be nonpolymorphic; iv) absent NPAS3 expression in two of four malignant human glioma cell lines was identified; v) stably overexpressed or re-expressed NPAS3 in malignant glioma cell lines (U118 and U343) significantly reduced the transformation potential; vi) converse stable knockdown of NPAS3 expression (efficiency >80%) in a malignant glioma cell line (U118) promoted a significant increase in in vitro growth in soft agarose and in vivo intracranial growth in NOD-SCID mice; vii) stable knockdown NPAS3 expression (efficiency >80%) in concert with the human papillomavirus E6 and E7 oncogenes, which inhibit the pRB and p53 signaling pathways,30,31 transformed the well-characterized TERT-immortalized human astrocyte cell line30,31 in soft agarose and promoted the growth of tumors reminiscent of anaplastic astrocytomas in NOD-SCID mice, whereas the parental astrocyte cell line with only stably knocked down NPAS3 expression or only E6 and E7 expression was not transformed; and viii) the converse stably overexpressed NPAS3 suppressed the transformation of TERT-immortalized human astrocytes even in the presence of E6 and E7 oncogene expression. Although 7% to 30% of our astrocytoma panel with elevated NPAS3 expression and with gains of NPAS3 copy number was identified, the findings on the relevance of NPAS3 expression still overwhelmingly support loss of NPAS3 expression as tumor suppressive in the late progression of astrocytomas. In support of this, also identified were five glioblastomas with three copies of NPAS3 but with absent NPAS3 expression, and a heterozygous dominant-negative loss-of-function mutation in a glioblastoma specimen associated with increased NPAS3 expression.
Thus far, it has been discovered that NPAS3 mediates its tumor-suppressive progression factor role in malignant glioma cell lines and human astrocytes by modulating the control of cell cycle regulation, proliferation, apoptosis, and migration/invasion. In malignant glioma cell lines (U118 and U343), the gliomagenic role of NPAS3 is independent of wild-type p53 expression. Although loss of p53 and pRB signaling does not affect endogenous expression of NPAS3 in human astrocytes immortalized with TERT, NPAS3 can still exert a tumor-suppressive progression factor in concert with these pathways to drive transformation into anaplastic astrocytomas from this astrocyte cell line in humans.
The present data are consistent with the known activity of NPAS3 in human fetal development, with increased expression in the radial glia of the ventricular zone during the first trimester and decreased expression in the intermediate progenitor cells of the subventricular zone later in development,14 which suggests that normal NPAS3 expression has an important role in regulating the development and maturation of neural stem cells into mature glia. Current theories of gliomagenesis postulate that gliomas arise by transformation of residual neural stem cells or progenitor cells.18 Therefore, the mechanisms that regulate normal neural stem cell in development likely have an important role in regulation of tumors derived from neural stem cells and progenitor cells.
A combination of selective pharmacologic agents and candidate gene approaches identified links between NPAS3 and multiple signaling pathways such as transforming growth factor-β, fibroblast growth factor receptor, bone morphogenic protein 4, glutamate, dopamine, and serotonin neurosignaling in murine neurons and epithelial limb bud cells.13,15,32,33 The consequences of affecting multiple signaling pathways via NPAS3 expression is not immediately obvious. Increased BMP4 causes a significant decrease in the stemlike tumor-initiating precursors of glioblastomas in humans34; however, increased fibroblast growth factor signaling would be expected to demonstrate the opposite effect.35
The data have further established novel cancer molecular pathways involving genes being regulated by NPAS3 in astrocytes in humans. From the dataset, loss of NPAS3 expression drives accelerated proliferation with a decrease in apoptosis and increase in cells accumulating in the S cell cycle phase. This may be mediated by decreased expression of CDKN1A and CDKN2A and converse increase in expression of ATM and CDC25A during cell-cycle regulation. Likewise, decreased expression of CASP8, TNFRSF1A, and FAS could explain the overall decrease in apoptosis in these cells. Increased expression of ATM and decreased expression of CASP8 have been documented, with important roles in the progression of astrocytomas.36–38 Other major genes of growth factor signaling pathways active in gliomas, including AKT1, ERBB2, JUN, and MYC, demonstrate increased expression when NPAS3 expression is absent. Oncogenic increased expression of AKT1, ERBB2, JUN, and MYC is commonly identified in gliomas and is thought necessary for the progressive growth of astrocytomas.39–44
The present study also identified that loss of NPAS3 expression drives an increase in the migratory/invasive potential of glioma cell lines and astrocyte cell lines in humans. Such cellular behavior may be a consequence of identification of increased expression of several genes including ITGA1, ITGA2, ITGA3, ITGB3, IGB5, MCAM, MET, MMP1, MMP2 and MTA and the converse decreased expression of NME1. These genes are well characterized, with roles in cell migration/invasion and in the progression of astrocytomas.45,46 Loss of NPAS3 expression has also been noted to drive an increase in the in vitro viability of HUVEC endothelial cells, with increased vascularity of induced tumors. Such phenomena may be due to findings from the dataset demonstrating that loss of NPAS3 expression increases expression of angiogenesis-promoting factors including FGFR2 and VEGFA, which are well characterized in the progression of astrocytomas.47,48 Increased levels of vascular endothelial growth factor A are prominently identified in high-grade astrocytomas,47,48 which correlate well with absence of NPAS3 expression observed in these lesions.
Apart from discovery of a fundamental role of NPAS3 expression in astrocytomas, of clinical importance, the present data also indicate that patients with glioblastomas with absent NPAS3 immunostaining exhibit poorer overall survival than do patients with NPAS3-immunopositive glioblastomas and, hence, a negative prognostic marker for survival. This raises the possibility that NPAS3 IHC may provide useful prognostic information in future clinical studies of glioblastomas. In addition, as similarly performed with other gliomagenesis transcription factors such as p53 and OLIG2, future studies to search for biological agents against NPAS3 such as from kinases or phosphorylases that regulate NPAS3 protein activity are anticipated to contribute to the discovery of improved targeted therapies.
In summary, the present data provide robust evidence that NPAS3 has features suggestive of a tumor-suppressive role that drives the late progression of astrocytomas. Such findings are important in improving understanding of the biologic features of astrocytoma, which may lead to discovery of better treatment for this notably fatal disease.
Acknowledgments
We thank Drs. Manjit Rana (Laval University) and Charles Lee (Harvard University) for technical assistance; Drs. Abhijit Guha (University of Toronto) and Darrell Bigner (Duke University) for selected cell lines and some selected clinical specimens; and Dr. Kam Kamnasaran for helpful comments.
Footnotes
Supported by operating grants from the CHUQ foundation, Fondation des Étoiles, Laval University Faculty of Medicine Foundation, Natural Sciences and Engineering Research Council of Canada, Canadian Foundation for Innovation (Leaders Opportunity Fund), and Fonds de la Recherche en Santé du Québec (FRSQ) (D.K.). D.K. is a recipient scholar of FRSQ.
Supplemental material for this article can be found on http://ajp.amjpathol.org or at doi: 10.1016/j.ajpath.2011.03.044.
Supplementary data
Expression analysis of NPAS3. A: Double IHC using rabbit polyclonal antibodies to NPAS3 (Sigma-Aldrich Corp., St. Louis, MO) and GFAP (Dako Corp., Carpenteria, CA), identifies the nuclear expression of NPAS3 (brown stain) co-localized in astrocytes (lavender-purple stain) in nonneoplastic brain tissue (arrow). B: Double immunofluorescent cytochemistry localizes NPAS3 as a nuclear protein expressed in telomerase-immortalized normal human astrocytes. Nuclear localization of NPAS3 (middle) is noted using a Cy5-conjugated NPAS3 rabbit polyclonal antibody (Sigma-Aldrich Corp.). Cytoplasmic localization of GFAP (right) is noted using a Cy3-conjugated GFAP rabbit polyclonal antibody (Dako Corp.). The nucleus (left) is counterstained with DAPI (blue stain).
Examples of four patterns of NPAS3 expression dentified in human surgically resected glioblastoma (GBM) specimens, with adjacent tissue sections immunohistochemically stained for GFAP.
Kaplan-Meier overall survival analysis of NPAS3 expression in glioblastomas in a cohort of patients identified absent NPAS3 expression significantly correlated with the poorest overall survival in comparison with glioblastomas exhibiting normal or increased NPAS3 expression (A and B). This trend was maintained even when patients were stratified into different age groups (younger or older than 60 years). An inadequate number of patients with glioblastomas demonstrating decreased NPAS3 expression were included in this study. A: Results from the log-rank tests for pairwise comparison of NPAS3 expression patterns and overall survival. B: Kaplan-Meier plots of overall survival in patients exhibiting three types of NPAS3 expression (absent, increased, and normal), and with calculated probability of survival at selected times, with 95% confidence interval. Of note, from the panel of glioblastomas, clinical data were available for 77 patients who had undergone total resection of the tumor. Postoperatively, patients were treated using standard adjuvant radiation therapy (60 Gy for 6 to 7 weeks) combined with chemotherapy, with follow-up not exceeding 30 months. NPAS3 expression was absent in 28 glioblastomas, increased in 18, and normal in 31. The study included 54 men and 23 women with median age 59 years and no significant difference in sex versus overall survival.
Examples of FISH signals identified in a panel of 275 glioblastomas using an RPMI-66M11 BAC probe that spans exons 2 and 3 of the NPAS3 gene.
Chromatograms demonstrate glioblastoma mutations identified from sequence analysis of the coding regions of the NPAS3 gene.
Loss-of-heterozygosity (LOH) analysis of operative glioblastoma specimens using SNP genetic markers mapping within and flanking the NPAS3 gene. A: Schema of the NPAS3 genomic structure, with exons expressed in astrocytes. B: Locations of the 20 SNP genetic markers used in testing. C: Loss of heterozygosity was observed in two of three glioblastoma specimens tested by genotyping blood and glioblastoma DNA with several SNP markers. Loss of heterozygosity was associated with loss-of-function mutations identified in the glioblastoma specimens (Figure S5). Of note, a GBM1 tumor specimen was identified with a heterozygous dominant-negative mutation (Figure S5). D: Chromatograms depict loss of heterozygosity in two glioblastoma specimens compared with the respective patient's blood genotype.
NPAS3 expression modulates cellular migration/invasion. Invasion assays with genetically engineered human glioma cell lines (A) and human astrocyte cell lines (B). All assays were performed in triplicate, with P values calculated using the pairwise Student's t-test.
Conditioned media from genetically engineered cell lines with altered NPAS3 expression modulates the viability of a HUVEC cell line. MTS assays on genetically engineered human glioma cell lines (A) and human astrocyte cell lines (B). All assays were performed in triplicate, with P values calculated using the pairwise Student's t-test.
References
- 1.International Agency for Research on Cancer . WHO Classification of Tumours of the Central Nervous System. In: Louis D.N., Ohgaki H., Wiestler O.D., Cavenee W.K., editors. ed 4. WHO Press; Geneva, Switzerland: 2007. vol 1. [Google Scholar]
- 2.Verhaak R.G., Hoadley K.A., Purdom E., Wang V., Qi Y., Wilkerson M.D., Miller C.R., Ding L., Golub T., Mesirov J.P., Alexe G., Lawrence M., O'Kelly M., Tamayo P., Weir B.A., Gabriel S., Winckler W., Gupta S., Jakkula L., Feiler H.S., Hodgson J.G., James C.D., Sarkaria J.N., Brennan C., Kahn A., Spellman P.T., Wilson R.K., Speed T.P., Gray J.W., Meyerson M., Getz G., Perou C.M., Hayes D.N., Cancer Genome Atlas Research Network Integrated genomic analysis identifies clinically relevant subtypes of glioblastoma characterized by abnormalities in PDGFRA, IDH1, EGFR, and NF1. Cancer Cell. 2010;17:98–110. doi: 10.1016/j.ccr.2009.12.020. [DOI] [PMC free article] [PubMed] [Google Scholar]
- 3.Maher E.A., Brennan C., Wen P.Y., Durso L., Ligon K.L., Richardson A., Khatry D., Feng B., Sinha R., Louis D.N., Quackenbush J., Black P.M., Chin L., DePinho R.A. Marked genomic differences characterize primary and secondary glioblastoma subtypes and identify two distinct molecular and clinical secondary glioblastoma entities. Cancer Res. 2006;66:11502–11513. doi: 10.1158/0008-5472.CAN-06-2072. [DOI] [PubMed] [Google Scholar]
- 4.Lo K.C., Bailey D., Burkhardt T., Gardina P., Turpaz Y., Cowell J.K. Comprehensive analysis of loss of heterozygosity events in glioblastoma using the 100K SNP mapping arrays and comparison with copy number abnormalities defined by BAC array comparative genomic hybridization. Genes Chromosomes Cancer. 2008;47:221–237. doi: 10.1002/gcc.20524. [DOI] [PubMed] [Google Scholar]
- 5.Schaefer C., Grouse L., Buetow K., Strausberg R.L. A new cancer genome anatomy project web resource for the community. Cancer J. 2001;7:52–60. [PubMed] [Google Scholar]
- 6.Bayani J., Pandita A., Squire J.A. Molecular cytogenetic analysis in the study of brain tumors: findings and applications. Neurosurg Focus. 2005;19:E1. doi: 10.3171/foc.2005.19.5.2. [DOI] [PubMed] [Google Scholar]
- 7.Kotliarov Y., Steed M.E., Christopher N., Walling J., Su Q., Center A., Heiss J., Rosenblum M., Mikkelsen T., Zenklusen J.C., Fine H.A. High-resolution global genomic survey of 178 gliomas reveals novel regions of copy number alteration and allelic imbalances. Cancer Res. 2006;66:9428–9436. doi: 10.1158/0008-5472.CAN-06-1691. [DOI] [PMC free article] [PubMed] [Google Scholar]
- 8.Parsons D.W., Jones S., Zhang X., Lin J.C., Leary R.J., Angenendt P., Mankoo P., Carter H., Siu I.M., Gallia G.L., Olivi A., McLendon R., Rasheed B.A., Keir S., Nikolskaya T., Nikolsky Y., Busam D.A., Tekleab H., Diaz L.A., Jr, Hartigan J., Smith D.R., Strausberg R.L., Marie S.K., Shinjo S.M., Yan H., Riggins G.J., Bigner D.D., Karchin R., Papadopoulos N., Parmigiani G., Vogelstein B., Velculescu V.E., Kinzler K.W. An integrated genomic analysis of human glioblastoma multiforme. Science. 2008;321:1807–1812. doi: 10.1126/science.1164382. [DOI] [PMC free article] [PubMed] [Google Scholar]
- 9.Noushmehr H., Weisenberger D.J., Diefes K., Phillips H.S., Pujara K., Berman B.P., Pan F., Pelloski C.E., Sulman E.P., Bhat K.P., Verhaak R.G., Hoadley K.A., Hayes D.N., Perou C.M., Schmidt H.K., Ding L., Wilson R.K., Van Den Berg D., Shen H., Bengtsson H., Neuvial P., Cope L.M., Buckley J., Herman J.G., Baylin S.B., Laird P.W., Aldape K., Cancer Genome Atlas Research Network Identification of a CpG island methylator phenotype that defines a distinct subgroup of glioma. Cancer Cell. 2010;17:510–522. doi: 10.1016/j.ccr.2010.03.017. [DOI] [PMC free article] [PubMed] [Google Scholar]
- 10.Crews S.T., Fan C.M. Remembrance of things PAS: regulation of development by bHLH-PAS proteins. Curr Opin Genet Dev. 1999;9:580–587. doi: 10.1016/s0959-437x(99)00003-9. [DOI] [PubMed] [Google Scholar]
- 11.Garcia J.A., Zhang D., Estill S.J., Michnoff C., Rutter J., Reick M., Scott K., Diaz-Arrastia R., McKnight S.L. Impaired cued and contextual memory in NPAS2-deficient mice. Science. 2000;288:2226–2230. doi: 10.1126/science.288.5474.2226. [DOI] [PubMed] [Google Scholar]
- 12.Erbel-Sieler C., Dudley C., Zhou Y., Wu X., Estill S.J., Han T., Diaz-Arrastia R., Brunskill E.W., Potter S.S., McKnight S.L. Behavioral and regulatory abnormalities in mice deficient in the NPAS1 and NPAS3 transcription factors. Proc Natl Acad Sci USA. 2004;101:13648–13653. doi: 10.1073/pnas.0405310101. [DOI] [PMC free article] [PubMed] [Google Scholar]
- 13.Kamnasaran D., Muir W.J., Ferguson-Smith M.A., Cox D.W. Disruption of the neuronal PAS3 gene in a family affected with schizophrenia. J Med Genet. 2003;40:325–332. doi: 10.1136/jmg.40.5.325. [DOI] [PMC free article] [PubMed] [Google Scholar]
- 14.Gould P., Kamnasaran D. Immunohistochemical analyses of NPAS3 expression in the developing human fetal brain. Anat Histol Embryol. 2011 doi: 10.1111/j.1439-0264.2010.01059.x. [DOI] [PubMed] [Google Scholar]; DOI: 10.1111/j. 1439–0264.2010.01059.x [Epub ahead of press]
- 15.Zhou S., Degan S., Potts E.N., Foster W.M., Sunday M.E. NPAS3 is a trachealess homolog critical for lung development and homeostasis. Proc Natl Acad Sci USA. 2009;106:11691–11696. doi: 10.1073/pnas.0902426106. [DOI] [PMC free article] [PubMed] [Google Scholar] [Research Misconduct Found]
- 16.Kamnasaran D., Chen C.P., Devriendt K., Mehta L., Cox D.W. Defining a holoprosencephaly locus on human chromosome 14q13 and characterization of potential candidate genes. Genomics. 2005;85:608–621. doi: 10.1016/j.ygeno.2005.01.010. [DOI] [PubMed] [Google Scholar]
- 17.Brunskill E.W., Witte D.P., Shreiner A.B., Potter S.S. Characterization of npas3, a novel basic helix-loop-helix PAS gene expressed in the developing mouse nervous system. Mech Dev. 1999;88:237–241. doi: 10.1016/s0925-4773(99)00182-3. [DOI] [PubMed] [Google Scholar]
- 18.Sanai N., Alvarez-Buylla A., Berger M.S. Neural stem cells and the origin of gliomas. N Engl J Med. 2005;353:811–822. doi: 10.1056/NEJMra043666. [DOI] [PubMed] [Google Scholar]
- 19.Lavedan C., Licamele L., Volpi S., Hamilton J., Heaton C., Mack K., Lannan R., Thompson A., Wolfgang C.D., Polymeropoulos M.H. Association of the NPAS3 gene and five other loci with response to the antipsychotic iloperidone identified in a whole genome association study. Mol Psychiatry. 2009;14:804–819. doi: 10.1038/mp.2008.56. [DOI] [PubMed] [Google Scholar]
- 20.Macintyre G., Alford T., Xiong L., Rouleau G.A., Tibbo P.G., Cox D.W. Association of NPAS3 exonic variation with schizophrenia. Schizophr Res. 2010;120:143–149. doi: 10.1016/j.schres.2010.04.002. [DOI] [PubMed] [Google Scholar]
- 21.Kimchi E.T., Posner M.C., Park J.O., Darga T.E., Kocherginsky M., Karrison T., Hart J., Smith K.D., Mezhir J.J., Weichselbaum R.R., Khodarev N.N. Progression of Barrett's metaplasia to adenocarcinoma is associated with the suppression of the transcriptional programs of epidermal differentiation. Cancer Res. 2005;65:3146–3154. doi: 10.1158/0008-5472.CAN-04-2490. [DOI] [PubMed] [Google Scholar]
- 22.Turashvili G., Bouchal J., Baumforth K., Wei W., Dziechciarkova M., Ehrmann J., Klein J., Fridman E., Skarda J., Srovnal J., Hajduch M., Murray P., Kolar Z. Novel markers for differentiation of lobular and ductal invasive breast carcinomas by laser microdissection and microarray analysis. BMC Cancer. 2007;7:55. doi: 10.1186/1471-2407-7-55. [DOI] [PMC free article] [PubMed] [Google Scholar]
- 23.Harada T., Chelala C., Bhakta V., Chaplin T., Caulee K., Baril P., Young B.D., Lemoine N.R. Genome-wide DNA copy number analysis in pancreatic cancer using high-density single nucleotide polymorphism arrays. Oncogene. 2008;27:1951–1960. doi: 10.1038/sj.onc.1210832. [DOI] [PMC free article] [PubMed] [Google Scholar]
- 24.SAS Institute . SAS Institute, Inc.; Cary, NC: 2008. SAS/STAT 9.2 user's guide. [Google Scholar]
- 25.Glenn A., Walker C. ed 2. SAS Institute, Inc.; Cary, NC: 2002. Common statistical methods for clinical research. [Google Scholar]
- 26.Cantor A.B. ed 2. SAS Institute, Inc.; Cary, NC: 2003. SAS survival analysis techniques for medical research. [Google Scholar]
- 27.Lin D.Y., Wei L.J., Ying Z. Checking the Cox model with cumulative sums of martingale residuals. Biometrika. 1993;80:557–572. [Google Scholar]
- 28.Wen J., Brogna S. Nonsense-mediated mRNA decay. Biochem Soc Trans. 2008;36:514–516. doi: 10.1042/BST0360514. [DOI] [PubMed] [Google Scholar]
- 29.Akiyama Y., Watkins N., Suzuki H., Jair K.W., van Engeland M., Esteller M., Sakai H., Ren C.Y., Yuasa Y., Herman J.G., Baylin S.B. GATA-4 and GATA-5 transcription factor genes and potential downstream antitumor target genes are epigenetically silenced in colorectal and gastric cancer. Mol Cell Biol. 2003;23:8429–8439. doi: 10.1128/MCB.23.23.8429-8439.2003. [DOI] [PMC free article] [PubMed] [Google Scholar]
- 30.Sonoda Y., Ozawa T., Hirose Y., Aldape K.D., McMahon M., Berger M.S., Pieper R.O. Formation of intracranial tumors by genetically modified human astrocytes defines four pathways critical in the development of human anaplastic astrocytoma. Cancer Res. 2001;61:4956–4960. [PubMed] [Google Scholar]
- 31.Sonoda Y., Ozawa T., Aldape K.D., Deen D.F., Berger M.S., Pieper R.O. Akt pathway activation converts anaplastic astrocytoma to glioblastoma multiforme in a human astrocyte model of glioma. Cancer Res. 2001;61:6674–6678. [PubMed] [Google Scholar]
- 32.Pieper A.A., Wu X., Han T.W., Estill S.J., Dang Q., Wu L.C., Reece-Fincanon S., Dudley C.A., Richardson J.A., Brat D.J., McKnight S.L. The neuronal PAS domain protein 3 transcription factor controls FGF-mediated adult hippocampal neurogenesis in mice. Proc Natl Acad Sci USA. 2005;102:14052–14057. doi: 10.1073/pnas.0506713102. [DOI] [PMC free article] [PubMed] [Google Scholar]
- 33.Brunskill E.W., Ehrman L.A., Williams M.T., Klanke J., Hammer D., Schaefer T.L., Sah R., Dorn G.W., II, Potter S.S., Vorhees C.V. Abnormal neurodevelopment, neurosignaling and behaviour in Npas3-deficient mice. Eur J Neurosci. 2005;22:1265–1276. doi: 10.1111/j.1460-9568.2005.04291.x. [DOI] [PubMed] [Google Scholar]
- 34.Piccirillo S.G., Reynolds B.A., Zanetti N., Lamorte G., Binda E., Broggi G., Brem H., Olivi A., Dimeco F., Vescovi A.L. Bone morphogenetic proteins inhibit the tumorigenic potential of human brain tumour–initiating cells. Nature. 2006;444:761–765. doi: 10.1038/nature05349. [DOI] [PubMed] [Google Scholar]
- 35.Loilome W., Joshi A.D., ap Rhys C.M., Piccirillo S., Vescovi A.L., Gallia G.L., Riggins G.J. Glioblastoma cell growth is suppressed by disruption of fibroblast growth factor pathway signaling. J Neurooncol. 2009;94:359–366. doi: 10.1007/s11060-009-9885-5. [DOI] [PubMed] [Google Scholar]
- 36.Williams J.R., Zhang Y., Russell J., Koch C., Little J.B. Human tumor cells segregate into radiosensitivity groups that associate with ATM and TP53 status. Acta Oncol. 2007;46:628–638. doi: 10.1080/02841860601080407. [DOI] [PubMed] [Google Scholar]
- 37.Kuwayama K., Matsuzaki K., Mizobuchi Y., Mure H., Kitazato K.T., Kageji T., Nakao M., Nagahiro S. Promyelocytic leukemia protein induces apoptosis due to caspase-8 activation via the repression of NFkappaB activation in glioblastoma. Neuro Oncol. 2009;11:132–141. doi: 10.1215/15228517-2008-083. [DOI] [PMC free article] [PubMed] [Google Scholar]
- 38.Ashley D.M., Riffkin C.D., Muscat A.M., Knight M.J., Kaye A.H., Novak U., Hawkins C.J. Caspase 8 is absent or low in many ex vivo gliomas. Cancer. 2005;104:1487–1496. doi: 10.1002/cncr.21323. [DOI] [PubMed] [Google Scholar]
- 39.Thomas C.Y., Chouinard M., Cox M., Parsons S., Stallings-Mann M., Garcia R., Jove R., Wharen R. Spontaneous activation and signaling by overexpressed epidermal growth factor receptors in glioblastoma cells. Int J Cancer. 2003;104:19–27. doi: 10.1002/ijc.10880. [DOI] [PubMed] [Google Scholar]
- 40.Chakravarti A., Zhai G., Suzuki Y., Sarkesh S., Black P.M., Muzikansky A., Loeffler J.S. The prognostic significance of phosphatidylinositol 3-kinase pathway activation in human gliomas. J Clin Oncol. 2004;22:1926–1933. doi: 10.1200/JCO.2004.07.193. [DOI] [PubMed] [Google Scholar]
- 41.Rajasekhar V.K., Viale A., Socci N.D., Wiedmann M., Hu X., Holland E.C. Oncogenic Ras and Akt signaling contribute to glioblastoma formation by differential recruitment of existing mRNAs to polysomes. Mol Cell. 2003;12:889–901. doi: 10.1016/s1097-2765(03)00395-2. [DOI] [PubMed] [Google Scholar]
- 42.Cui J., Han S.Y., Wang C., Su W., Harshyne L., Holgado-Madruga M., Wong A.J. c-Jun NH(2)-terminal kinase 2alpha2 promotes the tumorigenicity of human glioblastoma cells. Cancer Res. 2006;66:10024–10031. doi: 10.1158/0008-5472.CAN-06-0136. [DOI] [PubMed] [Google Scholar]
- 43.Lassman A.B., Dai C., Fuller G.N., Vickers A.J., Holland E.C. Overexpression of c-MYC promotes an undifferentiated phenotype in cultured astrocytes and allows elevated Ras and Akt signaling to induce gliomas from GFAP-expressing cells in mice. Neuron Glia Biol. 2004;1:157–163. doi: 10.1017/s1740925x04000249. [DOI] [PMC free article] [PubMed] [Google Scholar]
- 44.Zheng H., Ying H., Yan H., Kimmelman A.C., Hiller D.J., Chen A.J., Perry S.R., Tonon G., Chu G.C., Ding Z., Stommel J.M., Dunn K.L., Wiedemeyer R., You M.J., Brennan C., Wang Y.A., Ligon K.L., Wong W.H., Chin L., DePinho R.A. Pten and p53 converge on c-Myc to control differentiation, self-renewal, and transformation of normal and neoplastic stem cells in glioblastoma. Cold Spring Harb Symp Quant Biol. 2008;73:427–437. doi: 10.1101/sqb.2008.73.047. [DOI] [PubMed] [Google Scholar]
- 45.Yamamoto M., Ueno Y., Hayashi S., Fukushima T. The role of proteolysis in tumor invasiveness in glioblastoma and metastatic brain tumors. Anticancer Res. 2002;22:4265–4268. [PubMed] [Google Scholar]
- 46.Moriyama T., Kataoka H., Koono M., Wakisaka S. Expression of hepatocyte growth factor/scatter factor and its receptor c-Met in brain tumors: evidence for a role in progression of astrocytic tumors. Int J Mol Med. 1999;3:531–536. doi: 10.3892/ijmm.3.5.531. [DOI] [PubMed] [Google Scholar]
- 47.Tate M.C., Aghi M.K. Biology of angiogenesis and invasion in glioma. Neurotherapeutics. 2009;6:447–457. doi: 10.1016/j.nurt.2009.04.001. [DOI] [PMC free article] [PubMed] [Google Scholar]
- 48.Wong M.L., Prawira A., Kaye A.H., Hovens C.M. Tumour angiogenesis: its mechanism and therapeutic implications in malignant gliomas. J Clin Neurosci. 2009;16:1119–1130. doi: 10.1016/j.jocn.2009.02.009. [DOI] [PubMed] [Google Scholar]
Associated Data
This section collects any data citations, data availability statements, or supplementary materials included in this article.
Supplementary Materials
Expression analysis of NPAS3. A: Double IHC using rabbit polyclonal antibodies to NPAS3 (Sigma-Aldrich Corp., St. Louis, MO) and GFAP (Dako Corp., Carpenteria, CA), identifies the nuclear expression of NPAS3 (brown stain) co-localized in astrocytes (lavender-purple stain) in nonneoplastic brain tissue (arrow). B: Double immunofluorescent cytochemistry localizes NPAS3 as a nuclear protein expressed in telomerase-immortalized normal human astrocytes. Nuclear localization of NPAS3 (middle) is noted using a Cy5-conjugated NPAS3 rabbit polyclonal antibody (Sigma-Aldrich Corp.). Cytoplasmic localization of GFAP (right) is noted using a Cy3-conjugated GFAP rabbit polyclonal antibody (Dako Corp.). The nucleus (left) is counterstained with DAPI (blue stain).
Examples of four patterns of NPAS3 expression dentified in human surgically resected glioblastoma (GBM) specimens, with adjacent tissue sections immunohistochemically stained for GFAP.
Kaplan-Meier overall survival analysis of NPAS3 expression in glioblastomas in a cohort of patients identified absent NPAS3 expression significantly correlated with the poorest overall survival in comparison with glioblastomas exhibiting normal or increased NPAS3 expression (A and B). This trend was maintained even when patients were stratified into different age groups (younger or older than 60 years). An inadequate number of patients with glioblastomas demonstrating decreased NPAS3 expression were included in this study. A: Results from the log-rank tests for pairwise comparison of NPAS3 expression patterns and overall survival. B: Kaplan-Meier plots of overall survival in patients exhibiting three types of NPAS3 expression (absent, increased, and normal), and with calculated probability of survival at selected times, with 95% confidence interval. Of note, from the panel of glioblastomas, clinical data were available for 77 patients who had undergone total resection of the tumor. Postoperatively, patients were treated using standard adjuvant radiation therapy (60 Gy for 6 to 7 weeks) combined with chemotherapy, with follow-up not exceeding 30 months. NPAS3 expression was absent in 28 glioblastomas, increased in 18, and normal in 31. The study included 54 men and 23 women with median age 59 years and no significant difference in sex versus overall survival.
Examples of FISH signals identified in a panel of 275 glioblastomas using an RPMI-66M11 BAC probe that spans exons 2 and 3 of the NPAS3 gene.
Chromatograms demonstrate glioblastoma mutations identified from sequence analysis of the coding regions of the NPAS3 gene.
Loss-of-heterozygosity (LOH) analysis of operative glioblastoma specimens using SNP genetic markers mapping within and flanking the NPAS3 gene. A: Schema of the NPAS3 genomic structure, with exons expressed in astrocytes. B: Locations of the 20 SNP genetic markers used in testing. C: Loss of heterozygosity was observed in two of three glioblastoma specimens tested by genotyping blood and glioblastoma DNA with several SNP markers. Loss of heterozygosity was associated with loss-of-function mutations identified in the glioblastoma specimens (Figure S5). Of note, a GBM1 tumor specimen was identified with a heterozygous dominant-negative mutation (Figure S5). D: Chromatograms depict loss of heterozygosity in two glioblastoma specimens compared with the respective patient's blood genotype.
NPAS3 expression modulates cellular migration/invasion. Invasion assays with genetically engineered human glioma cell lines (A) and human astrocyte cell lines (B). All assays were performed in triplicate, with P values calculated using the pairwise Student's t-test.
Conditioned media from genetically engineered cell lines with altered NPAS3 expression modulates the viability of a HUVEC cell line. MTS assays on genetically engineered human glioma cell lines (A) and human astrocyte cell lines (B). All assays were performed in triplicate, with P values calculated using the pairwise Student's t-test.