

Abstract
Loss of PTEN and loss of TP53 are common genetic aberrations occurring in prostate cancer. PTEN and TP53 contribute to the regulation of self-renewal and differentiation in prostate progenitors, presumptive tumor initiating cells for prostate cancer. Here we characterize the transformed phenotypes resulting from deletion of the Pten and TP53 tumor suppressors in prostate epithelium. Using the PB-Cre4+Ptenfl/flTP53fl/fl model of prostate cancer, we describe the histological and metastatic properties of primary tumors, transplanted primary tumor cells, and clonal cell lines established from tumors. Adenocarcinoma was the major primary tumor type that developed, which progressed to lethal sarcomatoid carcinoma at approximately 6 months of age. In addition, basal carcinomas and prostatic urothelial carcinomas were observed. We show that tumor heterogeneity resulted, at least in part, from the transformation of multipotential progenitors. CK8+ luminal epithelial cells were capable of undergoing epithelial to mesenchymal transition in vivo to sarcomatoid carcinomas containing osseous metaplasia. Metastasis rarely was observed from primary tumors, but metastasis to lung and lymph nodes occurred frequently from orthotopic tumors initiated from a biphenotypic clonal cell line. Androgen deprivation influenced the differentiated phenotypes of metastases. These data show that one functional consequence of Pten/TP53 loss in prostate epithelium is lineage plasticity of transformed cells.
Prostate cancers display a range of clinical behavior, from slow-growing tumors of minor clinical significance to locally aggressive and ultimately metastatic disease. Human prostate adenocarcinoma has a mature luminal phenotype characterized by cytokeratin 8 (CK8) and androgen receptor (AR) expression and prostate-specific antigen (PSA) production. Progressive prostate cancer is almost always treated with androgen deprivation therapy; however, despite such treatment, approximately 10% of prostate cancers progress to metastatic disease.1 Defining mechanisms of resistance to androgen deprivation and progression to metastasis would be significantly aided by the availability of genetically defined models of prostate cancer progression.
One of the most common genetic alterations in prostate cancer is deletion of at least one copy of the PTEN tumor suppressor, which occurs in approximately 70% of human prostate cancers. Biallelic deletion of PTEN and the associated increase in AKT phosphorylation, which occurs in roughly 25% of prostate cancers, is correlated with resistance to androgen deprivation therapy.2 A recent genomic profiling study of mostly primary prostate cancers demonstrated that 24% of cases had either a heterozygous or homozygous copy number loss of TP53.3 Other large-scale studies using combined immunohistochemistry (IHC) and sequencing approaches have shown that TP53 mutations occur in approximately 5% of primary tumors and at much higher frequencies in lymph node metastases (16%) and castrate-resistant (26%) tumors.4,5 In addition, TP53 mutations were found to be independent predictors of tumor recurrence in low- and intermediate-grade cancers. Thus, loss of PTEN and aberrations of TP53 are implicated in aggressive forms of human prostate cancer.5
Clinical and experimental evidence indicates that a major determinant of metastatic potential is the differentiated phenotype of the cancer cell of origin.6 Multipotential progenitors as well as luminal progenitors are proposed cells of origin for prostate cancer.7 Prostate cancer metastases are found most commonly in the bone, lymph nodes, liver, lungs, and dura mater.1,8,9 Within bone metastatic sites, there is a remarkable degree of phenotypic heterogeneity among tumor cells when comparing different patients as well as multiple sites within individual patients.1,9 This heterogeneity includes differences in morphology as well as immunophenotypes for differentiation markers. Most commonly, prostate cancer metastases tend to have a poorly differentiated morphology; they not infrequently are composed of admixtures of mature luminal and neuroendocrine cells, and they occasionally contain biphenotypic intermediate cells expressing both basal and luminal cytokeratin markers.1,10 Thus, prostate cancer metastases develop from initiating cells with multilineage potential and/or from cells with significant phenotypic plasticity.
Modeling prostate cancer in mice generally involves the use of cell-type–specific promoters to achieve overexpression of oncogenes or deletion of tumor suppressors, mimicking commonly observed genetic aberrations in human prostate cancer. Deletion of floxed Pten alleles (Ptenfl/fl) initiated by pan prostate epithelial cell expression of Probasin (PB)-Cre leads to the expansion of basal cells and the development of invasive adenocarcinoma with an intermediate/luminal phenotype.11 On the other hand, deletion of Pten driven by PSA or NKX3.1 promoters in luminal progenitors also leads to PIN/adenocarcinoma.12,13 These data suggest that more than one differentiated cell type can serve as a target cell population for Pten deletion–mediated prostate oncogenesis.
Previous investigations into the effect of combined genetic deficiencies in murine models of prostate cancer have demonstrated that prostate epithelial cell–specific loss of Pten and TP53 resulted in significantly more penetrant and rapidly developing prostate cancer than Pten deletion alone, whereas loss of TP53 only did not lead to any notable phenotype.14 It was proposed that the synergistic effect of Pten/TP53 deletion results from a loss of TP53 dependent cellular senescence secondary to Pten loss because Pten/TP53 null PIN/adenocarcinoma tumors demonstrated many fewer senescent tumor cells than Pten null tumors.14 Also significant, using in vitro analyses we have shown that Pten and TP53 play a role in regulating self-renewal and differentiation of prostate stem/progenitor cells.15 Therefore, we hypothesized that increased prostate progenitor amplification and deregulated differentiation contribute to the more aggressive and lethal phenotype of tumors initiated after Pten/TP53 loss as compared with Pten loss only.
Increased numbers and/or plasticity of undifferentiated prostate epithelial cells might be expected to give rise to multiple tumor histologies. A longitudinal description of disease progression in the PB-Cre4+; Ptenfl/fl;TP53fl/fl mouse model demonstrated a remarkable degree of cell lineage heterogeneity in primary tumors. We hypothesized that the epithelial heterogeneity derived from the transformation of a multipotential progenitor cell. In addition, the occurrence of CK8+/Vimentin+ cells in tumors undergoing epithelial to mesenchymal transition (EMT), suggested an epithelial origin for the large spindle cell tumors that often caused morbidity/mortality in these mice. To investigate the origin and characteristics of primary tumor heterogeneity, clonal epithelial cell lines were established from tumors to evaluate the differentiation potential of clonally derived tumor-initiating cells. On in vivo inoculation, individual cell lines recapitulated specific features of heterogeneous primary tumors, including EMT and biphenotypic basal and luminal epithelial differentiation. The biphenotypic line described here was androgen sensitive and highly metastatic, characteristics that allow modeling of prostate cancer progression.
Materials and Methods
Animal Breeding
Pb-Cre4+ mice [B6.D2-Tg(Pbsn-Cre)4Prb, #01XF5] were obtained from the Mouse Models of Human Cancers Consortium Mouse Repository (Frederick, MD), Ptenfl/+ mice (C;129S4-Ptentm1Hwu/J, #004597) were obtained from The Jackson Laboratory (Bar Harbor, ME), P53fl/+ mice (B6; 129-Trp53tm1Brn) were a gift from Anton Berns (Amsterdam, The Netherlands)16 and Luciferase + (FVB.Luc+, L2685) were a gift from Christopher Contag (Palo Alto, CA).17 Tumor-bearing Pb-Cre4+;Ptenfl/fl;P53fl/fl male mice were produced by breeding 6- to 10-week old Pb-Cre4+;Ptenfl/fl;P53fl/fl males with Luc+Pb-Cre4−;Ptenfl/fl;P53fl/fl females. Animals were bred, housed, and used in accordance with the Policy on Humane Care and Use of Laboratory Animals (Office of Laboratory Animal Welfare, National Institutes of Health, Bethesda, MD).
The following primer sets were used to detect the transgenes for the purposes of genotyping: Trp53 F: 5′-CACAAAAACAGGTTAAACCCAG-3′ and Trp53 R: 5′-AGCACATAGGAGGCAGAGAC-3′; Ptenfl/fl F: 5′-CAAGCACTCTGCGAACTGAG-3′and Ptenfl/fl R: 5′-AAGTTTTTGAAGGCAAGATGC-3′;Pb-Cre4 01: 5′-ACCAGCCAGCTATCAACTCG-3′ and Pb-Cre4 02: 5′-TTACATTGGTCCAGCCACC-3′. This primer set was combined with Pb-Cre4 03: 5′-CTAGGCCACAGAATTGAAAGATCT-3′ and Pb-Cre4 04: 5′-GTAGGTGGAAATTCTAGCATCATCC-3′ to detect the wild-type IL-2 allele that served as an internal control. Luc F: 5′-CCAGGGATTTCAGTCGATGT-3′ and Luc R: 5′-AATCTGACGCAGGCAGTTCT-3′. For all primer pairs, the thermocycler was run for 35 cycles with an initial 94°C incubation for 3 minutes followed by 94°C melting (30 seconds), 60°C annealing (1 minute), and 72°C extension (1 minute). PCR products were run on a 1.5% agarose gel.
Orthotopic Transplantation
Single-cell suspensions of primary prostate tumor cells from the dorsal and ventral prostatic lobes of Pb-Cre4+;Ptenfl/fl;P53fl/fl mice were prepared and injected into the dorsal prostate as described elsewhere.15 For orthotopic injection of cell lines, 750,000 cells resuspended in 20 μL prostate harvest medium were injected into one of the anterior prostatic lobes of recipient nude mice. Orthotopically injected nude mice were manually palpated weekly and imaged with the Xenogen Ivis (Caliper Life Sciences, Mountain View, CA) bioluminescent imaging system every 2 weeks as previously described.18 Mice were euthanized on signs of morbidity and/or when distended urinary bladders (indicative of urinary obstruction by prostate tumors) were easily palpable. To test for androgen-independent growth, the transplant-recipient nude mice were castrated through an abdominal incision at the time of orthotopic injection, and a 90-day-release, 5-mg testosterone pellet (Innovative Research of America, Sarasota, FL) was implanted subcutaneously in the cervical region. Mice were randomized into two groups at week 7 after orthotopic injection. One group (n = 9) had the subcutaneous testosterone pellets removed, and the other group had the androgen supply replenished by implantation of a second subcutaneous testosterone pellet (n = 8).
Derivation of Wild-Type Basal Cell Line
The prostatic lobes from wild-type mice were dissected from the urogenital tracts and prepared as previously described15 except that the tissue digestion was stopped at the organoid stage before the trypsin digestion. The organoids were washed once with PBS and resuspended in WIT-P medium (Stemgent, San Diego, CA), passed several times through a 19-gauge needle, and plated into a six-well Primeria plate (BD Biosciences, San Jose, CA). The cells were passaged every 7 days for six passages. The resulting established cell line was composed of morphologically uniform cells; 100% of the cells expressed CK5, but not CK8, as determined by both flow cytometry and immunofluorescence.
Derivation of Clonal Cell Lines
Orthotopic carcinomas were aseptically harvested and washed briefly in sterile prostate harvest medium Dulbecco's modified Eagle's medium (Invitrogen) supplemented with 10% fetal bovine serum, 1% penicillin/streptomycin (Invitrogen), gentamicin (Lonza, Walkersville, MD) (30 µg/mL), and amphotericin B (Lonza) (0.015 µg/mL). A 2- to 3-mm cube of the tumor was minced and divided into three aliquots. Each aliquot was placed in a 10-cm Primeria tissue culture dish containing one of the three following media: i) PrEGM medium (Lonza) containing 5 × 10⁻⁹ M dihydroxytestosterone (Steraloids Inc., Newport, RI) referred to hereafter as PrEGM/DHT; ii) PrEGM/DHT, 5% fetal bovine serum, and 5% 3T3 conditioned medium; or iii) PrEGM/DHT and 5% 3T3 conditioned medium. 3T3 conditioned medium was produced by incubating 3T3 fibroblasts in prostate harvest medium for 2 days. The conditioned culture medium was collected, clarified, filtered through a 0.4-μm filter, and stored at −80°C until use.
Cultures were incubated for 1 week or until there was growth on the dish, at which time cells were washed, trypsinized, and passaged two times before being plated at serial dilutions onto 10-cm Petri dishes. Cell cultures were maintained in the same culture media throughout the procedure. Single well-spaced colonies demonstrating an epithelial morphology were harvested using gene choice cloning rings (PGC Scientific Corp., Frederick, MD) and placed into a single well of a 24-well Primeria plate. On average, <10% of colonies were capable of expansive growth and establishment. Between passages 4 and 5, double immunofluorescence was performed for CK5/CK8 and CK8/vimentin. Clones that demonstrated detectable CK5-/CK8-/vimentin+ cells, or > 1% CK8+/vimentin+ cells were excluded from further analysis. A total of 40 clonal cell lines were produced from six separate orthotopic tumors. Nine of these cell lines, derived from four separate orthotopic tumors, were selected for tumorigenesis assays. Clone 1 was grown in PrEGM/DHT with 5% serum and 5% 3T3 conditioned medium. Clones 2, 3, 4, 5, 7, and 9 were grown in PrEGM/DHT. Clone 8 was grown in PrEGM/DHT with 5% 3T3 conditioned medium.
Subcutaneous Tumorigenesis Assay
Single cell suspensions (1 × 10⁶) of clonal cell lines were injected subcutaneously with or without Matrigel (BD Biosciences, San Jose, CA) into the flank region of nude mice (n = 3 mice per cell line, with three tumors injected with matrigel and three tumors injected without matrigel). Cells were resuspended and injected in 200 μL prostate harvest medium. For the contralateral flank, the cells were resuspended in a mixture of 100 μL prostate harvest medium and 100 μL Matrigel. Subcutaneous tumors were harvested when they reached approximately 1 cm in diameter.
Histology
Primary prostate, subcutaneous, and orthotopic tumors were harvested and fixed with 4% paraformaldehyde overnight, rinsed well in PBS, and transferred to 70% ethanol before standard histological processing, sectioning, and staining (Histoserve, Germantown, MD). All prostates were sectioned as described,19 allowing for the examination of all prostatic lobes, the seminal vesicles, bladder, and urethra. Several sections of the tumor, two sections through each lung lobe, and the sublumbar lymph nodes were placed together on the same slide. For the purpose of histopathological analysis of disease progression, for each mouse, two H&E sections separated by 200 μm were analyzed. For the purposes of imunophenotyping the lesions, sequential serial sections were used for all immunohistochemical staining. Two serial sections (separated by 200 μm) of the liver, kidneys, spleen, brain, head, and decalcified longitudinal sections of the lumbar spine as well as fore and hind limbs were analyzed from each animal to assay for metastasis. All slides were analyzed blindly and histopathological analysis was performed by a board-certified veterinary pathologist (P.M. and M.S.). To quantify the percentage of orthotopic tumor area with a certain histological pattern, the area was estimated by using the number of ×200 fields comprised by the particular histological pattern/total ×200 fields analyzed, averaged over the two 200-μm step sections. Bright field images were taken using an upright Zeiss Axioplan microscope (Zeiss, Oberkochen, Germany).
Immunohistochemistry
Unstained slides were deparaffinized, and antigen retrieval was performed in a citrate buffer (Dako targeted antigen retrieval solution; Carpinteria, CA) in a steamer at 100°C for 15 minutes, followed by a 15-minute incubation at room temperature. Blocking was performed with Cyto Q Background Buster reagent (Innovex Biosciences, Richmond, CA) for 30 minutes at room temperature for rabbit primary antibodies, and for 1 hour for mouse primary antibodies. Primary antibody incubation was performed overnight at 4°C, followed by secondary antibody incubation at room temperature for 30 minutes. Secondary goat anti-rabbit biotinylated IgG (E0432), and goat anti-mouse biotinylated IgG (E0433), used at 1:200 dilution, were from Dako. The ABC peroxidase kit (Vector Laboratories, Burlingame, CA) was used, followed by DAB (Dako) for chromagen visualization. All slides were counterstained with hematoxylin. Primary antibodies and the concentrations used are as follows. The following primary antibodies were obtained from Abcam (Cambridge, MA): anti–Ki-67 (ab15580), 1/600; anti-CK8 (ab59400), 1:50; anti-synaptophysin (ab52636), 1:250; anti-Chromogranin A (ab15160), 1:10,000; and anti-PTEN (ab9559), 1:100. Additional antibodies were anti-CK5, 1:1000, from Covance (PRB-160P; San Diego, CA); anti-TP63, 1:400, from Millipore (MAB4135; Billerica, MA); and anti-AR (sc-816), 1:200, from Santa Cruz Biotechnology (Santa Cruz, CA). The following antibodies were obtained from Cell Signaling (Danvers, MA): anti–E-cadherin (3195), 1:100; anti-pAKT (9271), 1:50; anti-TP53 (2527), 1:250, and anti-Slug (9585). At least three tumors from each experimental group (primary tumor, orthotopic transplant of primary tumor cells, and clonal orthotopic tumors with and without androgen deprivation) were analyzed for immunohistochemical phenotyping.
Immunofluorescence
Double immunofluorescence was performed on tissue sections using the same protocol as used for IHC with the following exceptions: The secondary antibodies were Alexa Fluor 488 conjugated goat anti-mouse IgG (A11001) and Alexa Fluor 586 conjugated goat anti-rabbit IgG (A11011), 1:200, (Invitrogen, Carlsbad, CA). Slides were mounted with Vectashield hard mount with DAPI (Vector Laboratories, Burlingame, CA). The same primary antibodies at the concentrations indicated were used as for IHC with the following exceptions: anti-cytokeratin 8 (CK8), 1:400 from Covance (MMS-162P; San Diego, CA); anti-vimentin, 1:50 from Santa Cruz (sc-7557; Santa Cruz, CA); and anti–smooth muscle actin, 1:100, Abcam (ab5694; Cambridge, MA). For immunofluorescence of cell lines grown in vitro, adherent cells were fixed in 4% paraformaldehyde in PBS for 10 minutes, followed by permeabilization with 0.5% Triton X-100 in PBS for 2 minutes. Nonspecific sites were blocked by incubation in 2% BSA in PBS for 30 minutes. Cells were then incubated overnight at 4°C with the specified primary antibodies in 2% BSA/PBS. Cells were washed three times with PBS containing 0.1% Tween-20, incubated with Alexa Fluor 488 conjugated goat anti-mouse IgG and Alexa Fluor 586 conjugated goat anti-rabbit (1:200) in 2% BSA for 30 minutes at room temperature, and finally washed and mounted using the anti-fade reagent Fluoro-gel II with DAPI. Fluorescent images were captured using a Zeiss Observer.Z1 laser confocal microscope and an upright fluorescent Zeiss Axioplan microscope (Zeiss, Thornwood, NY). To estimate the number of cells expressing CK8/CK5 or CK8/vimentin, two micrographs were taken at ×200 for each combination of markers, the percentages of positive cells were counted, and data were reported as the mean average of the two micrographs.
RT-PCR
The following primer sets were used to detect mRNA for the purposes of assaying geneexpression: Nkx3.1 F: 5′-GGAGAGGAAGTTCAGCCATC-3′ andNkx3.1 R: 5′-TGGCAAAGACAATGGTGAGT-3′; Msmb F: 5′-CACCTGCTGTACCAACGCTA-3′ and Msmb R: 5′-CAACTCGACAGGTCTTCCCT-3′; Pten F: 5′-TTGAAGACCATAACCCACCA-3′ and Pten R: 5′-TTACACCAGTCCGTCCCTTT-3′; TP53 F: 5′-TGGTGGTACCTTATGAGCCA-3′ and TP53 R: 5′-AGGTTCCCACTGGAGTCTTC-3′; Cdh1 F: 5′-GACAACGCTCCTGTCTTCAA-3′ and Cdh1 R: 5′-ACGGTGTACACAGCTTTCCA-3′; Krt5 F: 5′-AACGTCAAGAAGCAGTGTGC-3′ and Krt5 R: 5′-TCCAGCTCTGTCAGGTTGTT-3′; Krt19 F: 5′-TATGAGATCATGGCCGAGAA-3′ and Krt19 R: 5′-CGTGACTTCGGTCTTGCTTA-3′; Krt18 F: 5′-CTGGTCTCAGCAGATTGAGG-3′ and Krt18 R: 5′-CTCCGTGAGTGTGGTCTCAG-3′; Krt14 F: 5′-GATGACTTCCGGACCAAGTT-3′ and Krt14 R: 5′-TGAGGCTCTCAATCTGCATC-3′; TP63 F: 5′-CAGTCAAGGACTGCCAAGTC-3′ and TP63 R: 5′-CATCACCTTGATCTGGATGG-3′; Itga6 F: 5′-ACGGTGTTTCCCTCAAAGAC-3′ and Itga6 R: 5′-GAAGAAGCCACACTTCCACA-3′; Vim F: 5′-AAACGAGTACCGGAGACAGG-3′ and Vim R: 5′-TCTCTTCCATCTCACGCATC-3′; Acta2 F: 5′-TTTCATTGGGATGGAGTCAG-3′ and Acta2 R R: 5′-CCTGACAGGACGTTGTTAGC-3′; Cdh2 F: 5′-ATGCCCAAGACAAAGAAACC-3′ and Cdh2 R: 5′-CTGTGCTTGGCAAGTTGTCT-3′; Sox2 F: 5′-ATGCACAACTCGGAGATCAG-3′ and Sox2 R: 5′-TATAATCCGGGTGCTCCTTC-3′; Sox9 F: 5′-CTCCGGCATGAGTGAGGT-3′ and Sox9 R: 5‘-GCTTCAGATCAACTTTGCCA-3′; Notch1 F: 5′-TGGAGGACCTCATCAACTCA-3′ and Notch1 R: 5′-GTTCTGCATGTCCTTGTTGG-3′; Myc F: 5′-TTCTCTCCTTCCTCGGACTC-3′ and Myc R: 5′-TCTTCTTCAGAGTCGCTGCT-3′; Gapdh F: 5′-CAGAACATCATCCCTGCATC-3′ and Gapdh R: 5′-CTGCTTCACCACCTTCTTGA-3′. For reverse transcription, 3 μg total RNA was used with the SuperScript III kit (Invitrogen, Carlsbad, CA). The amplification step used the SYBR green PCR master mix (Applied Biosystems, Bedford, MA). For all primer pairs, the thermocycler was run for 40 cycles with an initial 95°C incubation for 10 minutes, followed by 95°C melting for 15 seconds, 55°C annealing for 30 seconds, and 72°C extension for 30 seconds.
Western Blotting
For protein detection, the following primary antibodies at the indicated concentrations were used in an overnight 4°C incubation: anti-rabbit CK8 (Abcam, ab59400), 1/1000; anti-rabbit AR (Millipore, #06-680), 1/500; anti-rabbit p-Akt (Cell Signaling, #4060), 1/1000; anti-rabbit Akt (Cell Signaling, #4691), 1/1000; anti-mouse TP63 (Millipore, NAB-4315), 1/500; anti-mouse GAPDH (Novus Biochemicals, Littleton, CO; NB300-221), 1/4000. Secondary antibodies (1:2000) were anti-rabbit IgG (#386325) or anti-mouse IgG (#381254) (GE Healthcare, Piscataway, NJ), incubated at room temperature for 1 hour.
Results
PB-Cre4+;Ptenfl/fl;TP53fl/fl Mice Develop Adenocarcinoma with Progression to Sarcomatoid Carcinomas but Not Metastasis
As shown in Figure 1A, PB-Cre4+; Ptenfl/fl;TP53fl/fl mice demonstrated significantly earlier morbidity and mortality as compared with PB-Cre4+; Ptenfl/fl mice (Figure 1A). A longitudinal pathological analysis (Figure 1B) showed that PB-Cre4+;Ptenfl/fl;TP53fl/fl mice developed severe mouse prostatic intraepithelial neoplasia (mPIN) as early as 8 weeks, with progression to adenocarcinoma by 12 weeks. All mice eventually succumbed by 30 weeks as the result of urinary tract obstruction by sarcomatoid carcinomas (Figure 1). The mPIN lesions comprised large numbers of cytokeratin 8 (CK8)+/cytokeratin 5 (CK5)+/TP63− intermediate cells and CK8+/CK5−/TP63− luminal cells (Figure 2C), with occasional foci containing small increases in CK8−/CK5+/TP63+ basal cells. CK8+/CK5− cells increased in proportion to CK8+/CK5+ cells in invasive adenocarcinoma relative to mPIN (Table 1, Figure 2D), suggesting increased accumulation of differentiated luminal cells in adenocarcinoma. Coexpression of the neuroendocrine marker synaptophysin and CK8 were occasionally observed in focal regions of adenocarcinoma and mPIN (see Supplemental Figure S1A at http://ajp.amjpathol.org). At approximately 15 to 19 weeks, sarcomatoid carcinomas could be observed arising in the wall of the anterior prostate, adjacent to poorly differentiated adenocarcinoma (Figure 2G). As adenocarcinoma progressed to sarcomatoid carcinoma, there was a reduction/loss of E-cadherin and CK8 coupled with an increase in vimentin expression (Table 1). Occasional neoplastic spindle-shaped cells coexpressing CK8 and vimentin were observed, indicating epithelial to mesenchymal transition (see Supplemental Figure S2 at http://ajp.amjpathol.org). Nuclear expression of the EMT marker, SLUG, was detected by IHC in sarcomatoid carcinomas (see Supplemental Figure S2 at http://ajp.amjpathol.org), but was rarely detected in adenocarcinoma. Nuclear androgen receptor expression as determined by IHC decreased with disease progression. In mPIN, there was strong nuclear expression of AR in luminal cells. In adenocarcinoma, there was more heterogeneity relative to mPIN in the levels of AR expression, with loss of AR in occasional cells. AR was often very low or undetectable in spindle cell carcinoma (Table 1). At the time that the mice died or were euthanized, distant metastases were not observed; however, lymphovascular and perineural invasion was common (Figure 2, B and E), and small aggregates of tumor cells occasionally were detected in sublumbar lymph nodes and pulmonary capillaries.
Figure 1.
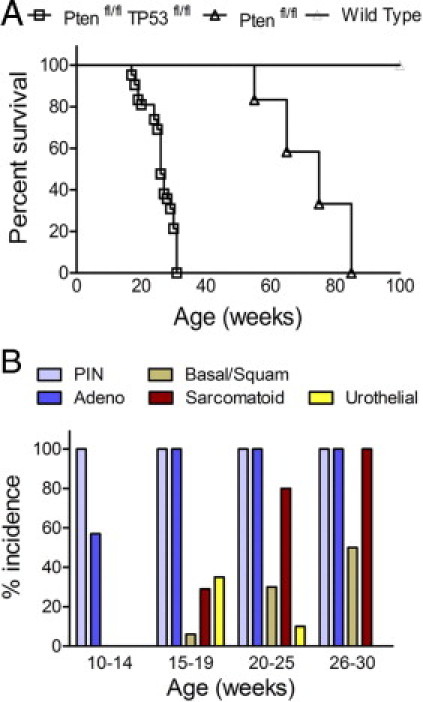
Survival rate and tumor phenotype incidence for PB-Cre4+; Ptenfl/fl;TP53fl/fl mice. A: Kaplan-Meier curve showing survival rates for PB-Cre4+;Ptenfl/fl;TP53fl/fl (n = 41) (Ptenfl/fl TP53fl/fl), open squares; PB-Cre4−; Ptenfl/fl;TP53fl/fl littermates (n = 38) (wild-type, straight line); and PB-Cre4+;Ptenfl/fl (n = 12) (Ptenfl/fl, open triangle). B: Histogram showing the percentage of PB-Cre4+; Ptenfl/fl;TP53fl/fl mice in each age group with a tumor containing the indicated phenotype (%incidence): 10 to 14 weeks (n = 14), 15 to 19 weeks (n = 17), 20 to 25 weeks (n = 10), and 26 to 30 weeks (n = 12). Adeno, adenocarcinoma; Basal/Squam, basal/squamous carcinoma; PIN, mouse prostatic intraepithelial neoplasia; Sarcomatoid, spindle cell carcinoma; Urothelial, urothelial carcinoma.
Figure 2.
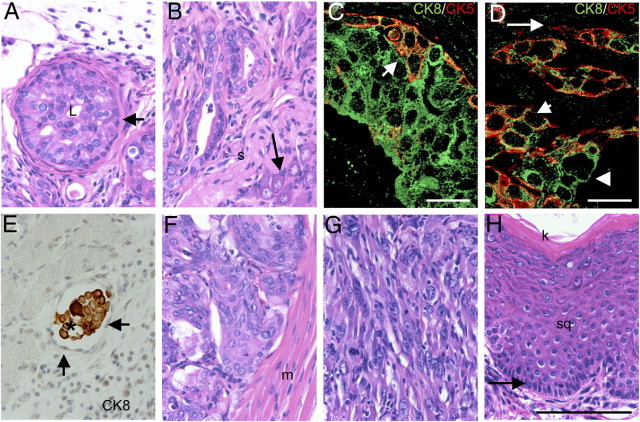
PB-Cre4+; Ptenfl/fl;TP53fl/fl mice display a diversity of tumor phenotypes. Panels A–F depict different regions of tumor from a single mouse. A: High-grade mouse prostatic intraepithelial neoplasia (mPIN), 14-week-old mouse dorsal prostate. In mPIN gland, the lumen (L) is almost completely occluded by a marked proliferation of neoplastic epithelium. The neoplasm does not invade the basement membrane and is bounded entirely by smooth muscle (arrow); H&E. B: Adenocarcinoma in periphery of the dorsal prostate. Neoplastic glands invade the stroma (s) adjacent to a prostatic nerve ganglion (arrow); H&E. C and D: Double immunofluorescence for CK8 (Green; Alexa Fluor 488) and CK5 (Red; Alexa Fluor 586) on mPIN (C) and adenocarcinoma (D). In mPIN (C), there are often cells with coexpression of CK5 and CK8 (arrow). In adenocarcinoma (D), there are cells with CK8/CK5 coexpression (short arrow), CK8+/CK5− cells (arrowhead), and occasionally CK5+/CK8− cells (long arrow). E: Vascular invasion. Tumor embolus (asterisk) within lumen of blood vessel is comprised of cells that label positive for CK8. Arrows indicate endothelial cells lining luminal surface of blood vessel, anti-CK8, and hematoxylin. F: Prostatic urothelial carcinoma in proximal prostatic ducts adjacent to the urethral muscularis (m). Note packets of prostatic urothelial carcinoma cells separated by a fine fibrovascular stroma; H&E. G: Sarcomatoid carcinoma in 28-week-old mouse. Note streams of spindle shaped cells with large oval nuclei that lack glandular differentiation; H&E. H: Basal/squamous carcinoma in anterior prostate of 28-week-old mouse. Note pallisading basal cells (arrow) on basement membrane with overlying stratified squamous epithelium (sq) and superficial keratin layer (k); H&E. Images taken at ×400. Scale bars: 100 μm (A, B, and E–H). Images taken at ×630. Scale bars: 20 μm (C and D).
Table 1.
Summary of Immunohistochemical Marker Expression in Wild-Type Prostate Epithelium and PB-Cre4+Ptenfl/flTP53fl/fl Primary Tumors or Tumors Arising from Orthotopically Transplanted Tumor Cell Suspensions
| IHC marker | Wild-type | mPIN | Adeno | Sarcomatoid | Basal/squamous |
|---|---|---|---|---|---|
| CK8 | +++ in luminal cells | +++↑ | +++↑ | +/−↓ | +/− |
| CK5 | + in basal cells | ++ | + | − | +++ |
| CK8+/CK5+ | +/− | ++ | + | − | +/− |
| TP63 | + in basal cells | +⁎ | +/− | − | +++ |
| AR | +++ | ++↓ | ++↓ | +/−↓ | ++↓ |
| Synapto | + in rare neuroendocrine cells | + | + | + | + |
| Synapto/CK8+ | +/− | + | + | +/− | +/− |
| Synapto/CK5+ | − | +/− | +/− | − | + |
| E-cadherin | +++ | +++ | +++† | − | +++ |
| Vimentin | − | − | +/−† | +++ | − |
| Vimentin/CK8+ | − | − | +/− | + | − |
Adeno, adenocarcinoma; AR, androgen receptor; Basal/squamous, basal/squamous carcinoma; mPIN, mouse prostatic intraepithelial neoplasia; Sarcomatoid, sarcomatoid carcinomal; Synapto, synaptophysin; +++, marker present in most or all cells (80–100%); ++, marker present in many cells [however there are significant numbers of cells that lack expression (50–80%)]; +, marker present in a minority of cells (5–50%); +/−, marker present in only rare populations of cells (≤5%); −, absence of marker; ↑, increased IHC labeling intensity relative to epithelial cells in wild-type control prostate; ↓, decreased IHC labeling intensity relative to epithelial cells in wild-type control prostate.
In mPIN, there are areas with minimal proliferation of TP63+ cells along the basal lamina, and rarely in the cell layer superficial to the basal cell layer, as well as areas lacking TP63+ cells.
In poorly differentiated adenocarcinoma, there is often a decrease in intensity of E-cadherin labeling as well as the presence of rare vimentin+ cells.
Primary Tumors Contain Additional Minor Components of Other Tumor Phenotypes
In addition to the development of adenocarcinoma with a luminal phenotype, PB-Cre4+; Ptenfl/fl;TP53fl/fl tumors occasionally contained regions with a basal/squamous or urothelial phenotype (Figure 2, F and H). Basal/squamous regions often featured keratin production (Figure 2H) and were characterized by CK5 and TP63 expression (Table 1). Occasionally, in the most proximal regions of the prostatic lobes where the prostatic ducts traverse the urethral muscularis and communicate with the urethra, there was carcinoma with a urothelial pattern, referred to as prostatic urothelial carcinoma (CK5+/TP63+ with rare CK8+ cells) (Figure 2F). However, no tumors of the urinary bladder or urethral transitional epithelium were observed in any mice. Frequently, basal/squamous carcinoma, adenocarcinoma, and prostatic urothelial carcinoma were present in the same tumor. All tumor types displayed heterogeneous expression of the neuroendocrine marker synaptophysin (see Supplemental Figure S1A at http://ajp.amjpathol.org). Chromogranin A was only rarely observed in isolated individual cells, indicating a not-fully-differentiated neuroendocrine phenotype. As anticipated, IHC failed to detect TP53 or Pten expression in tumor cells of all histological types, whereas Pten expression could be detected in adjacent reactive stroma (data not shown).
Transplantation of PB-Cre4+;Ptenfl/fl;TP53fl/fl Tumor-Initiating Cells Does Not Lead to Metastasis
The rapid growth of primary tumors in this murine model led to early mortality, which might explain the lack of metastasis. To test the tumor-initiating capacity and metastatic potential of PB-Cre4+; Ptenfl/fl;TP53fl/fl tumor cells, we injected into the dorsal prostatic lobe of nude mice single-cell suspensions of primary mouse prostate tumors obtained from 12- to 16-week-old PB-Cre4+; Ptenfl/fl;TP53fl/fl mice. A constitutively expressed luciferase construct was introduced by cross-breeding into the tumor model to provide a noninvasive marker for monitoring the growth and potential metastasis of transplanted cells.17 Tumors from transplant recipients were harvested at morbidity, an average of 27 weeks after injection. Orthotopically transplanted tumor cells primarily formed orthotopic PIN (oPIN) and adenocarcinoma, which expressed markers similar to equivalent primary neoplasms (Figures 3 and 4, Table 1; see also Supplemental Figure S1B at http://ajp.amjpathol.org). Basal/squamous carcinomas and prostatic urothelial carcinomas developed infrequently. Notably, although there were occasional foci of EMT with individual or small clusters of tumor cells acquiring spindle cell morphology, there were no discrete sarcomatoid carcinomas. There was widespread lymphovascular and perineural invasion in transplant recipients; however, metastases were not observed with either ex vivo bioluminescent imaging of recipient mouse organs or by histopathological examination. The lack of metastasis in orthotopically transplanted mice, in which there was an additional 12- to 16-week period for orthotopic tumor development, supports the conclusion that pan-epithelial Pten/TP53 deletions alone usually are not sufficient to drive prostate carcinoma metastasis.
Figure 3.
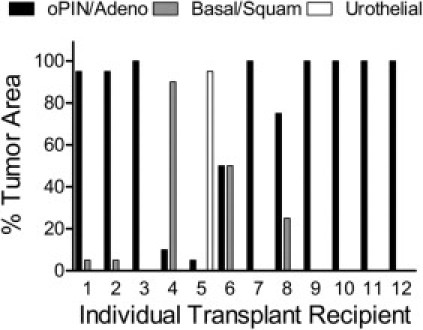
Orthotopic injection of PB-Cre4+; Ptenfl/fl;TP53fl/fl mouse primary prostate carcinoma cells favors the development of adenocarcinoma. Orthotopic prostate carcinoma histological pattern as a percentage of total tumor area for each individual orthotopic tumor (n = 12). oPIN/Adeno = mouse orthotopic prostatic intraepithelial neoplasia/adenocarcinoma; Basal/Squam = basal/squamous carcinoma; Urothelial = urothelial carcinoma. Nude mice underwent injection, into one dorsal prostatic lobe, with single-cell suspensions of PB-Cre4+; Ptenfl/fl;TP53fl/fl mouse primary mouse prostate carcinomas.
Figure 4.
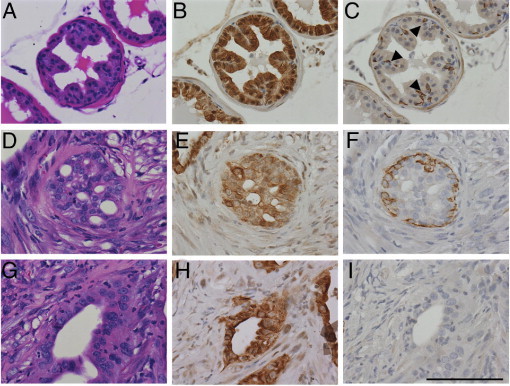
Orthotopic prostatic intraepithelial neoplasia (oPIN) and orthotopic adenocarcinoma (oAC) resulting from injection of primary PB-Cre4+; Ptenfl/fl;TP53fl/fl tumor cells. Sequential serial sections of recipient nude mouse wild-type prostate (A–C), oPIN (D–F), and oAC (G–I), were stained with H&E (A, D, and G), CK8 (B, E, and H), and CK5 (C, F, and I). A: Recipient nude mouse wild-type dorsal prostate. B: Luminal cells express cytokeratin 8 (CK8), whereas (C) basal cells express cytokeratin 5 (CK5) (arrowheads). D: Orthotopic PIN with marked proliferation of neoplastic glandular epithelium in a cribiform pattern. E: Most of the epithelial cells express CK8. F: There is a nearly complete basal cell layer comprising CK5-expressing cells but no smooth muscle layer. G: Orthotopic adenocarcinoma. H: The neoplastic epithelium expresses CK8, (I) with loss of the CK5+ basal cell layer. All images taken at ×400. Scale bar = 100 μm.
Clonally Derived Cell Lines Produce Tumors Containing Multiple Lineages
The tumor heterogeneity in primary and orthotopic prostate carcinomas could be the result of transformation of multiple, distinct, lineage-committed tumor progenitor cells and/or of tumor progenitors with multilineage potential. As one approach to begin addressing the differentiation potential of tumor-initiating cells, we derived several clonal cell lines from six separate orthotopic carcinomas. Clonal cell lines were immunophenotyped at passages 4 or 5 for CK5, CK8, and vimentin. The characteristics of nine cell lines that were further expanded and tested for tumorigenicity are shown (Table 2). With the exception of clone 8 that was composed of CK8−/CK5+ cells, all of the clones contained CK8+ cells and a variable percentage of double positive CK8+/CK5+ cells. Clonal cell lines appeared to produce continuously differentiating cells, as individual colonies derived from single cells contained cells with heterogeneous marker expression. Cell suspensions were injected subcutaneously into nude mice. The basal cell phenotype clone did not form tumors, although seven of eight of the CK8+ clones were tumorigenic. Tumors with mixed histologies developed from five of seven lines, and adenocarcinoma and sarcomatoid carcinoma developed from clones 6 and 7, respectively. Three cell clones (clones 1, 3, and 4) demonstrated the capacity for biphenotypic basal and luminal differentiation, suggesting origins of the cell lines with bipotential progenitors. In addition, the development of subcutaneous sarcomatoid carcinomas from three clonal epithelial cell lines (clones 2, 5, and 6) formally demonstrates the epithelial origin of spindle cell tumors in this model (Table 2). Sarcomatoid carcinoma tumors frequently displayed osseous and cartilaginous metaplasia, implying mesenchymal differentiation to the osteoblast and chondrocyte lineages. One clone that produced biphenotypic tumors (Clone 1) and one clone that produced sarcomatoid carcinomas (Clone 2) were analyzed more extensively for the expression of lineage markers and for orthotopic tumorigenic and metastatic characteristics, as described below.
Table 2.
Summary of in Vitro and in Vivo Phenotypes for Pten/TP53 Null Prostatic Carcinoma Clonal Cell Lines
|
In Vitro |
In Vivo |
||||
|---|---|---|---|---|---|
| Clone | CK5 | CK8 | Vimentin | Tumor no. | Subcutaneous tumor phenotype |
| 1 | 75% | 100% | ND | 101 | Basal/squamous > adeno |
| 2 | 5% | 100% | ND | 301 | Sarcomatoid/undiff/adeno > basal/squamous |
| 3 | 37% | 100% | <1% | 211 | Basal/squamous > adeno |
| 4 | 90% | 100% | ND | 211 | Basal/squamous > adeno |
| 5 | 75% | 100% | <1% | 211 | Sarcomatoid > basal/squamous > adeno |
| 6 | 75% | 100% | <1% | 222 | Sarcomatoid |
| 7 | 62% | 75% | <1% | 222 | Adeno |
| 8 | 100% | 0% | ND | 222 | No tumor growth |
| 9 | 62% | 100% | ND | 222 | No tumor growth |
Average percentage of cells expressing CK5, CK8, and vimentin determined by counting at least 200 cells per clonal cell line.
Adeno, adenocarcinoma; Basal/squamous, basal/squamous carcinoma; ND, not detected (no cells detected expressing the marker in the entire well of an 8-well chamber slide containing approximately 1800 cells); Undiff, undifferentiated carcinoma; <1%, less than 10 cells expressing the marker in the entire well of the chamber slide containing approximately 1800 cells.
Analysis of Sarcomatoid Carcinoma-Producing Clone 2
Clone 2 comprised primarily CK8+/CK5− cells with low numbers of CK8+/CK5+ cells. As shown in Figure 5, the Clone 2 cell line was characterized for RNA expression of a variety of markers including the following: epithelial lineage: Krt5 (CK5), Krt8 (CK8), Krt18 (CK18), Krt14 (CK14), TP63, and Cdh1 (E-cadherin); mesenchymal lineage: Vim (vimentin), Cdh2 (N-cadherin), Acta2 (α-smooth muscle actin); progenitor: Itga6 (α6 integrin), Sox2, and Notch1; and prostate growth/differentiation: Myc, Sox9 genes. An immortalized basal phenotype (CK5+/TP63+) cell line derived from wild-type prostate is shown for comparison. Clone 2 showed a predominantly luminal epithelial expression pattern without evidence of Vim or Acta2 expression. Interestingly, Clone 2 expressed both Cdh1and Cdh2 as well as relatively elevated levels of Myc RNA (Figure 5A). As anticipated, Clone 2 cells demonstrated phospo-AKT and AR protein expression (Figure 5B).
Figure 5.
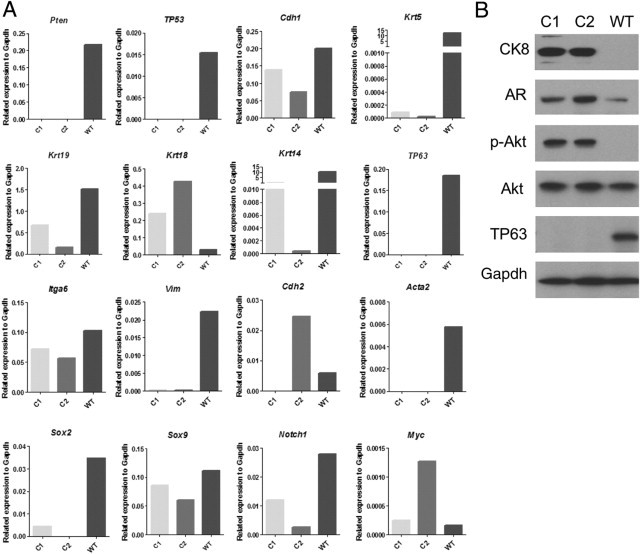
Expression of differentiation and signaling markers in cultured wild-type prostatic basal cells (WT) (Materials and Methods) and in Pten/TP53 deleted Clones 1 (C1) and 2 (C2) prostatic carcinoma cell lines. A: Quantitative RT-PCR analysis of mRNA levels for various markers. B: Immunoblot analysis for selected markers. pAKT, AKT phosphorylated on Ser 473.
Clone 2 cells gave rise to orthotopic tumors that were primarily sarcomatoid carcinomas with occasional foci of adenocarcinoma (Figure 6; see also Supplemental Figure S3, C and D, at http://ajp.amjpathol.org). Orthotopic carcinomas generally displayed diffuse, low to moderate levels of cytoplasmic synaptophysin expression. Three Clone 2 orthotopic tumors harvested at 6 weeks comprised primarily adenocarcinoma containing a minority component of undifferentiated/early sarcomatoid carcinoma, whereas tumors harvested between 9 and 12 weeks comprised a majority of sarcomatoid carcinomas with occasional small foci of poorly differentiated adenocarcinoma, demonstrating increasing EMT with time and expansion of orthotopic tumors. Tumors cells that coexpressed CK8 and vimentin were readily observed (see Supplemental Figure S3C at http://ajp.amjpathol.org). Osseous and cartilaginous metaplasia were common in Clone 2 orthotopic tumors (Table 3; see also Supplemental Figure S3D at http://ajp.amjpathol.org). Clone 2 rarely metastasized (Table 3); however, lymphovascular invasion was common, and tumor emboli were occasionally observed in pulmonary capillaries, similar to the phenotype observed in late stages of the primary mouse model (see Supplemental Figure S3, A and B, at http://ajp.amjpathol.org).
Figure 6.
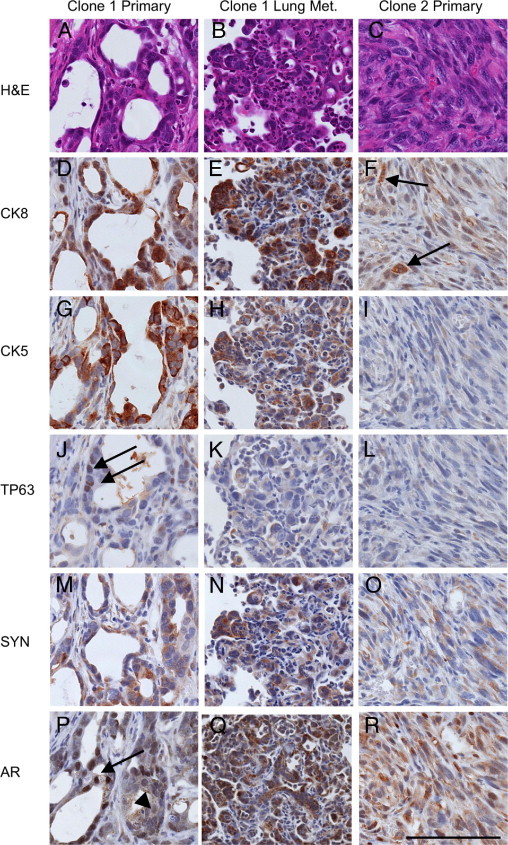
Clonal orthotopic PB-Cre4+; Ptenfl/fl;TP53fl/fl carcinomas demonstrate multilineage differentiation, metastasis, and epithelial to mesenchymal transition. Sequential serial sections of a representative Clone 1 orthotopic prostate carcinoma (left column), a Clone 1 lung metastasis originating from this same primary carcinoma (middle column), and a Clone 2 sarcomatoid carcinoma (right column), staining with H&E (A–C) or IHC (D–R) for cytokeratin 8 (CK8), cytokeratin 5 (CK5), TP63, synaptophysin (SYN), and androgen receptor (AR). A: Clone 1 gives rise to adenosquamous carcinomas (A) with heterogeneous luminal cytokeratin 8 (CK8) expression (D) and basal cytokeratin 5 (CK5) expression (G). J: Definitive basal cells express nuclear TP63 (arrows in J). M: Heterogeneous synaptophysin (SYN) expression is observed in both adenocarcinoma and squamous portions of Clone 1 orthotopic tumors. P: Androgen receptor expression is heterogeneous ranging from strong nuclear expression (arrow) to weak nuclear and cytoplasmic expression (arrowhead). B: Clone 1 orthotopic tumors commonly metastasize to the lungs where metastases display either a luminal phenotype or are biphenotypic. Luminal phenotype lung metastasis that coexpresses CK8 (E) and CK5 (H) but not TP63 (K). N: Synaptophysin expression is common in Clone 1 lung metastases. Q: Androgen receptor expression in lung metastasis is generally low in the nucleus, yet high in the cytoplasm. C: Clone 2 orthotopic carcinomas undergo EMT to form sarcomatoid carcinomas with only occasional glandular differentiation. Sarcomatoid carcinomas lose cytokeratin expression leaving only occasional foci with weak CK8 expression (arrows in F). No CK5 (I) or TP63 (L) expression is observed. O: Weak cytoplasmic synaptophysin expression is common in clone 2 tumors. R: Androgen receptor expression is heterogeneous and generally lower in Clone 2, with most tumor cells having weak or absent nuclear expression, and low cytoplasmic expression. All images taken at similar resolution (×400). Scale bar = 100 μm.
Table 3.
Comparison of the Prostatic Carcinoma Phenotypes Derived from Orthotopically Transplanted Clone 1 and Clone 2 Cells
| Tumor histology | Clone 1 |
Clone 2 |
|
|---|---|---|---|
| Adenosquamous carcinoma |
Sarcomatoid > adenocarcinoma | ||
| +Androgen | −Androgen | ||
| Frequency of lung metastasis | 7/8 | 9/9 | 1/12 |
| Phenotype of metastasis | N/A | ||
| Luminal phenotype | 5/5 | 3/5 | |
| CK8+/CK5(+/−)/TP63− | |||
| Biphenotypic | 2/5 | 4/5 | |
| CK8+/CK5+/TP63+ | |||
| Osseous/cartilagenous metaplasia | 0/17 | 11/12 | |
Ten mice orthotopically injected with Clone 1 cells were selected for immunophenotyping of lung metastases. Lung metastases were scored as being of luminal phenotype (all cells in metastasis contain CK8 and/or CK5 and are negative for TP63) or as biphenotypic (all cells in metastasis contain CK8 and/or CK5 and at least one cell is positive for TP63); > = in Clone 2 orthotopic tumors, sarcomatoid carcinoma was the dominant histological pattern; +Androgen = subcutaneous androgen pellet was replenished at week 7 after orthotopic injection; −Androgen = subcutaneous androgen pellet was removed at week 7 after orthotopic injection.
N/A = not available (one mouse orthotopically injected with Clone 2 cells had a single small lung metastasis that did not appear in all three serial sections that were needed for immunophenotyping).
Analysis of Biphenotypic Clone 1 in Androgen-Replete and -Deprived Conditions
The initial characterization of Clone 1 at passage 4 demonstrated mostly double-positive CK5+/CK8+ cells (Table 2). As Clone 1 was cultured in vitro, CK5 expression decreased. At passage 25, Clone 1 cultures consisted of 95% CK8+/CK14+/CK5− cells and 5% CK8+/CK14+/CK5+ cells, and quantitative PCR analyses of the same culture revealed expression of luminal (Krt18) and basal (Krt14 with low levels of Krt5) cytokeratins but not the definitive basal marker TP63. Other basal/progenitor-associated markers such as Notch1, Sox2, and Itga6 were expressed (Figure 5A). Western blot analyses showed high constitutive levels of pAKT, detectable androgen receptor, and no detectable TP63 (Figure 5B).
Clone 1 subcutaneous tumors displayed adenocarcinoma histology and AR expression, two characteristics of human androgen–dependent prostate cancer. To analyze androgen-dependent growth and development of the castrate-resistant phenotype, Clone 1 orthotopic tumor growth was performed in androgen-replete conditions and in conditions that mimic patient treatment regimens giving rise to castrate-resistant prostate cancer. Specifically, before orthotopic injections of Clone 1 cells, mice were castrated and implanted with subcutaneous testosterone pellets. Orthotopic tumor growth was detected with in vivo bioluminescent imaging, usually between 4 and 6 weeks after inoculation. At 7 weeks after injection, mice were randomized into two cohorts. Testosterone pellets were removed from half of the mice (n = 9), whereas the remaining half (n = 8) underwent reimplantation with new testosterone pellets. Tumors were harvested at morbidity or death of individual animals in both cohorts. The removal of subcutaneous androgen pellets usually led to a temporary halt in orthotopic tumor growth and a reduction in tumor mass, as assayed by in vivo bioluminescent imaging and by manual palpation. Androgen deprivation led to a survival benefit, as the mice in which the testosterone pellets had been removed survived up to 15 weeks after injection, whereas all of the androgen-replete mice were moribund by week 9 after injection (Figure 7A). In addition, quantitative PCR analyses of RNA extracted from tumors revealed the loss of androgen-dependent gene expression in androgen-deprived mice, as shown for Nkx3.1 and Msmb in Figure 7B.
Figure 7.
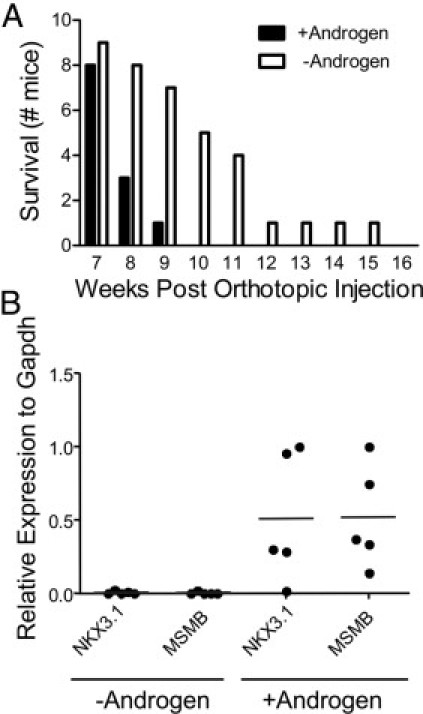
Androgen sensitivity and androgen independent tumor growth in PB-Cre4+; Ptenfl/fl;TP53fl/fl Clone 1 orthotopic prostate carcinomas. A: Androgen pellets were either replenished (+Androgen) or removed (-Androgen) at 7 weeks after orthotopic injection. Animals were removed from study when moribund. B: RNA samples extracted from Clone 1 tumors grown as described in A were assessed for Nkx3.1and Msmb expression levels by quantitative RT-PCR. Samples were normalized to Gapdh. The androgen-deprived tumors came from orthotopically injected mice that were euthanized between 19 and 33 days after the removal of subcutaneous androgen pellets. +Androgen, n = 5; -Androgen, n = 5.
Clone 1 orthotopic tumors grown in an androgen-replete environment were composed of both CK8+ adenocarcinoma and TP63+ basal/squamous carcinoma components, demonstrating biphenotypic differentiation (Figure 6). Synaptophysin expression in both adenocarcinoma and basal/squamous carcinoma was heterogeneous. In androgen-deprived tumors, there were often foci of fibrosis and chronic inflammation, indicative of tumor regression. However, Ki-67 IHC identified multifocal regions of proliferation consistent with androgen independent tumor growth (data not shown). Interestingly, the histological phenotypes of the androgen-deprived tumors were similar to the androgen-replete tumors with the exception of the amount and distribution of androgen receptor, which is discussed below (Figure 8). These data show that androgen deprivation of established tumors did not lead to the selective survival of either adenocarcinoma or basal/squamous carcinoma.
Figure 8.
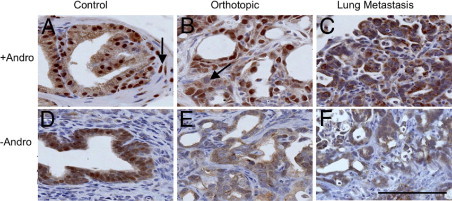
AR expression in Clone 1 orthotopic prostate carcinoma, recipient control prostate, and lung metastasis. Recipient nude mice had androgen pellets replenished (+Andro: A–C) or removed (-Andro: D–F) at week 7 after orthotopic injection. The tumor shown was taken from a mouse that survived 20 days after the androgen pellet was removed. A: Recipient dorsal prostate showing expression in epithelial cells and occasionally in stromal cells (arrow). B: Androgen-replete orthotopic carcinoma harvested 50 days after orthotopic injection, demonstrating strong nuclear expression and occasional reduced or absent expression (arrow). C: Lung metastasis from same mouse as in B. AR expression was primarily cytoplasmic with a granular appearance. AR expression decreased in (D) control (recipient) nude mouse prostate, (E) adjacent orthotopic carcinoma, and (F) lung metastasis. All images taken at ×400. Scale bar = 100 μm.
Clone 1 Metastases
Of interest, Clone 1 metastasized to the lungs in nine of nine androgen-deprived mice and in seven of eight androgen-replete mice (Table 3; see also Supplemental Table S1 at http://ajp.amjpathol.org). Lung metastases were immunophenotyped in five animals each from androgen-deprived and androgen-replete conditions. There was phenotypic cellular heterogeneity within individual metastases and among different metastases in the same mouse (see Supplemental Table S1 at http://ajp.amjpathol.org). All metastases contained CK8+ cells and displayed adenocarcinoma or an undifferentiated/solid carcinoma morphology. However, some metastatic colonies contained TP63+ cells, whereas others did not. There was an observable phenotypic variability in lung metastases comparing androgen-deprived and androgen-replete conditions, shown in Table 3 as a fraction of mice harboring at least one metastatic lesion of the indicated phenotype. Quantification of total metastases with respect to immunophenotype demonstrated a statistically significant increase in the total number of metastases containing TP63+ cells in androgen-deprived mice (see Supplemental Table S1 at http://ajp.amjpathol.org). Therefore, it appears that androgen deprivation effected either the selection of or differentiation of metastasis-initiating cells. The number of lung metastases per mouse was not statistically significantly different as a result of androgen deprivation (see Supplemental Table S1 at http://ajp.amjpathol.org), although this may be due to prior metastatic seeding and the presence of a significant tumor burden at the time of androgen withdrawal.
An interesting phenotypic difference between primary tumors and lung metastases was observed with respect to AR staining patterns. Androgen-replete orthotopic carcinomas displayed heterogeneous nuclear AR levels, ranging from high levels to significantly reduced levels and occasional nuclei with undetectable AR (Figure 8). Remarkably, lung metastases that developed in animals with implanted testosterone pellets had minimal levels of nuclear AR as compared with the primary tumors, implying distinct AR-dependent signaling in primary tumors as compared with metastases, even under androgen-replete conditions (Figure 8C). As expected for androgen deprivation, nuclear AR levels in orthotopic tumors and in nude mouse recipient prostates were markedly reduced, accompanied by an increase in granular cytoplasmic labeling (Figure 8, D–F). Androgen-deprived lung metastases usually had overall reduced levels of total AR, with minimal to undetectable nuclear AR levels and low granular cytoplasmic expression levels. These data suggest that the metastatic cells have a distinct and possibly reduced AR-dependent signaling program relative to the primary tumor.
Discussion
Loss of PTEN and loss of TP53 are common genetic aberrations in human prostate cancer.3 A major finding described here from the pathological analysis of the PB-Cre4+; Ptenfl/fl;TP53fl/fl model of prostate cancer is the time-dependent development of heterogeneous histologies. This most likely reflects the synergistic effect of Pten and TP53 loss on increased prostate epithelial progenitor/stem cell self-renewal and differentiation plasticity. The significant intertumoral and intratumoral morphological and lineage heterogeneity described here for the PB-Cre4+; Ptenfl/fl;TP53fl/fl model has not been observed in PB-Cre4+;Ptenfl/fl mice by us or by others.20
The tumor suppressor TP53 functions pleiotropically in cells to negatively regulate growth through a variety of mechanisms including increased senescence, which previously was shown to be significantly decreased in PB-Cre4+; Ptenfl/fl;TP53fl/fl prostate tumors.14 More recently it has been appreciated that TP53 plays an important role in the proliferation and differentiation of stem/progenitor cells.14,21,22 TP53 inhibits self-renewal in nontransformed and transformed somatic stem cells, and we have demonstrated that Pten/TP53 null prostate progenitors have significantly increased self-renewal ability in vitro.15 These data suggest that the rapid growth and aggressive nature of the carcinoma in the PB-Cre4+; Ptenfl/fl;TP53fl/fl model is due not only to decreased senescence in bulk differentiated tumor cells but also to increased progenitor amplification.
TP53 also suppresses pluripotency and cellular dedifferentiation in induced pluripotent stem (iPS) cells.22 In neural stem cells, the combined effects of losing PTEN and TP53 lead to impaired differentiation, although loss of either gene alone is insufficient for such a phenotype.23 Similarly in the PB-Cre4+; Ptenfl/fl;TP53fl/fl model, at least some tumor-initiating cells demonstrate multipotency and/or differentiative plasticity. On orthotopic transplantation, clonally derived TP63-negative Clone 1 cells gave rise to TP63+ basal and TP63-negative luminal phenotype tumor cells with focal neuroendocrine marker expression. These data imply either the transformation of a bipotential progenitor or plasticity of a committed progenitor to dedifferentiate. Lineage marking studies in normal prostates have demonstrated that the development of most TP63-negative luminal epithelial cells involves a TP63+ precursor.24 However, studies of clonal, immortalized human prostate cancer cell lines are similar to the results described here.25 That is, clonal human TP63-negative tumor-derived cells gave rise to tumors containing cells of multiple lineages, including TP63+ cells. Taken together, we suggest that TP53 loss of function in prostate cancer contributes not only to abnormal cell cycle control but also to increased differentiative plasticity of the tumor cells. The origin of the increased plasticity may be stochastic or, alternatively, may be a result of transformation of a progenitor that precedes TP63+ basal cells in lineage commitment.
We also have presented evidence that sarcomatoid carcinomas develop from CK8+ prostate epithelial cells in the PB-Cre4+; Ptenfl/fl;TP53fl/fl model. Given the previous observation that TP53 loss in the context of Pten deletion results in decreased senescent markers in carcinoma cells, it is of interest to note that the bypass of senescence and the acquisition of an EMT phenotype have been correlated.14,26,27 In other model systems, loss of senescence was attributed to oncogenic signaling acting in concert with transcription factors, such as TWIST and ZEB1, that are known to regulate EMT. Therefore, it will be relevant to determine in the PB-Cre4+; Ptenfl/fl;TP53fl/fl model whether transcription factors that regulate sarcomatoid carcinoma development at late stages initially inhibit senescence in adenocarcinoma.
We observed osteogenic elements in some primary sarcomatoid carcinomas and in almost all Clone 2 orthotopic carcinomas. Human sarcomatoid carcinoma of the prostate is a rare but aggressive disease with poor prognosis.28 The human tumors share many histological characteristics with the murine tumors described here. These include diverse epithelial lineages, including basal and neuroendocrine phenotypes, as well as heterologous elements such as osteosarcoma and chondrosarcoma. TP53 has been demonstrated to control the proliferation and differentiation of mesenchymal stem cells, with loss of TP53 leading to accelerated differentiation toward osteogenic lineages.29 It is possible that the loss of TP53 in PB-Cre4+; Ptenfl/fl;TP53fl/fl epithelial cells predisposes EMT-derived mesenchymal cells to differentiate toward osteo- and/or chondrogenic cells.
The development of a murine model of prostate cancer metastasis is important, given the lack of models for advanced disease. Using pathological analyses of PB-Cre4+; Ptenfl/fl;TP53fl/fl animals with end-stage disease and bioluminescent imaging of transplanted tumor cells, we observed lympho-vascular invasion and individual tumor cells and emboli in pulmonary capillaries. However, we conclude that the deletion of Pten and TP53 in prostate epithelial cells is not sufficient to allow metastatic colonization. Sarcomatoid carcinomas were rarely metastatic from primary tumors or after orthotopic growth of Clone 2. Similar invasive but nonmetastatic phenotypes for murine mammary EMT-phenotype tumors have been described.30 Although the ability to undergo EMT correlates with progression and metastasis in various experimental models, it is important to distinguish reversible, or transient, EMT from the apparently irreversible EMT that occurs in sarcomatoid carcinoma. A reasonable hypothesis is that terminal mesenchymal differentiation that occurs in sarcomatoid carcinoma is associated with a loss of the ability to undergo a mesenchymal-to-epithelial transition that contributes to metastatic colonization.
A significant finding was that Clone 1, which produces biphenotypic tumors containing adenocarcinoma and basal/squamous carcinoma, is highly metastatic, most likely as a result of additional acquired genetic or epigenetic alterations. Immunophenotypic analysis of Clone 1 lung metastases demonstrated that they were either of a transit amplifying/luminal phenotype (CK8+/CK5(+/−)/TP63−) or were biphenotypic, containing metastases with both TP63+ and TP63− cells. The relative abundance of these two metastatic phenotypes changed depending on the androgen status of the mouse, with an increased percentage of biphenotypic metastases in androgen-deprived animals (Table 3; see also Supplemental Table S1 at http://ajp.amjpathol.org). This suggests that androgen deprivation in this model selects for the growth and/or differentiation of cells with basal lineage commitment. Although human prostate cancer metastases rarely contain TP63+ cells, the demonstration that metastasis-initiating cells have differentiative plasticity driven by androgen deprivation suggests the possibility that a related mechanism is a contributing factor to the development of castrate-resistant prostate cancer. Interestingly, metastases demonstrated reduced nuclear AR compared with most regions of the primary orthotopic tumor, and the role of AR-dependent signaling in metastatic colonization is of interest for future studies. A clonal prostate carcinoma cell line with multiepithelial lineage differentiation potential and a high metastatic rate will be useful for studying the molecular mechanisms driving androgen-independent growth and prostate cancer metastasis.
Acknowledgments
We thank the NIH/NCI/Cell and Cancer Biology Branch Confocal Microscopy Core for their assistance.
Footnotes
Supported by the Intramural Research Program of the National Cancer Institute, National Institutes of Health.
Supplemental material for this article can be found at http://ajp.amjpathol.org or at doi: 10.1016/j.ajpath.2011.03.035.
Current address of D.C., Arizona Cancer Center, Tucson, Arizona.
Supplementary data
Co-expression of the neuroendocrine marker synaptophysin (Syn) and cytokeratin 8 (CK8) in primary PB-Cre4+; Ptenfl/fl; TP53 fl/fl prostate carcinoma; and orthotopic prostate carcinoma. A:PB-Cre4+; Ptenfl/fl; TP53 fl/fl mouse primary prostate carcinomas have occasional regions where tumor cells coexpress synaptophysin and CK8. B: Focus of synaptophysin and CK8 expression in orthotopic prostate carcinoma resulting from the injection of single-cell suspension of PB-Cre4+; Ptenfl/fl; TP53 fl/fl mouse primary prostate carcinoma cells into the dorsal prostatic lobe of a nude mouse. Double immunofluorescence with anti-synaptophysin (Red; Alexa Fluor 586) and anti-CK8 (Green; Alexa Fluor 488), DAPI counterstain Images at 200×.. Scale bar = 100 μm.
Epithelial to mesenchymal transition marker expression in sacromatoid carcinoma. A–C: SLUG expression in wild-type mouse prostate (A) and in an individual 28-week-old PB-Cre4+; Ptenfl/fl; TP53 fl/fl mouse primary prostate tumor (B and C) containing regions of mouse prostatic intraepithelial neoplasia (mPIN), adenocarcinoma, and sacromatoid carcinoma. A: Wild-type mouse prostate with low levels of slug expression in basal cells (arrowheads). B: Slug is expressed in mPIN basal cells (arrows) and in adjacent sacromatoid carcinoma (S). C: Adenocarcinomas were generally negative for SLUG expression. Scale bar = 100 μm (A–C) Images taken at ×400. D: CK8 (Green; Alexa Fluor 488) and vimentin (Red; Alexa Fluor 586) double immunofluorescence with DAPI counterstain demonstrating CK8 and vimentin (Vim) coexpression in a large multinucleated tumor cell within a region of sacromatoid carcinoma in the same tumor as in B and C; Image taken at ×630. Scale bar = 20 μm. E: SLUG IHC and hematoxylin counterstain in Clone 2 orthotopic carcinoma containing regions of adenocarcinoma and sarcomatoid carcinoma. SLUG expression is rare in adenocarcinoma (arrow), however, is high in surrounding sacromatoid carcinoma (S). Image taken at ×200. Scale bar = 200 μm.
Characterization of orthotopic prostatic carcinomas from Clone 2, including bioluminescent imaging of lymphovascular invasion, epithelial to mesenchymal transtition, and osseous metaplasia. A:Ex vivo bioluminescent imaging of nude mouse orthotopically injected with Clone 2 cells demonstrates bioluminescent prostate carcinoma cells in sublumbar lymph node (arrow) as well as in the lungs (arrowhead). Orthotopic prostate carcinomas were removed prior to ex vivo imaging in order to enhance sensitivity, as the high bioluminescent signal often obscures small signals originating from regional or distant tumor cells. There is a bioluminescent signal at the site of the removed orthotopic tumor demonstrating the presence of residual tumor cells (asterisk). B: Histopathological analysis of the lungs from the mouse in A demonstrating that the pulmonary bioluminescent signal is due to circulating tumor cells and tumor emboli (arrow), and not from actual metastases Image taken at ×400. Scale bar = 20 μm. C: CK8 (Green; Alexa Fluor 488) and vimentin (Red; Alexa Fluor 586) double immunofluorescence with DAPI counterstain demonstrating several cells with CK8 and vimentin (Vim) coexpression in an orthotopic Clone 2 tumor (arrowheads); Image taken at ×400. Scale bar = 20 μm. D: Region of osseous metaplasia in Clone 2 orthotopic prostate carcinoma surrounding entrapped adenocarcinoma gland (arrow); H&E Image taken at ×200. Scale bar = 200 μm.
References
- 1.Roudier M.P., True L.D., Higano C.S., Vesselle H., Ellis W., Lange P., Vessella R.L. Phenotypic heterogeneity of end-stage prostate carcinoma metastatic to bone. Hum Pathol. 2003;34:646–653. doi: 10.1016/s0046-8177(03)00190-4. [DOI] [PubMed] [Google Scholar]
- 2.Sircar K., Yoshimoto M., Monzon F.A., Koumakpayi I.H., Katz R.L., Khanna A., Alvarez K., Chen G., Darnel A.D., Aprikian A.G., Saad F., Bismar T.A., Squire J.A. PTEN genomic deletion is associated with p-Akt and AR signalling in poorer outcome, hormone refractory prostate cancer. J Pathol. 2009;218:505–513. doi: 10.1002/path.2559. [DOI] [PubMed] [Google Scholar]
- 3.Taylor B.S., Schultz N., Hieronymus H., Gopalan A., Xiao Y., Carver B.S., Arora V.K., Kaushik P., Cerami E., Reva B., Antipin Y., Mitsiades N., Landers T., Dolgalev I., Major J.E., Wilson M., Socci N.D., Lash A.E., Heguy A., Eastham J.A., Scher H.I., Reuter V.E., Scardino P.T., Sander C., Sawyers C.L., Gerald W.L. Integrative genomic profiling of human prostate cancer. Cancer Cell. 2010;18:11–22. doi: 10.1016/j.ccr.2010.05.026. [DOI] [PMC free article] [PubMed] [Google Scholar]
- 4.Agell L., Hernandez S., de Muga S., Lorente J.A., Juanpere N., Esgueva R., Serrano S., Gelabert A., Lloreta J. KLF6 and TP53 mutations are a rare event in prostate cancer: distinguishing between Taq polymerase artifacts and true mutations. Mod Pathol. 2008;21:1470–1478. doi: 10.1038/modpathol.2008.145. [DOI] [PubMed] [Google Scholar]
- 5.Schlomm T., Iwers L., Kirstein P., Jessen B., Kollermann J., Minner S., Passow-Drolet A., Mirlacher M., Milde-Langosch K., Graefen M., Haese A., Steuber T., Simon R., Huland H., Sauter G., Erbersdobler A. Clinical significance of p53 alterations in surgically treated prostate cancers. Mod Pathol. 2008;21:1371–1378. doi: 10.1038/modpathol.2008.104. [DOI] [PubMed] [Google Scholar]
- 6.Weinberg R.A. Mechanisms of malignant progression. Carcinogenesis. 2008;29:1092–1095. doi: 10.1093/carcin/bgn104. [DOI] [PMC free article] [PubMed] [Google Scholar]
- 7.Goldstein A.S., Stoyanova T., Witte O.N. Primitive origins of prostate cancer: in vivo evidence for prostate-regenerating cells and prostate cancer-initiating cells. Mol Oncol. 2010;4:385–396. doi: 10.1016/j.molonc.2010.06.009. [DOI] [PMC free article] [PubMed] [Google Scholar]
- 8.Bubendorf L., Schopfer A., Wagner U., Sauter G., Moch H., Willi N., Gasser T.C., Mihatsch M.J. Metastatic patterns of prostate cancer: an autopsy study of 1,589 patients. Hum Pathol. 2000;31:578–583. doi: 10.1053/hp.2000.6698. [DOI] [PubMed] [Google Scholar]
- 9.Shah R.B., Mehra R., Chinnaiyan A.M., Shen R., Ghosh D., Zhou M., Macvicar G.R., Varambally S., Harwood J., Bismar T.A., Kim R., Rubin M.A., Pienta K.J. Androgen-independent prostate cancer is a heterogeneous group of diseases: lessons from a rapid autopsy program. Cancer Res. 2004;64:9209–9216. doi: 10.1158/0008-5472.CAN-04-2442. [DOI] [PubMed] [Google Scholar]
- 10.van Leenders G.J., Aalders T.W., Hulsbergen-van de Kaa C.A., Ruiter D.J., Schalken J.A. Expression of basal cell keratins in human prostate cancer metastases and cell lines. J Pathol. 2001;195:563–570. doi: 10.1002/path.993. [DOI] [PubMed] [Google Scholar]
- 11.Wang S., Garcia A.J., Wu M., Lawson D.A., Witte O.N., Wu H. Pten deletion leads to the expansion of a prostatic stem/progenitor cell subpopulation and tumor initiation. Proc Natl Acad Sci USA. 2006;103:1480–1485. doi: 10.1073/pnas.0510652103. [DOI] [PMC free article] [PubMed] [Google Scholar]
- 12.Korsten H., Ziel-van der Made A., Ma X., van der Kwast T., Trapman J. Accumulating progenitor cells in the luminal epithelial cell layer are candidate tumor initiating cells in a Pten knockout mouse prostate cancer model. PLoS One. 2009;4:e5662. doi: 10.1371/journal.pone.0005662. [DOI] [PMC free article] [PubMed] [Google Scholar]
- 13.Wang X., Kruithof-de Julio M., Economides K.D., Walker D., Yu H., Halili M.V., Hu Y.P., Price S.M., Abate-Shen C., Shen M.M. A luminal epithelial stem cell that is a cell of origin for prostate cancer. Nature. 2009;461:495–500. doi: 10.1038/nature08361. [DOI] [PMC free article] [PubMed] [Google Scholar]
- 14.Chen Z., Trotman L.C., Shaffer D., Lin H.K., Dotan Z.A., Niki M., Koutcher J.A., Scher H.I., Ludwig T., Gerald W., Cordon-Cardo C., Pandolfi P.P. Crucial role of p53-dependent cellular senescence in suppression of Pten-deficient tumorigenesis. Nature. 2005;436:725–730. doi: 10.1038/nature03918. [DOI] [PMC free article] [PubMed] [Google Scholar]
- 15.Abou-Kheir W., Hynes P.G., Martin P.L., Pierce R., Kelly K. Characterizing the contribution of stem/progenitor cells to tumorigenesis in the Pten+/−TP53+/− prostate cancer model. Stem Cells. 2010;28:2129–2140. doi: 10.1002/stem.538. [DOI] [PMC free article] [PubMed] [Google Scholar]
- 16.Jonkers J., Meuwissen R., van der Gulden H., Peterse H., van der Valk M., Berns A. Synergistic tumor suppressor activity of BRCA2 and p53 in a conditional mouse model for breast cancer. Nat Genet. 2001;29:418–425. doi: 10.1038/ng747. [DOI] [PubMed] [Google Scholar]
- 17.Cao Y.A., Bachmann M.H., Beilhack A., Yang Y., Tanaka M., Swijnenburg R.J., Reeves R., Taylor-Edwards C., Schulz S., Doyle T.C., Fathman C.G., Robbins R.C., Herzenberg L.A., Negrin R.S., Contag C.H. Molecular imaging using labeled donor tissues reveals patterns of engraftment, rejection, and survival in transplantation. Transplantation. 2005;80:134–139. doi: 10.1097/01.tp.0000164347.50559.a3. [DOI] [PubMed] [Google Scholar]
- 18.Yin J., Pollock C., Tracy K., Chock M., Martin P., Oberst M., Kelly K. Activation of the RalGEF/Ral pathway promotes prostate cancer metastasis to bone. Mol Cell Biol. 2007;27:7538–7550. doi: 10.1128/MCB.00955-07. [DOI] [PMC free article] [PubMed] [Google Scholar]
- 19.Shappell S.B., Thomas G.V., Roberts R.L., Herbert R., Ittmann M.M., Rubin M.A., Humphrey P.A., Sundberg J.P., Rozengurt N., Barrios R., Ward J.M., Cardiff R.D. Prostate pathology of genetically engineered mice: definitions and classification: The consensus report from the Bar Harbor meeting of the Mouse Models of Human Cancer Consortium Prostate Pathology Committee. Cancer Res. 2004;64:2270–2305. doi: 10.1158/0008-5472.can-03-0946. [DOI] [PubMed] [Google Scholar]
- 20.Wang S., Gao J., Lei Q., Rozengurt N., Pritchard C., Jiao J., Thomas G.V., Li G., Roy-Burman P., Nelson P.S., Liu X., Wu H. Prostate-specific deletion of the murine Pten tumor suppressor gene leads to metastatic prostate cancer. Cancer Cell. 2003;4:209–221. doi: 10.1016/s1535-6108(03)00215-0. [DOI] [PubMed] [Google Scholar]
- 21.Meletis K., Wirta V., Hede S.M., Nister M., Lundeberg J., Frisen J. p53 Suppresses the self-renewal of adult neural stem cells. Development. 2006;133:363–369. doi: 10.1242/dev.02208. [DOI] [PubMed] [Google Scholar]
- 22.Zhao T., Xu Y. p53 and Stem cells: new developments and new concerns. Trends Cell Biol. 2010;20:170–175. doi: 10.1016/j.tcb.2009.12.004. [DOI] [PubMed] [Google Scholar]
- 23.Zheng H., Ying H., Yan H., Kimmelman A.C., Hiller D.J., Chen A.J., Perry S.R., Tonon G., Chu G.C., Ding Z., Stommel J.M., Dunn K.L., Wiedemeyer R., You M.J., Brennan C., Wang Y.A., Ligon K.L., Wong W.H., Chin L., DePinho R.A. p53 and Pten control neural and glioma stem/progenitor cell renewal and differentiation. Nature. 2008;455:1129–1133. doi: 10.1038/nature07443. [DOI] [PMC free article] [PubMed] [Google Scholar]
- 24.Signoretti S., Pires M.M., Lindauer M., Horner J.W., Grisanzio C., Dhar S., Majumder P., McKeon F., Kantoff P.W., Sellers W.R., Loda M. p63 regulates commitment to the prostate cell lineage. Proc Natl Acad Sci USA. 2005;102:11355–11360. doi: 10.1073/pnas.0500165102. [DOI] [PMC free article] [PubMed] [Google Scholar]
- 25.Gu G., Yuan J., Wills M., Kasper S. Prostate cancer cells with stem cell characteristics reconstitute the original human tumor in vivo. Cancer Res. 2007;67:4807–4815. doi: 10.1158/0008-5472.CAN-06-4608. [DOI] [PubMed] [Google Scholar]
- 26.Ansieau S., Bastid J., Doreau A., Morel A.P., Bouchet B.P., Thomas C., Fauvet F., Puisieux I., Doglioni C., Piccinin S., Maestro R., Voeltzel T., Selmi A., Valsesia-Wittmann S., Caron de Fromentel C., Puisieux A. Induction of EMT by twist proteins as a collateral effect of tumor-promoting inactivation of premature senescence. Cancer Cell. 2008;14:79–89. doi: 10.1016/j.ccr.2008.06.005. [DOI] [PubMed] [Google Scholar]
- 27.Smit M.A., Peeper D.S. Deregulating EMT and senescence: double impact by a single twist. Cancer Cell. 2008;14:5–7. doi: 10.1016/j.ccr.2008.06.012. [DOI] [PubMed] [Google Scholar]
- 28.Hansel D.E., Epstein J.I. Sarcomatoid carcinoma of the prostate: a study of 42 cases. Am J Surg Pathol. 2006;30:1316–1321. doi: 10.1097/01.pas.0000209838.92842.bf. [DOI] [PubMed] [Google Scholar]
- 29.Molchadsky A., Shats I., Goldfinger N., Pevsner-Fischer M., Olson M., Rinon A., Tzahor E., Lozano G., Zipori D., Sarig R., Rotter V. p53 Plays a role in mesenchymal differentiation programs, in a cell fate dependent manner. PLoS One. 2008;3:e3707. doi: 10.1371/journal.pone.0003707. [DOI] [PMC free article] [PubMed] [Google Scholar]
- 30.Cardiff RD: The pathology of EMT in mouse mammary tumorigenesis. J Mammary Gland Biol Neoplasia 15:225–233 [DOI] [PMC free article] [PubMed]
Associated Data
This section collects any data citations, data availability statements, or supplementary materials included in this article.
Supplementary Materials
Co-expression of the neuroendocrine marker synaptophysin (Syn) and cytokeratin 8 (CK8) in primary PB-Cre4+; Ptenfl/fl; TP53 fl/fl prostate carcinoma; and orthotopic prostate carcinoma. A:PB-Cre4+; Ptenfl/fl; TP53 fl/fl mouse primary prostate carcinomas have occasional regions where tumor cells coexpress synaptophysin and CK8. B: Focus of synaptophysin and CK8 expression in orthotopic prostate carcinoma resulting from the injection of single-cell suspension of PB-Cre4+; Ptenfl/fl; TP53 fl/fl mouse primary prostate carcinoma cells into the dorsal prostatic lobe of a nude mouse. Double immunofluorescence with anti-synaptophysin (Red; Alexa Fluor 586) and anti-CK8 (Green; Alexa Fluor 488), DAPI counterstain Images at 200×.. Scale bar = 100 μm.
Epithelial to mesenchymal transition marker expression in sacromatoid carcinoma. A–C: SLUG expression in wild-type mouse prostate (A) and in an individual 28-week-old PB-Cre4+; Ptenfl/fl; TP53 fl/fl mouse primary prostate tumor (B and C) containing regions of mouse prostatic intraepithelial neoplasia (mPIN), adenocarcinoma, and sacromatoid carcinoma. A: Wild-type mouse prostate with low levels of slug expression in basal cells (arrowheads). B: Slug is expressed in mPIN basal cells (arrows) and in adjacent sacromatoid carcinoma (S). C: Adenocarcinomas were generally negative for SLUG expression. Scale bar = 100 μm (A–C) Images taken at ×400. D: CK8 (Green; Alexa Fluor 488) and vimentin (Red; Alexa Fluor 586) double immunofluorescence with DAPI counterstain demonstrating CK8 and vimentin (Vim) coexpression in a large multinucleated tumor cell within a region of sacromatoid carcinoma in the same tumor as in B and C; Image taken at ×630. Scale bar = 20 μm. E: SLUG IHC and hematoxylin counterstain in Clone 2 orthotopic carcinoma containing regions of adenocarcinoma and sarcomatoid carcinoma. SLUG expression is rare in adenocarcinoma (arrow), however, is high in surrounding sacromatoid carcinoma (S). Image taken at ×200. Scale bar = 200 μm.
Characterization of orthotopic prostatic carcinomas from Clone 2, including bioluminescent imaging of lymphovascular invasion, epithelial to mesenchymal transtition, and osseous metaplasia. A:Ex vivo bioluminescent imaging of nude mouse orthotopically injected with Clone 2 cells demonstrates bioluminescent prostate carcinoma cells in sublumbar lymph node (arrow) as well as in the lungs (arrowhead). Orthotopic prostate carcinomas were removed prior to ex vivo imaging in order to enhance sensitivity, as the high bioluminescent signal often obscures small signals originating from regional or distant tumor cells. There is a bioluminescent signal at the site of the removed orthotopic tumor demonstrating the presence of residual tumor cells (asterisk). B: Histopathological analysis of the lungs from the mouse in A demonstrating that the pulmonary bioluminescent signal is due to circulating tumor cells and tumor emboli (arrow), and not from actual metastases Image taken at ×400. Scale bar = 20 μm. C: CK8 (Green; Alexa Fluor 488) and vimentin (Red; Alexa Fluor 586) double immunofluorescence with DAPI counterstain demonstrating several cells with CK8 and vimentin (Vim) coexpression in an orthotopic Clone 2 tumor (arrowheads); Image taken at ×400. Scale bar = 20 μm. D: Region of osseous metaplasia in Clone 2 orthotopic prostate carcinoma surrounding entrapped adenocarcinoma gland (arrow); H&E Image taken at ×200. Scale bar = 200 μm.