Abstract
An important goal in clinical cardiology is the non-invasive quantification of regional cardiac deformation. While many methods have been proposed for the estimation of 3D left ventricular deformation and strains derived from 4D ultrasound, currently there is a lack of in vivo clinical validation of these algorithms on humans. In this paper, we describe the experiments used in validating cardiac deformation and strain estimates of 4D ultrasound using correlation-based optical flow tracking on two different COPD patients with normal left ventricular function. Validation of the algorithm was done by 1) validation of cardiac volume across multiple scans of the same patient and 2) validation of the repeatability of cardiac displacement and strain results from multiple scan acquisitions of the same patient. The preliminary results are encouraging with our algorithm producing consistent cardiac volume and strain results across multiple acquisitions. Furthermore, our derived 4D cardiac strains showed qualitatively correct results. We also observed particularly interesting results in the radial displacements of the posterior and lateral walls of our COPD patients.
I. Introduction
An important goal in clinical cardiology is the noninvasive quantification of regional cardiac deformation. The clinical cardiology community has begun to embrace the use of cardiac strain in their analysis for this purpose [1]. To properly calculate cardiac strain, the use of an imaging modality with high temporal resolution is needed. Real-Time Three-Dimensional (or RT3D, 4D) echocardiography is becoming increasingly attractive because of its ability to acquire full three-dimensional images of the heart over a full cardiac cycle within a few seconds. The complex 3D wall motion and temporal information contained in these four-dimensional (3D + time) data sequences has the potential to greatly enhance clinical diagnoses of the heart [2].
Currently, clinical evaluation of 3D ultrasound is performed via interactive inspection of acquired data along selected projection planes. This process is both cumbersome and time consuming. Furthermore, it ignores a great deal of information that exists in the evolution of the entire 3D cardiac volume over time. For example, quantitative four-dimensional analysis of the endocardial surface and computation of local fractional shortening has been shown to be effective in the diagnosis of regional ischemia [3]. Thus, it is highly desirable to have quantitative analysis and visualization tools that can help the clinician in the evaluation of these datasets [4].
While many methods have been proposed for the estimation of 3D left ventricular deformation and strains [5, 6], the in vivo validation of these results is an extremely important but often neglected aspect of this area. Multiple groups have validated the ability of 4D Ultrasound to measure phantom and canine cardiac deformations [5, 7–9]. However, there currently is not any clinical validation of 4D ultrasound strain measurements. In this paper we describe the experiments used to validate cardiac deformation and strain estimates of RT3D ultrasound using a correlation-based optical flow tracking method. We validated the algorithm by 1) validation of cardiac volume across multiple scans of the same patient and 2) validation of the repeatability of cardiac displacement and strain results from multiple scan acquisitions of the same patient.
II. Methods
A. Clinical Data Acquisition
The datasets used in the experiments detailed in this paper were acquired using a Siemens ACUSON SC2000™ with a 4Z1c transducer (Siemens, Mountain View, CA) by two cardiologists from two COPD patients. The 3D-probe was placed in the left parasternal / apex region at 2nd to 5th intercoastal space as is customary of cardiac ultrasound. Each acquisition consisted of one or two cardiac cycles gated by ECG leads. Multiple acquisitions were taken during one examination, and a subset of these acquisitions were chosen based on image quality and analyzed. COPD patients will be referred to anonymously in this paper as AP0490 and AP0574. Both were determined to have normal left ventricular ejection fractions. The focus depth of images ranged from 140 to 160 mm.
B. Data Conversion and Denoising
The ACUSON SC2000 uses a matrix phased-array transducer to acquire an entire three-dimensional volume in spherical coordinates along lines tiled in azimuth and elevation angles at incremental depth. Siemens AG provided us with a proprietary utility that allows us access to the un-down-sampled rho-theta information as collected by the transducer. A fast tri-cubic interpolation algorithm was developed to convert the polar signal into Cartesian data (unpublished). The polar signal was down-sampled to 50% of sampling frequency due to constraints on speed and dataset size (Figure 2.1). Voxel size is approximately 0.77 mm × 0.77 mm × 0.77 mm. Analysis was performed showing that this down-sampling does not affect the final strain measurement results (unpublished). Since optical flow is particularly sensitive to speckle tracking pattern, the resulting Cartesian data was then filtered with an edge preserving anisotropic diffusion smoothing algorithm [10].
Fig. 2.1.
Three cardiac views in (a) coronal plane, (b) sagittal plane, and (c) axial plane of the volumetric ultrasound data set at 50% sampling frequency.
C. Semi-automatic Segmentation of Myocardium
Manual tracing of LV epicardium and endocardium borders were performed by trained experts slice by slice in the short-axis plane to generate a binary mask of the myocardium. Typically 120–150 short axis planes have to be manually segmented in order to initialize the algorithm. It is important to note that that since every point in the myocardium will be individually tracked by the optical flow algorithm described in the next section, the exact border of the epicardium or the endocardium are not necessary for the algorithm to generate consistent results.
D. Correlation-Based Optical Flow Tracking
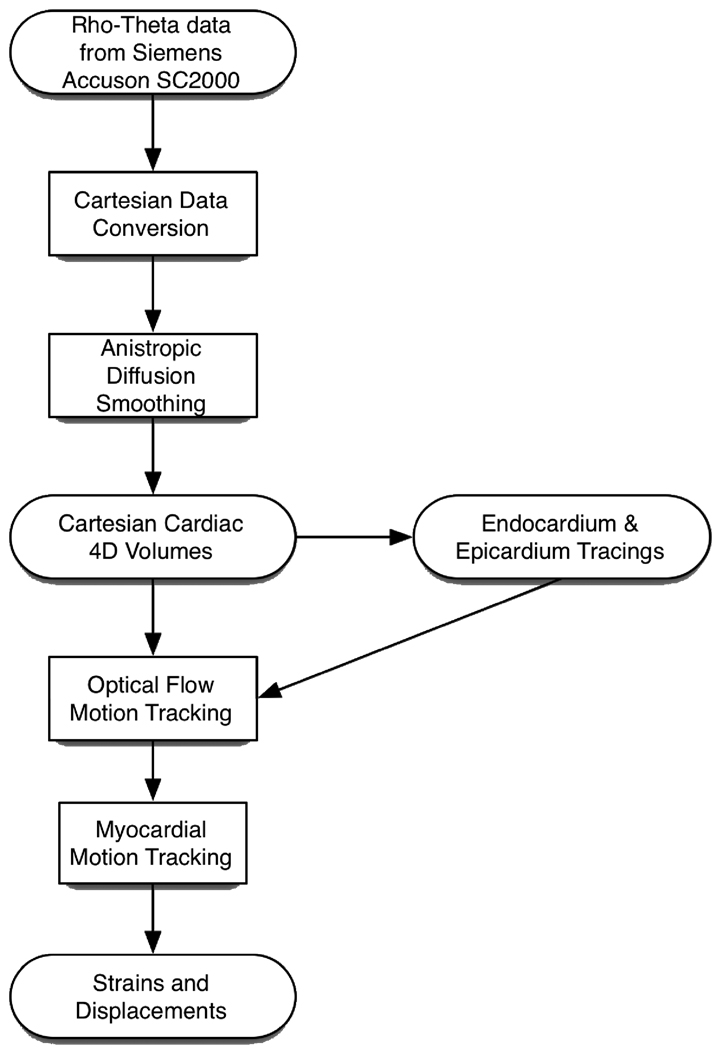
In optical flow, motion of an object is characterized by tracking the flow of pixels with similar intensity. Our correlation-based optical flow strain estimation framework has been successfully applied in the past for endocardium, epicardium and myocardium tracking when compared to manual tracing by expert cardiologists and sonomicrometry [5, 7, 8]. In canine studies performed by several groups, the ultrasound datasets were obtained by placing the ultrasound probe directly at the apex of the heart [8, 9], a luxury that we do not have when collecting data from clinical patients. In this study, we validated the tracking of the endocardium and myocardium in cardiac datasets acquired from COPD patients with normal cardiac ejection fractions. The optical flow tracking of the myocardium allows for the computation of the myocardial motion field. The motion field then allows the calculation of several dynamic cardiac metrics of clinical relevance including displacements and strains for the whole cardiac cycle. A flowchart of the computational framework is shown in Figure 2.2 below.
Figure 2.2.
Flowchart from data acquisition to strain computation.
III. Results
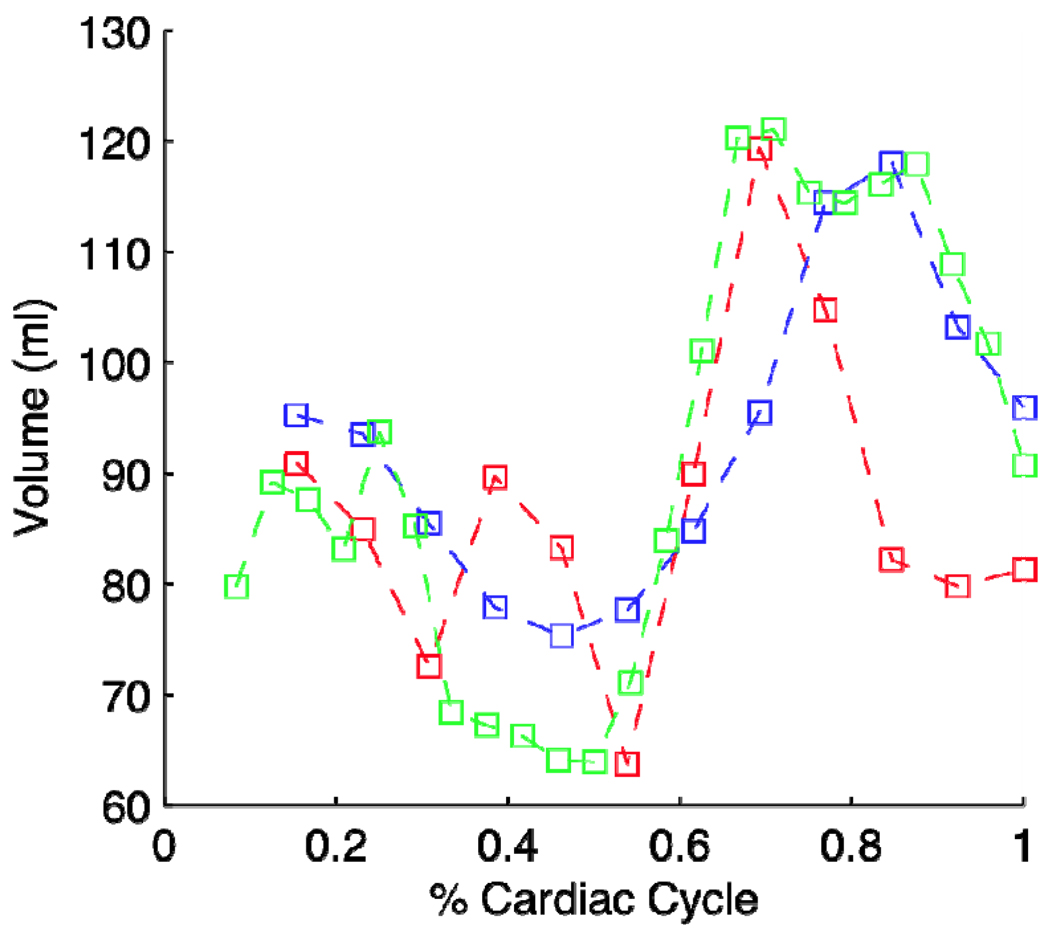
Three different cardiac cycles were analyzed from COPD patient AP0490 with LV volume calculated. The three volumes as computed from 3 different scan acquisitions yield very close agreements which is shown in Figure 3.1. Indeed, the volumes generated were all within normal bounds of left ventricular function [5]. Scan acquisition 2 (red curve) showed an increase in volume during systole which is yet unexplained. Further processing is currently in progress to determine the cause of this aberration.
Figure 3.1.
Results of 3 cardiac volumes as computed from 3 different acquisitions during one examination of a COPD patient (AP0490).
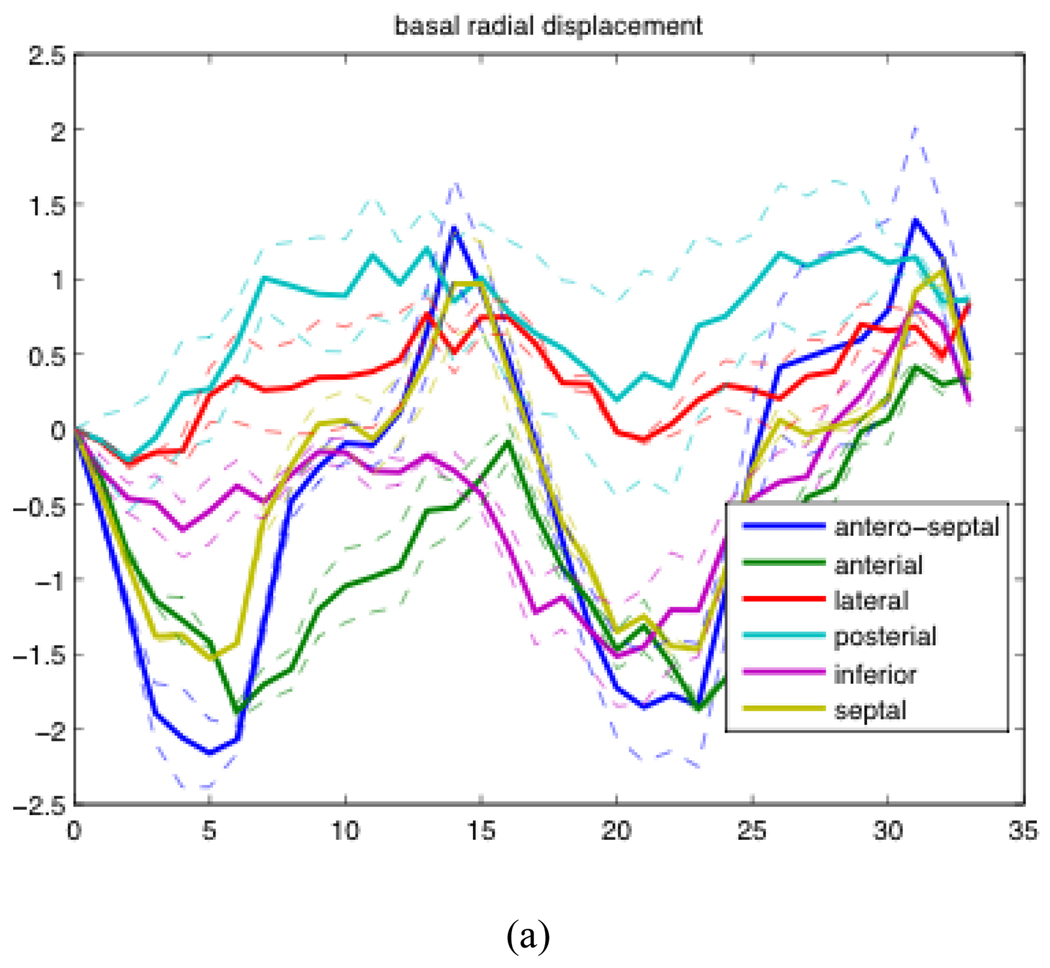
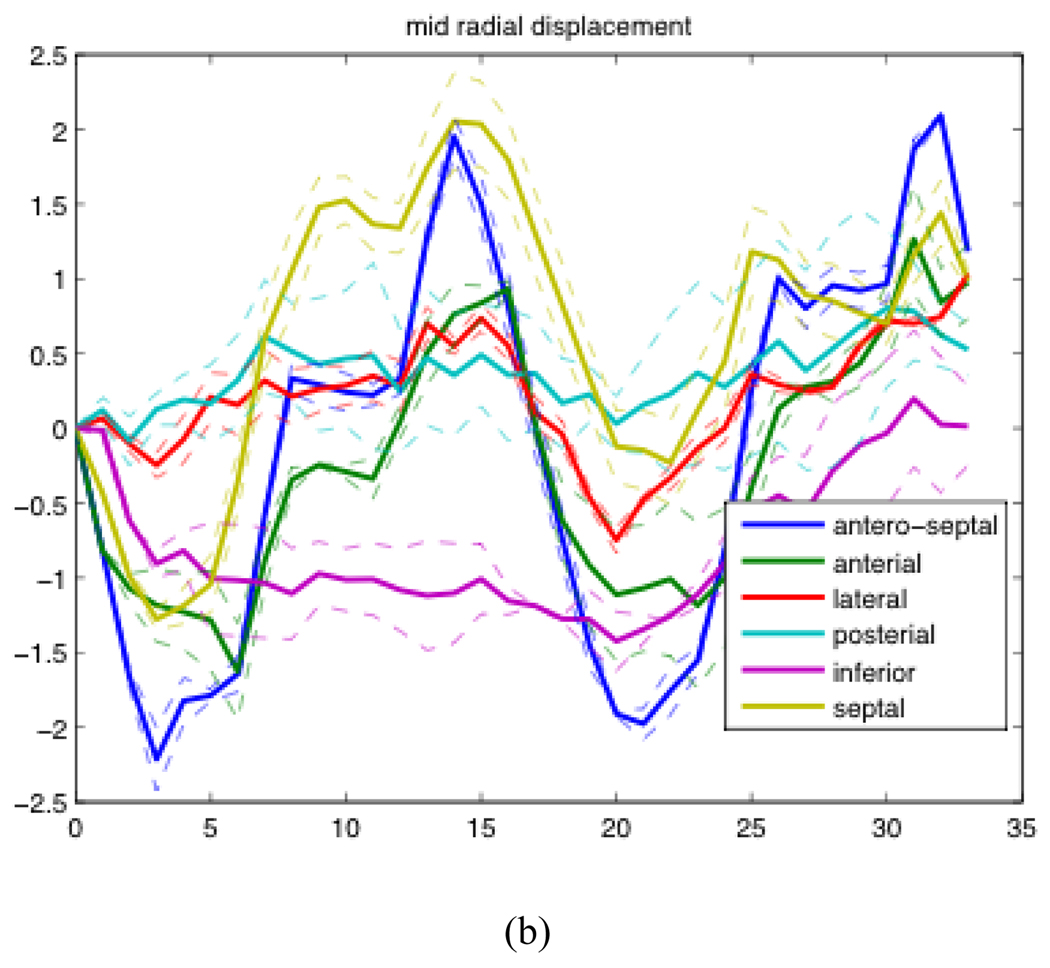
Examples of radial displacement temporal profiles over two cardiac cycles of patient AP0574 are shown in Figure 3.2. The solid lines represent the average of results generated from the analysis of 5 different acquisitions. The dashed lines represent the first quartile and third quartile of the 5 acquisitions.
Figure 3.2.
Mean, first quartile, and third quartile temporal profiles of radial displacement of one patient over the course of two cardiac cycles. (a) The radial displacement of the base of the heart averaged over 6 sections expressed in cm (b) The radial displacement of the mid region of the heart averaged over 6 sections expressed in cm.
Looking at Figure 3.2, we were able to observe that the posterior wall and lateral walls both have much smaller displacements than the other regions at the base of the heart, and a similar but less visible pattern could be seen in the mid section of the heart as well. We observed a much smaller decrease in relative displacement from the other patient that was processed thus far. We are currently working to analyze more patients to see if this phenomenon is indeed consistent across the entire COPD population. A recent clinical study has suggested that left ventricular function is almost certainly affected by COPD, even when left ventricular eject fraction is within normal tolerances [11]. This result is the first potential direct measurements of this effect.
IV. Discussion & Conclusion
In this paper, we validated our 4D cardiac strain estimation method on two clinical patients. We were able to show our estimation method produces both qualitatively correct results and generate consistent results between multiple acquisitions, both important characteristics of any estimation method that is to be used in a clinical setting. Furthermore, we were able to detect potentially clinically significant results from the posterior and lateral walls of the heart of COPD patients. Further studies are needed to verify whether this phenomenon can be consistently detected by 4D ultrasound in many COPD patients.
While 4D cardiac strain estimation using 4D ultrasound is a fairly new modality, the estimation of cardiac strain from 4D MRI data has been used in development for more than 2 decades [12, 13]. For quantitative validation of our strain estimations derived from 4D ultrasound data, we are currently further validating our results with estimations produced by MRI tagging of the same patients. Preliminary evaluations of the results (unpublished) produced by MRI show good qualitative agreement with 4D ultrasound results. Displacement trends can be seen to follow in similar time courses.
Acknowledgment
The authors would like to thank Frances Munoz for scanning many of the patients in this study and for her advice on many aspects of ultrasound acquisition. The authors would also like to thank Bruce McDermott and Betty Tsai at Siemens AG for providing us with access to the Siemens SC2000 workstation and additional utilities needed for the analysis done in this paper.
This work was partially funded by the American Heart Association grant #0640005N, National Institutes of Health (NIH)1R01HL08516-01A2, and NIH/NHLBI 1R01HL086578-01A2.
Contributor Information
Ming Jack Po, Email: mp2591@columbia.edu, Department of Biomedical Engineering, Columbia University, New York, NY 10027 USA.
Auranuch Lorsakul, Email: al2776@columbia.edu, Department of Biomedical Engineering, Columbia University, New York, NY 10027 USA.
Qi Duan, Email: Qi.Duan@nyumc.org, Center of Biomedical Imaging, NYU School of Medicine, New York, NY 10016 USA.
Kevin J. Yeroushalmi, Email: kjy2101@columbia.edu, Department of Biomedical Engineering, Columbia University, New York, NY 10027 USA.
Eiichi Hyodo, Email: eh2450@columbia.edu, Division of Cardiology, Columbia University Medical Center, New York, NY 10027 USA.
Yukiko Oe, Email: yi2107@columbia.edu, Division of Cardiology, Columbia University Medical Center, New York, NY 10027 USA.
Shunichi Homma, Email: sh23@columbia.edu, Division of Cardiology, Columbia University Medical Center, New York, NY 10027 USA.
Andrew F. Laine, Email: laine@columbia.edu, Department of Biomedical Engineering, Columbia University, New York, NY 10027 USA.
References
- 1.Canals R, et al. Volumetric ultrasound system for left ventricle motion imaging. Ultrasonics, Ferroelectrics and Frequency Control, IEEE Transactions on DOI - 10.1109/58.808877. 1999;vol. 46:1527–1538. doi: 10.1109/58.808877. [DOI] [PubMed] [Google Scholar]
- 2.D'hooge J, et al. Regional strain and strain rate measurements by cardiac ultrasound: principles, implementation and limitations. Eur J Echocardiogr. 2000 Sep 1;vol. 1:154–170. doi: 10.1053/euje.2000.0031. [DOI] [PubMed] [Google Scholar]
- 3.Ingrassia C, et al. Parameterization of left ventricular wall motion for detection of regional ischemia. Annals of Biomedical Imaging. 2005 Jan 1; doi: 10.1007/s10439-005-3312-7. [DOI] [PubMed] [Google Scholar]
- 4.Park J, Park S. Strain analysis and visualization: left ventricle of a heart. Computers & Graphics. 2000;vol. 24:701–714. [Google Scholar]
- 5.Duan Q, et al. Quantitative validation of optical flow based myocardial strain measures using sonomicrometry. Biomedical Imaging: From Nano to Macro, 2009. ISBI '09. IEEE International Symposium on DOI - 10.1109/ISBI.2009.5193082. 2009:454–457. doi: 10.1109/ISBI.2009.5193082. [DOI] [PMC free article] [PubMed] [Google Scholar]
- 6.Lopata RGP, et al. 10B-4 4D Cardiac Strain Imaging: Methods and Initial Results. Ultrasonics Symposium, 2007. IEEE DOI - 10.1109/ULTSYM.2007.223. 2007:872–875. [Google Scholar]
- 7.Duan Q, et al. Tracking of LV Endocardial Surface on Real-Time Three-Dimensional Ultrasound with Optical Flow. 2005 [Google Scholar]
- 8.Duan Q, et al. Coronary Occlusion Detection with 4D Optical Flow Based Strain Estimation on 4D Ultrasound. Functional Imaging and Modeling of the Heart. :211–219. [Google Scholar]
- 9.Papademetris X. Estimating 3D strain from 4D cine-MRI and echocardiography: In-vivo validation. Medical Image Computing and Computer-Assisted Intervention-MICCAI 2000. 1935 [Google Scholar]
- 10.Duan Q, et al. Assessment of visual quality and spatial accuracy of fast anisotropic diffusion and scan conversion algorithms for real-time three-dimensional spherical ultrasound. 2004:331–342. [Google Scholar]
- 11.Funk G, et al. Left Ventricular Diastolic Dysfunction in Patients With COPD in the Presence and Absence of Elevated Pulmonary Arterial Pressure. Chest. 2008 Jan 1; doi: 10.1378/chest.07-2685. [DOI] [PubMed] [Google Scholar]
- 12.Axel L. Tagged MRI-based studies of cardiac function. Functional Imaging and Modeling of the Heart [Google Scholar]
- 13.Pai V, Axel L. Advances in MRI tagging techniques for determining regional myocardial strain. Current Cardiology Reports. 2006 Jan 1; doi: 10.1007/s11886-006-0011-4. [DOI] [PubMed] [Google Scholar]


