

Abstract
Expression of E-cadherin is used to monitor the epithelial phenotype, and its loss is suggestive of epithelial-mesenchymal transition (EMT). EMT triggers tumor metastasis. Exit from EMT is marked by increased E-cadherin expression and is considered necessary for tumor growth at sites of metastasis; however, the mechanisms associated with exit from EMT are poorly understood. Herein are analyzed 185 prostate cancer metastases, with significantly higher E-cadherin expression in bone than in lymph node and soft tissue metastases. To determine the molecular mechanisms of regulation of E-cadherin expression, three stable isogenic cell lines from DU145 were derived that differ in structure, migration, and colony formation on soft agar and Matrigel. When injected into mouse tibia, the epithelial subline grows most aggressively, whereas the mesenchymal subline does not grow. In cultured cells, ZEB1 and Src family kinases decrease E-cadherin expression. In contrast, in tibial xenografts, E-cadherin RNA levels increase eight- to 10-fold despite persistent ZEB1 expression, and in all ZEB1-positive metastases (10 of 120), ZEB1 and E-cadherin proteins were co-expressed. These data suggest that transcriptional regulation of E-cadherin differs in cultured cells versus xenografts, which more faithfully reflect E-cadherin regulation in cancers in human beings. Furthermore, the aggressive nature of xenografts positive for E-cadherin and the frequency of metastases positive for E-cadherin suggest that high E-cadherin expression in metastatic prostate cancer is associated with aggressive tumor growth.
E-cadherin has been used in many studies to observe epithelial-mesenchymal transition (EMT) after stimulation by growth factors.1,2 E-cadherin functions as a calcium-dependent cell-cell adhesion protein and has a key role in regulating epithelial morphogenesis and differentiation.3 Loss of E-cadherin facilitates dissociation of cancer cells from the tumor mass and promotes tumor metastasis.4 Several distinct mechanisms have been demonstrated to regulate the level of protein expression. For example, transcriptional repressors bind to E-boxes in the E-cadherin promoter and can cause reversible loss of E-cadherin. These repressors include SNAIL (SNAI1), SLUG (SNAI2), ZEB1 (deltaEF1, TCF8, ZFHX1A, or ZFHEP), ZEB2 (SIP1, SMADIP1, or ZFHX1B), and the basic helix-loop-helix transcription factor TWIST, and are believed to participate in global cellular reprogramming during EMT.5 The repressors were discovered in model organisms in which activities are temporally coordinated during development.6 In prostate cancer cell lines, ZEB1 is primarily responsible for transcriptional repression of E-cadherin7,8; however, it has not been analyzed in prostate cancer in human beings.
Other mechanisms that regulate E-cadherin are posttranslational. The rate of endocytosis and re-expression after internalization are important factors that affect protein levels and are responsible for rapid loss of E-cadherin expression after growth factor stimulation or oncogenic transformation.9 Normally, β-catenin and p120cas anchor E-cadherin to the actin cytoskeleton via α-catenin. This interaction is destroyed by phosphorylation through Src family kinases (SFKs), and E-cadherin is rapidly internalized.10,11 After internalization, the MYCN (alias N-myc) down-regulated gene NDRG1 facilitates surface re-expression from endocytic vesicles, and its levels correlate with those of E-cadherin in prostate cancer tissue samples from patients.12
Morphologic changes of EMT that typically accompany the loss of E-cadherin are notably absent even in the most aggressive prostate cancers. Recently, partial EMT in pre-metastatic prostate cancer cells has been proposed.13–15 based on reduced expression of E-cadherin and of the tumor suppressor DAB2IP.16 Reduced and aberrant expression of E-cadherin is predictive of tumor recurrence17–26. However, data from prostate cancer metastases are limited, and the largest study examined only 33 metastatic sites. Three studies of prostate cancer metastases have reported decreased expression compared with the primary cancer,17,27,28 and three additional studies have reported high expression20,29,30
Based on the complex nature of regulation of E-cadherin expression and the role of E-cadherin in tumor metastasis, the present study measured E-cadherin expression in a large cohort with metastatic prostate cancer and determined the regulation of E-cadherin expression in a novel system of isogenic sublines from metastatic DU145 prostate cancer cells. Together, the data demonstrate E-cadherin regulation through transcriptional and posttranscriptional mechanisms and highlight the difficulties in identifying the causes of E-cadherin loss in prostate cancer.
Materials and Methods
Cell Lines, Antibodies, and Inhibitors
DU145, PC-3, C4-2, LAPC4, LNCAP, CWR22Rv1, MDA-PCA-2b, and 293T [American Type Culture Collection (ATCC), Manassas, VA] were cultured in ATCC-recommended media. Antibodies to SNAIL, ZEB1, E-cadherin, β-catenin, β-actin, β-tubulin, SrcY419, and SFK were purchased from Cell Signaling Technology, Inc. (Danvers, MA). Anti-CK18 was purchased from Abcam Inc. (Cambridge, MA); anti-E-cadherin (HECD1) from EMD Chemicals, Inc. (Gibbstown, NJ); and Ki-67 from Dako Corp. (Carpinteria, CA). The ZEB1 antibody for IHC has been validated previously.31 Alexa Fluor secondary antibodies were purchased from Invitrogen Corp. (Carlsbad, CA). The TUNEL (terminal deoxynucleotidyl transferase-mediated dUTP nick-end labeling) detection kit was purchased from Millipore Corp. (Billerica, MA). Cells were treated with 10 μmol/L PP2 SFK inhibitor (EMD Chemicals, Inc.) and 50 μmol/L E64 (Sigma-Aldrich Corp., St. Louis, MO) or 100 nmol/L MG132 (EMD Chemicals, Inc.) proteosome/lysosome inhibitors overnight without cytotoxic effect.
Isolation of DU145 Sublines
DU145 cells from ATCC were sorted using fluorescence-activated cell sorting (FACS) on the basis of E-cadherin expression and were cultured in three-dimensional Matrigel (BD Biosciences, Franklin Lakes, NJ) at 2000 cells per well. Spheroid structures were extracted and expanded in regular tissue culture, and cell clusters with distinct morphologic features were retrieved via trypsinization. Two sublines, S-DU145 and R-DU145, were obtained from the E-cadherin surface-negative spheres, and one subline, T-DU145, was obtained from the E-cadherin–positive spheres. Cell lines were determined to be stable for more than 50 passages based on morphologic appearance and standard FACS analysis. Isolation of sublines was reproducible with two vials of DU145 cells purchased from ATCC 3 years apart.
FACS and Analysis
To isolate subpopulations positive or negative for E-cadherin, five million cells were detached from plates using EDTA and were maintained under sterile conditions during staining and sorting. To block the cell surface, cells were suspended in 1 mL 5% bovine serum albumin. After 15 minutes at 4°C, 10 μL HECD1 E-cadherin antibody was added for 1 hour. After washing, cells were resuspended at approximately one million cells per milliliter and sorted using FACS (Aria 2 cell sorter; BD Biosciences) with a 100-μm aperture nozzle. Fractions positive and negative for E-cadherin were counted and plated for culture in growth medium with antibiotics. For FACS analysis, one million cells were labeled in 100 μL, and were analyzed using the FACS Canto machine (BD Biosciences). Data were analyzed and displayed using the FACSDiva (BD Biosciences, San Jose, CA) and FloJo (Tree Star Inc., Ashland, OR) software.
Matrigel Three-Dimensional Culture
Cells were cultured in eight-well chamber slides as described,32 with the following modification: 80 μL 100% growth factor–depleted Matrigel was added per well. The chamber slide was placed in the incubator for exactly 1 hour before adding 500 to 1000 cells per well suspended in 400 μL ice-cold 10% Matrigel in phenol red–free RPMI medium. After 48 hours, cells were overlayed with 200 μL RPMI 5% fetal bovine serum and fed every other day for 7 to 10 days.
Migration and Colony Formation on Soft Agar
Assays were performed as described,33 and were repeated twice.
Human-Specific Quantitative PCR in Xenograft Samples
RNA measurements of DU145 cells in mouse tibia were performed using the SYBR green method. The human-specific primer sets were as follows: CDH1: forward, 5′-CCCCAAAGAAAATACACAATTATCA-3′; reverse, 5′-GTTTCTCAAGTGTTTTGGAGAAAAA-3′ SNAI1: forward, 5′-GAAAGGCCTTCAACTGCAAA-3′; reverse, 5′-TGACATCTGAGTGGGTCTGG-3′ SNAI2: forward, 5′-GGGGTCTGAAAGCTTGGACT-3′; reverse, 5′-ATGGCCTCTCTCCTCTTTCC-3′ ZEB1: forward, 5′-ATGCGGAAGACAGAAAATGG-3′; reverse, 5′-GTCACGTTCTTCCGCTTCTC-3′ ZEB2: forward, 5′-GGGTTAGTGCTTTTGTTGTCC-3′; reverse, 5′-CCAAACAGCTTCTCTTCTGAGG-3′ RPL13A: forward, 5′-ATTGGAGGGCCCTATCTTGT-3′; reverse, 5′-CCTGTAACCCCTTGGTTGTG-3′
Primer specificity for human sequences was demonstrated with pure mouse bone or bone marrow RNA, and CT > 33.5 cycles were obtained (CT = 34 limits of quantification). RNA input for samples from DU145 cells in bone was adjusted to 22 to 23 CT for human RPL13A and normalized to RPL13A cycle numbers.
Small-Interfering RNA
ON-TARGETplus SMARTpool small-interfering RNA (siRNA) oligonucleotides (a mixture of four siRNAs) specific to ZEB1, SNAIL, SLUG, ZEB2, and glyceraldehyde-3-phosphate dehydrogenase and scrambled pooled siRNA control oligonucleotides were purchased from Thermo Scientific Dharmacon RNAi Technologies (Rockford, IL). Oligonucleotides were transfected using DharmaFECT siRNA transfection reagent (Thermo Scientific Dharmacon RNAi Technologies). In 35-mm dishes, 0.6 to 1 × 10⁵ cells were cultured for 24 hours to 80% confluence, and were harvested at 48 hours after transfection for RNA isolation and at 72 hours for imaging and protein isolation. siRNA experiments were performed three times, with similar results. Cells lysates were analyzed using Western blot analysis with antibodies to ZEB1 (1:250), SNAIL (1:500), E-cadherin (1:500), β-catenin (1:500), and β-tubulin (1:1000). For subcellular fractionation, cells were treated with hypotonic lysis buffer. Nuclei were isolated at 800 × g and, membranes at 1 × 10⁵ × g
Immunohistochemistry
TMA of Patients with Cancer
Tissues were obtained from the Prostate Cancer Donor Program at the University of Washington (Seattle, WA).34 A human tissue microarray (TMA) (UWTMA21) was constructed using samples from 44 patients and 185 metastatic sites. Details of metastatic sites are given in Supplemental Table S1 (available at http://ajp.amjpathol.org). IHC was performed using a standard procedure. In brief, tissues were stained with either E-cadherin (24E10) at a 1:50 dilution, ZEB1164231 at 1:500, ZEB1 (D80D3) at 1:100, or Ki-67 (clone MIB1) at 1:50 after retrieval with Dako Target Retrieval solution (Dako Corp.) for 30 minutes in a vegetable steamer (Black and Decker Corp., Towson, MD). Tibial xenografts were stained using the ZEB1 (D80D3) antibody. For all other ZEB1 stains, the 1642 antibody was used. Slides were developed using an ABC Kit (Vector Laboratories, Inc., Burlingame, CA) and 3,3′-diaminobenzidine tetrahydrochloride as substrate. TMA cores were scored by two observers (B.S.K., C.A.) on a scale of 0 to 2 in nuclear, cytoplasmic, and membrane compartments. E-cadherin expression was scored in the cytoplasm and membrane, and ZEB1 expression was scored in the nucleus. The staining intensity was multiplied by the percentage of positive cells.
TMA of LuCaP Xenografts
LuCaP prostate cancer xenografts35 were derived as follows: LuCaP 23.1, 35, 58, 78, 81, 92, 115, and 145.2 xenografts were derived from lymph node metastases; LuCaP 23.12, 70, 145.1, and 147 xenografts from liver metastases; LuCaP 49 from omental fat; LuCaP 73 from primary prostate cancer; LuCaP 77 and 105 from bone metastases; LuCaP 86.2 from bladder metastasis; LuCaP 93, 96 and 141 from transurethral resection of the prostate; and LuCaP 136 from ascites. The staining intensities of E-cadherin and ZEB1 were scored by two observers (A.V. and B.S.K) on a scale of 0 to 3. All cells in the xenografts stained uniformly. The mean score of duplicate cores was calculated.
Tibial Prostate Cancer Model
Animal studies were performed in compliance with the University of Washington Institutional Animal Care and Use Committee and the National Institutes of Health guidelines.36 Mice were sacrificed at 7 to 10 weeks after injection. In two animals per group, tibiae were fixed in 10% formalin, demineralized in 5 mmol/L EDTA, and embedded in paraffin. In three animals, tumor cells were flushed from the tibiae and cultured. Cancer cells that remained in the bone after flushing were snap-frozen for RNA isolation.
Statistical Analysis
Statistical analysis of human metastasis TMA data were performed using R software (version 2.11.1). Because the consistency of scores between duplicate cores was 73%, averaged intensities were used for analysis. Correlations between overall, membrane, and cytoplasm intensity were tested using Pearson's χ2 test in pairs because intensity associations within a patient were higher than between patients. One-way analysis of variance was used to examine differences between bone, liver, and lymph nodes. Equal variance assumption was evaluated using the F test. P < 0.05 was considered statistically significant. Statistical analysis of laboratory data was performed using functions provided by Excel (Microsoft Corp., Redmond, WA), including Student's t-test and the Pearson correlation coefficient.
Results
E-Cadherin Expression in Prostate Cancer Metastases
To determine the frequency of E-cadherin expression in metastatic prostate cancer, a large cohort of prostate cancer metastases was analyzed. The HECD1 antibody, which binds to an extracellular epitope of E-cadherin, was used to measure E-cadherin expression in a cohort of 185 prostate cancer metastases from 44 patients (Table S1). Data were obtained from 165 metastatic sites, of which 109 were bone and 56 were soft tissue. In metastatic tissues, E-cadherin expression ranged from virtually no staining to intense staining (Figure 1A; see also Supplemental Figure S1 at http://ajp.amjpathol.org). There was a strong correlation between membrane and cytoplasmic E-cadherin immunoreactivity (P < 0.01). In addition to variable expression across patients, there was considerable variability across metastatic sites from the same patient, as demonstrated by the standard deviations in Figure 1A. Overall, E-cadherin protein expression was significantly higher in bone versus soft tissue metastases (P < 0.01) (Figure 1B). The soft tissue metastases were observed in 30 lymph nodes, 18 livers, and 8 other sites. Within patients, 68% of lymph node and 65% of liver and other soft tissue metastases expressed lower levels of E-cadherin when compared with the corresponding bone metastases (Figure 1C).
Figure 1.
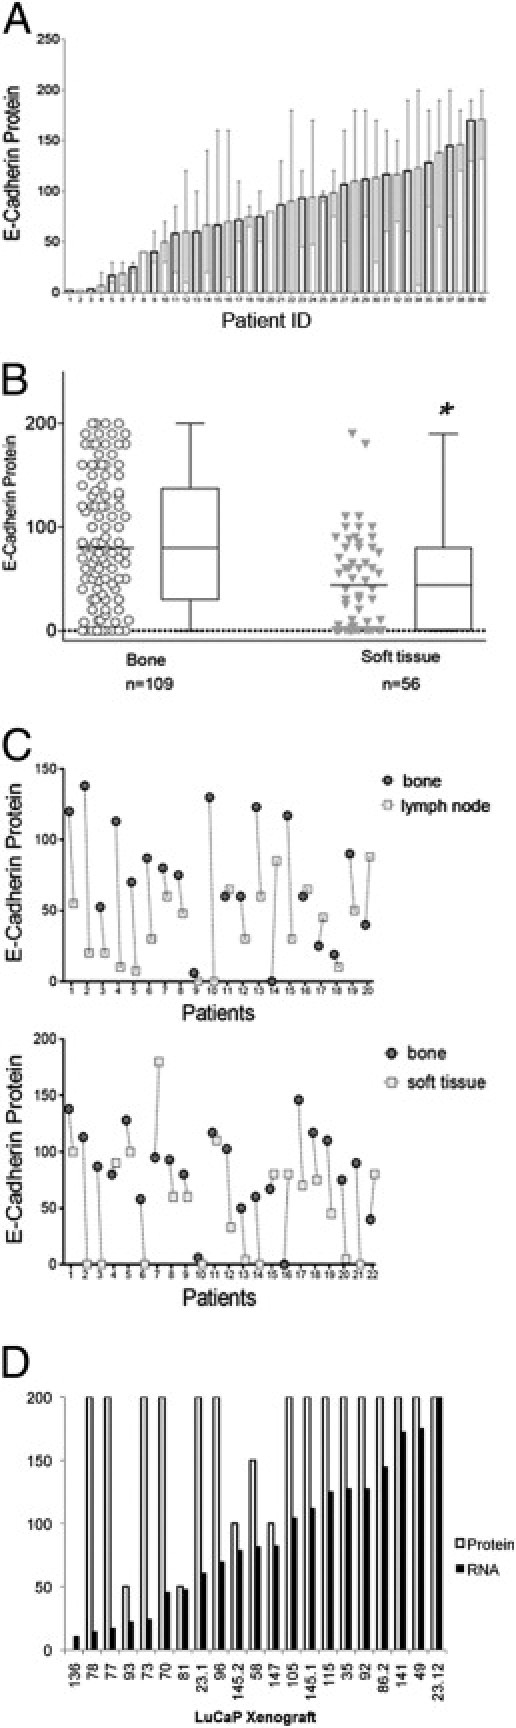
E-cadherin expression in metastatic prostate cancers. A: E-cadherin protein in 40 patients. Bars represent average expression from all metastatic sites in a patient, and SD demonstrates the variability of expression. B: E-cadherin expression in bone versus soft tissue metastases. Circles represent mean intensity scores from duplicate cores. Bone metastases are from 40 patients, and soft tissue metastases from 23 patients. The difference between bone and soft tissue metastases is statistically significant (*P < 0.01). C: Contrast of E-cadherin expression between metastatic sites in the same patient. Solid circles represent bone metastases, and open circles represent lymph node metastases (top panel) or soft tissue metastases (bottom panel). Lines connect metastases in the same patient. D: E-cadherin RNA and protein expression in prostate cancer xenografts. RNA data are from oligonucleotide arrays (Agilent Technologies, Inc., Santa Clara, CA), and protein expression data are from a xenograft TMA.
Inasmuch as transcriptional and posttranslational mechanisms of E-cadherin regulation have been identified,37 it was questioned whether E-cadherin protein expression was subject to posttranscriptional regulation in a panel of 21 LuCaP prostate cancer xenografts from various metastatic sites (see Materials and Methods).36 The relative mRNA expression of E-cadherin was extracted from an array data set,38 and the protein was measured using IHC (Figure 1D). The correlation between E-cadherin RNA and protein expression was σ = 0.4. As observed in the LuCaP78 xenograft, even low expression of E-cadherin mRNA is sufficient to yield high protein expression. Thus, low E-cadherin protein expression in LuCaP 93, 81, 145.2, 58, and 147 is likely due to posttranscriptional regulation.
Characterization of Isogenic DU145 Sublines
It was postulated that prostate cancer cell lines derived from metastatic cancers might reflect the heterogeneity of E-cadherin expression in metastatic tissues. To test this hypothesis, expression of E-cadherin was analyzed using FACS in VCaP, LaPC4, LNCaP, MDA-PCA-2b, CWR22Rv1, DU145, and PC3 cell lines (data not shown). Except for PC3 and DU145 cells, the cell lines consisted predominantly of cells positive for E-cadherin. While PC3 cells (newly purchased from ATCC) contained two distinct E-cadherin–positive and E-cadherin–negative populations, E-cadherin expression in DU145 cells ranged across a continuous spectrum of cell surface expression (see Supplemental Figure S2A at http://ajp.amjpathol.org). Next, RNA expression of E-cadherin and of the E-cadherin repressors SNAIL, SLUG, ZEB1, and ZEB2 were determined. All cell lines expressed E-cadherin RNA and cell surface protein; however, only DU145 and PC3 expressed high levels SNAIL, SLUG, and ZEB1 (see Supplemental Figure S2B at http://ajp.amjpathol.org).
Generation of Isogenic Sublines from the DU145 Prostate Cancer Cell Line
Because DU145 cells express a range of E-cadherin, this cell line was selected for further analysis. However, E-cadherin–positive and E-cadherin–negative cells could not be stably propagated in two-dimensional culture; therefore, an attempt was made to stabilize cells using three-dimensional culture in Matrigel. DU145 cells were separated into two populations: an E-cadherin–positive population and a population that did not express E-cadherin on the cell surface (Figure 2A). Some surface-negative cells express E-cadherin in the cytoplasm. Cells were cultured in Matrigel, and spheroid structures were picked at 10 days after plating. Further expansion of the cells occurred in two-dimensional culture. After this procedure, the cells were stable insofar as structure and E-cadherin expression for more than 50 passages. Three distinct morphologic features were identified. The E-cadherin surface-negative population gave rise to the fibroblastic and elongated (spindle) subline S-DU145 and to the small, epithelioid, and refractile (round) subline R-DU145. The E-cadherin-positive population gave rise to the tight subline T-DU145, which consisted of large cells in cohesive colonies with smooth borders (Figure 2A). Growth rates of S-DU145, R-DU145, and T-DU145 sublines in culture were similar (data not shown), as was expression of cytokeratin 18 and vimentin (Figure 2C).
Figure 2.
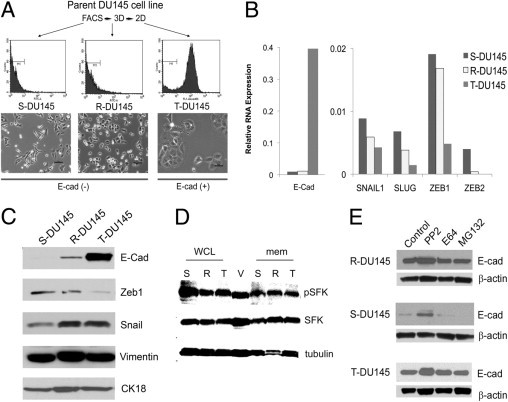
Isolation of isogenic sublines from DU145 prostate cancer cells based on expression levels of E-cadherin (E-cad). A: Generation of spindle (S-DU145), round (R-DU145), and tight (T-DU145) sublines. Parent DU145 cells were sorted using FACS based on E-cadherin expression. Cells with the lowest 10% and highest 10% E-cadherin expression were placed in three-dimensional Matrigel, and resulting spheres were picked individually and propagated in two dimensions. Scale bars = 50 μm. B: RNA expression of E-cadherin and E-cadherin repressors SNAIL1, SLUG, ZEB1, and ZEB2. Quantitative PCR cycle numbers were normalized to RPL13A. C: Protein expression of E-cadherin and E-cadherin repressors. Fifty micrograms of whole-cell lysates was analyzed for E-cadherin, vimentin, and cytokeratin 18 (CK18), and 25 μg nuclear protein was analyzed for ZEB1 and SNAIL. D: Expression of SFKs in DU145 sublines. Fifty micrograms of membrane (mem) fraction or whole-cell lysates (WCL) from S-DU145 (S), R-DU145 (R), and T-DU145 (T) was analyzed for expression of pSFK. The blot was reprobed to determine SFK and β-tubulin expression. WCL from VCAP (V) cells were used as a positive control. E: Regulation of E-cadherin expression by SFK. R-DU145, S-DU145, and T-DU145 were treated with the SFK inhibitor PP2 or with the proteosome inhibitors E64 or MG132. WCL were analyzed for E-cadherin protein expression.
Parallel to the expression of surface E-cadherin protein, E-cadherin RNA expression was higher in T-DU145 cells than in S-DU145 or R-DU145 cells (Figure 2B). To confirm that RNA expression is regulated transcriptionally and not by RNA stability, a luciferase reporter was used, driven by the proximal 1 Kb of the E-cadherin promoter (see Supplemental Figure S2C at http://ajp.amjpathol.org). Luciferase activity paralleled cellular E-cadherin expression (Figure 2B). Next was determined which repressor is involved in E-cadherin silencing in DU145 cells. ZEB1 but not ZEB2 or SNAIL RNA expression was inversely related to E-cadherin expression in DU145 and PC3 cells (see Supplemental Figure S2D at http://ajp.amjpathol.org), corroborating findings of a previous study of PC3 cells.7 Western blot analysis demonstrated a small amount of E-cadherin in R-DU145 cells (Figure 2C), and ZEB1 and SNAIL protein levels in nuclei isolated from the sublines paralleled their RNA expression levels. The E-cadherin protein in R-DU145 cells is cytoplasmic, as visualized using immunofluorescence (data not shown).
Although E-cadherin RNA was low in S-DU145, it was clearly present, pointing to additional translational or posttranslational inhibition of expression. The responsible known mechanisms are phosphorylation by SFKs and proteosomal degradation.39 In all three sublines, phospho-SFKs were detectable, and S-DU145 cells expressed the most SFK (Figure 2D). Treatment with PP2 but not E64 or MG132 increased expression of E-cadherin protein in all sublines, confirming the role of SFKs as regulators of E-cadherin expression (Figure 2E).
Functional Characterization of DU145 Sublines
The sublines were characterized in several functional assays. As expected, S-DU145 cells were most migratory (Figure 3A). R-DU145 migrated substantially more in response to hepatocyte growth factor/Matrigel than to fetal bovine serum or serum-free conditioned medium from bone marrow stroma cells. T-DU145 cells were the least migratory. In the soft agar colony formation assay, R-DU145 formed the largest number of colonies and the highest percentage of large colonies (Figure 3B). In contrast, in the Matrigel spheroid-forming assay, T-DU145 formed the largest spheroids, with a smooth edge but without a lumen (Figure 3C), which suggests that E-cadherin expression facilitates organized spheroid growth. In both three-dimensional systems, spheroid formation by S-DU145 cells was the slowest, and the spheres were poorly organized. In summary, the three sublines differ significantly in multiple functional assays. While mesenchymal S-DU145 cells are associated with rapid cell migration, the enhanced ability of R-DU145 cells to form colonies on soft agar suggests that these cells are the most transformed.
Figure 3.
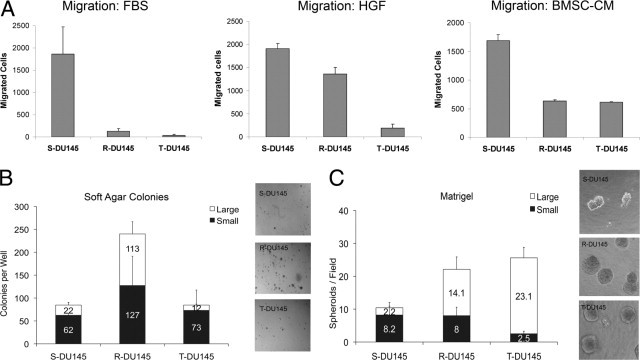
Functional characterization of DU145 sublines. A: Migration of cells through Transwell filters. To the upper chamber, 1 × 10⁵ cells in RPMI were added, and the lower chamber contained either 1% fetal bovine serum (FBS), 1000 U/mL hepatocyte growth factor (HGF), or serum-free conditioned medium from bone marrow stroma cells (BMSC-CM). For HGF migration, filters were coated with Matrigel, and cells were allowed to migrate for 6 hours, then were fixed, stained, and counted. Six fields were counted per filter and averaged, and the background spontaneous migration (no attractant) was subtracted. B: Soft agar colony formation assay. Left panel, Cells, 1 × 10⁶, were encased in top agar and grown for 2 weeks. Right panel, Plates were photographed at 4× magnification, and colonies were counted, with the large and small colonies differentiated at 0.5 cm in diameter. C: Matrigel assay. Left panel, Cells, 1 × 10³ per well of a four-well chamber slide, were grown for 10 days in Matrigel. Right panel, Wells were photographed at 10× magnification for counting.
Regulation of E-Cadherin Expression in Cultured Prostate Cancer Cell Lines
Because E-cadherin and ZEB1 expression levels are inversely related, it was determined whether ZEB1 is responsible for suppressing E-cadherin in knockdown experiments. In a comparison of cells transfected with siZEB1, siSNAIL, siSLUG, and siZEB2, R-DU145 demonstrated a larger increase in E-cadherin RNA expression than did S-DU145 after siZEB1 but not the other siRNAs (see Supplemental Figure S3, A and B, at http://ajp.amjpathol.org). R-DU145 was used for confirmatory protein measurements, and S-DU145 for morphologic analysis because reversion to an epithelial structure is best observed in these cells. Using Western blot analysis, both E-cadherin and β-catenin protein expression increased on reduction of ZEB1 but not of SNAIL (Figure 4A). In addition, on reduction of ZEB1, the mesenchymal S-DU145 cells assumed an epithelial structure (Figure 4B).
Figure 4.
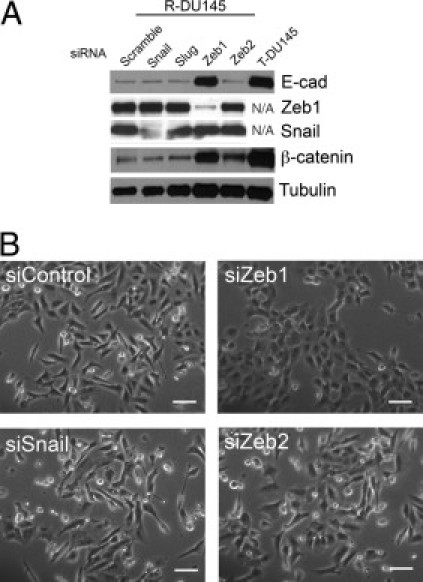
Transcriptional regulation of E-cadherin in DU145 sublines. A: Knockdown of E-cadherin repressors. SNAIL, SLUG, ZEB1, or ZEB2 expression was reduced in R-DU145 cells using a SMARTpool of 4 siRNAs for each gene. Twenty-five micrograms of protein was probed for expression of E-cadherin (E-cad), ZEB1, SNAIL, or β-catenin. T-DU145 served as a positive control in lanes 1, 4, and 5. B: Morphologic analysis after transfection with siRNAs. S-DU145 cells were transfected and photographed after 72 hours. The transfection efficiency, evaluated with GFP, was >80% (data not shown). Scale bars = 100 μm.
Cell Line Xenograft Model with R-DU145
To evaluate the behavior of DU145 sublines in bone, cells were injected into mouse tibia. Whereas S-DU145 cells could not grow, R-DU145 and T-DU145 reproducibly formed tumors with osteolytic activity (Figure 5A). T-DU145 cells generated the largest osteolytic lesions, significantly greater than R-DU145 cells (P < 0.05) (Figure 5B). The rates of proliferation of cells in T-DU145 and R-DU145 xenografts were similar; however, rates of apoptosis differed significantly (P < 0.05) (Figure 5, C and D). When the sublines were grown as subcutaneous tumors to obtain more accurate growth measurements, R-DU145 xenografts varied in onset and growth rates, which suggests that R-DU145 cells are more heterogeneous (see Supplemental Figure S4 at http://ajp.amjpathol.org).
Figure 5.
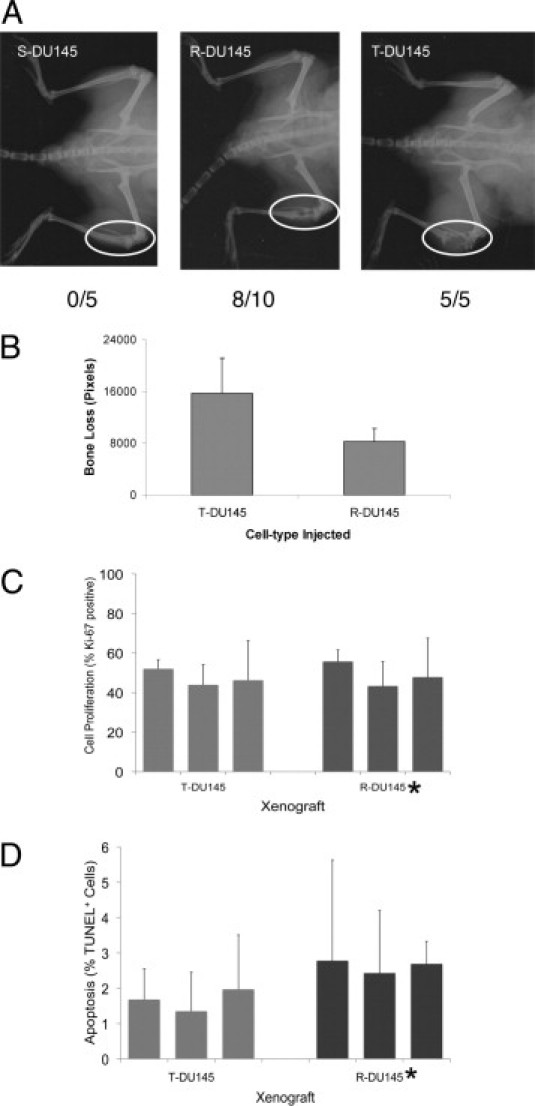
Growth of DU145 sublines in mouse tibia. A: Radiographs of tibial tumors from S-DU145, R-DU145, and T-DU145 cells. Tumor growth was followed up at radiography. Numbers indicate animals with tumors per total animals injected. Ovals demonstrate areas of osteolysis. B: Quantification of bone destruction in T-DU145 and R-DU145 xenografts. Bone destruction was measured by the loss of pixels in radiographs of four mice. C: Cell proliferation. Proliferation rates were measured using Ki-67 IHC. The percentage of Ki-67–positive tumor cells from three separate xenografts is shown. The difference in proliferation index is insignificant (*P = 0.74). D: Apoptosis. Apoptotic cells were visualized via TUNEL staining. The mean percentage per 40× high-powered field from three separate T-DU145 or R-DU145 xenografts is shown. The difference in the apoptotic index between T-DU145 and R-DU145 is significant (*P = 0.03).
Tibial tumors showed a marked increase in E-cadherin RNA compared with preinjection R-DU145 cells, whereas ZEB1 and SNAIL RNA expression remained the same (Figure 6A). For protein measurements comparing preinjection R-DU145 cells with those in tibial tumors, R-DU145 cells were retrieved from the tibial shafts and expanded in culture. Greater than 50% of the cells maintained E-cadherin expression in culture (data not shown). Using Western blot analysis, total E-cadherin and β-catenin levels were elevated in tibial R-DU145 cells compared with preinjection cells (Figure 6B). In contrast, expression of ZEB1 or SNAIL proteins varied among the cells retrieved from xenografts; however, there was no consistent decrease to explain increased E-cadherin levels. Further, ZEB1 protein expression at IHC revealed similar nuclear staining intensities in E-cadherin–positive and E-cadherin–negative areas of the xenograft (Figure 6C). To determine the relationship between ZEB1 and E-cadherin protein expression in metastatic prostate cancers in patients, expression of ZEB1 was analyzed in the tissue TMA, which had been previously stained for E-cadherin expression. ZEB1 expression in stromal or endothelial cells was observed at 120 metastatic sites; however, only 10 metastases from nine individuals revealed nuclear ZEB1 expression in cancer cells (Figure 6E; see also Supplemental Figure S1 at http://ajp.amjpathol.org). Except for one individual with two ZEB1-positive metastases, all other individuals expressed only ZEB1 protein in one of several metastatic sites. Expression of ZEB1 was not specific to bone, lymph node, or soft tissue metastasis. Except for one ZEB1-positive case, which could not be evaluated because of loss of E-cadherin tissue cores, cancer cells that expressed ZEB1 also expressed E-cadherin. Thus, both R-DU145 tumors in mice tumors and metastatic prostate cancers in patients co-express ZEB1 and E-cadherin.
Figure 6.
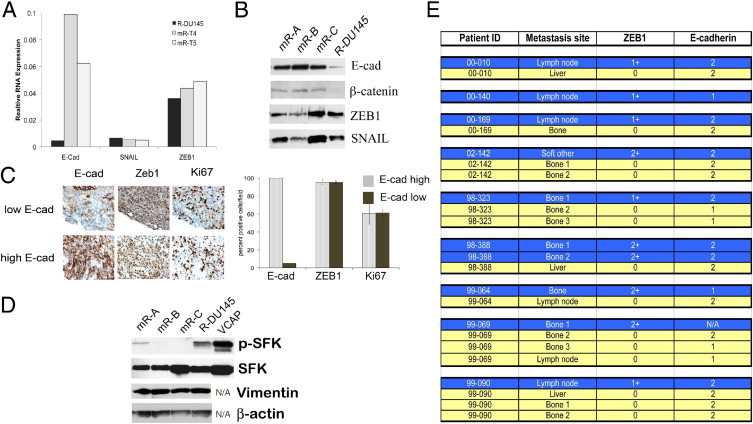
Co-expression of E-cadherin and ZEB1 in xenografts and patient metastases. A: RNA expression in preinjection R-DU145 and two tibial xenografts, mR-T4 and m-RT5. RNA for E-cadherin, ZEB1, and SNAIL was measured using human-specific primers. B: Expression of protein in preinjection R-DU145 and in cells cultured from three tibial xenografts. R-DU145 cells from three tibiae (mR-A, mR-B, and mR-C) were briefly cultured ex vivo. Cells were analyzed for E-cadherin, β-catenin, ZEB1, and SNAIL using Western blot analysis. C: E-cadherin and ZEB1 are co-expressed in R-DU145 xenografts. Top left panels, Parallel sections of tibial xenografts were stained with E-cadherin (E-cad), ZEB1, and Ki-67. Bottom left panels, The percentage of ZEB1- or Ki-67-positive cells was quantified by counting E-cadherin–positive and E-cadherin–negative areas. D: SFK activity in R-DU145 cells. Cultured R-DU145 cells before and after injection were analyzed for pSFK. The Western blot membrane was reprobed for total expression of SFK, vimentin, and β-actin. VCAP cells were used as a positive control for SKF. E: E-cadherin and ZEB1 are co-expressed in patient tumor metastases. The TMA used in Figure 1 was stained with the ZEB1 antibody (S1), and cores were scored for ZEB1 expression in the nucleus of cancer cells. Cores positive for ZEB1 expression are shown in blue. E-cadherin expression in the same core is indicated in the column adjacent to ZEB1. ZEB1-negative metastatic sites are shown in yellow.
To determine whether a difference in SFK activity might account for the increased E-cadherin expression in tibial xenografts, SFK activity was tested in R-DU145 cells retrieved from tibiae. SFK phosphorylation was lower in tibial cells than in preinjection R-DU145 cells (Figure 6D), which suggests that loss of SFK activity could have a role in increased E-cadherin expression.
Tibial xenografts were composed of both E-cadherin–positive and E-cadherin–negative regions. To exclude the possibility that E-cadherin expression in R-DU145 xenografts was caused by expansion of a small pre-existing population of E-cadherin–positive cells, Ki-67 expression was measured in adjacent E-cadherin–positive and E-cadherin–negative areas (Figure 6C), and the same proliferation rates were observed. Thus, E-cadherin–positive cells do not demonstrate a growth advantage, and it was hypothesized that E-cadherin–positive cells in R-DU145 intratibial tumors are generated by conversion from E-cadherin–negative cells.
Discussion
Metastatic prostate cancers are extremely heterogeneous insofar as expression of the androgen receptor and cell proliferation.34 Therefore, the observed heterogeneity of E-cadherin expression is not unexpected. However, the significant difference between bone and soft tissue metastases was not anticipated and might explain the reason for differences in published studies, which include different ratios of bone and lymph node metastases. Another possibility for discrepant results is the method of decalcification of bone biopsy specimens. Strong E-cadherin expression was observed after decalcification with EDTA, whereas low E-cadherin expression was observed in bones decalcified with 7% nitric acid.28 It is likely that lower E-cadherin protein expression in lymph node and liver metastases, the two major sites of soft tissue metastases, is stimulated by factors in the microenvironment of tumor cells. However, the higher E-cadherin levels in bone are unexpected because bone contains high concentrations of transforming growth factor-β, hepatocyte growth factor, and Wnt ligands, which normally decrease E-cadherin expression.
Because of the complicated regulation of E-cadherin expression, an attempt was made to study cell populations that consist of cells with homogeneous expression levels of E-cadherin. This led to isolation of isogenic sublines from DU145 cells based on E-cadherin expression and provided three novel cell culture models with informative properties for investigation of the regulation of E-cadherin expression. In a previous study of DU145 sublines resembling S-DU145 and T-DU145 cells, the mechanism of E-cadherin regulation was not investigated.40 In that study, DU145 cells were fractionated on the basis of speed of migration, and the resulting E-cadherin–positive and E-cadherin–negative sublines differed in morphologic features, ultrastructure, and invasive capabilities. Our approach simply separated cells from the parent DU145 cell line on the basis of E-cadherin surface expression rather than functional features of cell migration or metastasis.41,42 Because E-cadherin surface-positive and surface-negative cell populations naturally coexist in the DU145 cell line, it is uncertain whether they were generated via EMT or exit from EMT. However, the data demonstrating that R-DU145 cells are capable of re-expressing E-cadherin in xenografts, as well as two studies that demonstrated increased E-cadherin expression in co-culture with hepatocytes,43,44 support the possibility that in the right environment, DU145 cells can undergo exit from EMT.
Normally, cells that express E-cadherin are considered indolent, and EMT is associated with aggressive tumor behavior. Consistent with this theory, cells after EMT are more invasive and metastatic, and in several cancer types, high-grade tumors can assume a mesenchymal structure. Therefore, the aggressive growth behavior of E-cadherin–positive T-DU145 cells in mice was unexpected and suggests that E-cadherin–expressing cells might be more aggressive in metastatic tumors than in primary tumors. The link between E-cadherin expression and aggressive metastatic tumor growth was also made with TSU-Pr1 bladder carcinoma cells.45 Similar to observations in the present study, compared with mesenchymal sublines of TSU-Pr1, epithelioid TSU-Pr1 cells, stabilized by expression of FGFR2IIIc, demonstrated increased colonization of bone and soft tissues after cardiac or tibial injection.
The DU145 model provides additional mechanistic insights to previous studies in which epithelial plasticity was observed in prostate cancer. Both transcriptional and posttranslational regulatory mechanisms were identified involving ZEB1 and SFKs that are capable of regulating E-cadherin expression and also exert a broad affect on cellular structure, phenotype, and behavior. The multifaceted effects of ZEB1 and SFK in cancer cells suggest that E-cadherin expression might serve as a surrogate marker in tissues for several functional end points related to ZEB1 transcription and SFK phosphorylation.46,47 The most surprising observation in the DU145 model was the difference in the consequence of ZEB1 expression in cultured R-DU145 cells compared with R-DU145 cells in xenografts. Whereas ZEB1 is clearly capable of E-cadherin repression in cell culture, not only in R-DU145 cells but also in PC-3 and ARCaP cells,8,7 E-cadherin suppression by ZEB1 was lost in xenograft cells. It is unclear why ZEB1 cannot repress E-cadherin transcription in these cells. It is possible that posttranslational phosphorylation of ZEB1, which is required for ZEB1 activity, is not properly executed.48 Alternatively, the silencing effects of ZEB1 may be overwhelmed by transcription factors that positively regulate E-cadherin transcription.
E-cadherin is critical for aggregation of embryonic stem cells49 and is induced in the generation of pluripotent stem cells from fibroblasts by OCT4, SOX2, KLF4, and c-MYC.50 Therefore, expression of stem cell genes in the sublines was evaluated. Among the three sublines, R-DU145 cells demonstrate the highest expression of genes associated with stem cells including HMGA2, ZFP42, KLF2, NESTIN, and SLAIN.51–54 R-DU145 cells also expressed s-SHIP mRNA, which is expressed in activated stem cells in developing mouse mammary tissue55 (data not shown). Because R-DU145 cells in mouse xenografts express high ZEB1 and E-cadherin levels, and ZEB1 stimulates expression of microRNA found in stem cells, ZEB1 could maintain a stem cell phenotype in metastatic E-cadherin–positive prostate cancer cells.56 Therefore, R-DU145 cells might be a useful model to clarify the role of stem cell features during metastatic progression.57
The stem cell phenotype in EMT has been suggested as the responsible mechanism for drug resistance, and exit from EMT may change the response of cancer cells to drug therapy. The observation that R-DU145 cells from xenografts express reduced levels of active SFKs could have important therapeutic implications. Reduced SFK activity in metastasis in patients could cause resistance to Src inhibitors. An Src signature was recently observed in primary breast cancers to be associated with metastasis to bone, and in breast cancer cell lines, Src facilitated cell survival.58 Thus, as a conclusion from that study, it may be possible to kill dormant cells by inhibiting Src. However, our results caution coming to this conclusion because inhibition of Src might promote E-cadherin expression, which is associated with escape from dormancy and tumor growth. Thus, Src may have a different role in early and late metastatic prostate cancer cells, and as a consequence, Src inhibition may have different effects in early metastatic cancer cells from primary tumors compared with cancer cells from secondary or more advanced metastasis.
Morphologic features of EMT are not observed in E-cadherin–negative cells in primary or metastatic prostate cancers in patients and have led to the concept of “partial EMT.”59 Consequently, the recovery from EMT, that is, exit from EMT,57 during metastatic progression, which has been postulated on the basis of high levels of E-cadherin expression in metastatic disease, requires further confirmation in prostate cancer. Other cancer types have been studied more extensively insofar as mechanisms of EMT. For example, disseminated breast cancer cells exhibit mesenchymal characteristics such as expression of TWIST and N-cadherin.60 Thus, more data from patients with prostate cancer are needed to enable understanding of the genetic reprogramming during prostate cancer metastasis.
In summary, results from three stable isogenic cell lines derived from the DU145 metastatic prostate cancer cell line support the concepts that E-cadherin expression in metastatic prostate cancer is associated with aggressive disease; the environment of the bone marrow and bone in patients promotes E-cadherin expression; and ZEB1 and E-cadherin expression can be uncoupled in metastatic prostate cancer. Further studies of E-cadherin in metastatic prostate cancers in patients are needed to determine how E-cadherin expression is regulated and to determine the connection between E-cadherin expression, stem cell features, and treatment response.
Acknowledgments
We thank the patients who participated in the Prostate Cancer Donor Program and their families; Drs. Larry True, Celestia Higano, Martine Roudier, Paul Lange, Pete Nelson, and Bruce Montgomery and the rapid autopsy teams; and Shu Chen and Dr. Ruth Etzioni for statistical analysis. B.K. thanks Dr. George Vande Woude for stimulating and helpful discussions on epithelial plasticity.
Footnotes
Supported by grants W81XWH-08-1-0268 from the Department of Defense; EY017869 and 5 R21 CA118592 from the National Cancer Institute; the Pacific Northwest Prostate Cancer Specialized Programs of Research Excellence (SPORE) NCI 5 P50 CA097186 and PO1 CA 085859-05; and the LUCAS Foundation. CM is a recipient of Career Development Award P50CA097186 from the Pacific Northwest Prostate Cancer SPORE.
Supplemental material for this article can be found on http://ajp.amjpathol.org or at doi: 10.1016/j.ajpath.2011.03.028.
Supplementary data
IHC for E-cadherin and ZEB1. Cores from the TMA stained for E-cadherin (A), control rabbit immunoglobulin for E-cadherin (B), ZEB1 (C), and control rabbit immunoglobulin for ZEB1 (D). Images were obtained at 10× magnification, and the insert at 40×. Scale bars = 50 μm. Note expression of E-cadherin at the membrane, as well as nuclear expression of ZEB1.
Expression of E-cadherin and E-cadherin repressors in prostate cancer cell lines. (A) E-cadherin cell surface expression in PC3 and DU145 cells. E-cadherin was measured via FACS after staining with HECD1 antibody. (B) RNA expression of E-cadherin and E-cadherin repressors in prostate cancer cell lines. Cells were grown to subconfluent density for RNA isolation. RNA was isolated from TRIzol extracts, reverse transcribed, and analyzed using real-time PCR for transcripts of E-cadherin, SNAIL, SLUG, ZEB1, and ZEB2. RNA expression is normalized to RPL13A. Numbers next to bars indicate expression levels of RNAs that exceed the scale on the y axis. (C) E-cadherin promoter activity in DU145 sublines. The proximal 1 kB of the E-cadherin promoter placed in front of the luciferase gene was expressed in S-DU145, R-DU145, and T-DU145 cells. Luciferase activity is reported in relative luminescent units (RLUs) after background subtraction. (D) RNA expression of E-cadherin repressors in PC3 cells. PC3 cells were isolated via FACS on the basis of E-cadherin expression. E-cadherin repressors were measured as described in A.
Knockdown and expression of E-cadherin repressors. (A) Knockdown of SNAIL, SLUG, ZEB1, and ZEB2 in S-DU145 and R-DU145 cells. Reduction in RNA expression was calculated relative to cells transfected with scrambled control siRNA. (B) Change in E-cadherin RNA expression in S-DU145 and R-DU145 after knockdown of SNAIL, SLUG, ZEB1, or ZEB2. E-cadherin RNA expression was measured in cells transfected with siRNA as indicated below the bars. Bars reflect the difference between cells transfected with E-cadherin repressors and control siRNA. RNA expression was normalized to RPL13A. Note the fivefold mmcater induction of E-cadherin expression in R-DU145 cells compared with S-DU145 cells after ZEB1 silencing.
Growth curves of R-DU145 and T-DU145 cells in subcutaneous xenografts. Because growth cannot be followed in tibial tumors, cells were injected subcutaneously to evaluate growth rates. Subcutaneous tumors were obtained from four of five T-DU145 and four of five R-DU145 injections. At each time point, the largest diameter of the xenografts was measured using a caliber, and plotted on the y axis.
References
- 1.Huber M.A., Kraut N., Beug H. Molecular requirements for epithelial-mesenchymal transition during tumor progression. Curr Opin Cell Biol. 2005;17:548–558. doi: 10.1016/j.ceb.2005.08.001. [DOI] [PubMed] [Google Scholar]
- 2.Zeisberg M., Kalluri R. The role of epithelial-to-mesenchymal transition in renal fibrosis. J Mol Med. 2004;82:175–181. doi: 10.1007/s00109-003-0517-9. [DOI] [PubMed] [Google Scholar]
- 3.Halbleib J.M., Nelson W.J. Cadherins in development: cell adhesion, sorting, and tissue morphogenesis. Genes Dev. 2006;20:3199–3214. doi: 10.1101/gad.1486806. [DOI] [PubMed] [Google Scholar]
- 4.Cavallaro U., Christofori G. Multitasking in tumor progression: signaling functions of cell adhesion molecules. Ann NY Acad Sci. 2004;1014:58–66. doi: 10.1196/annals.1294.006. [DOI] [PubMed] [Google Scholar]
- 5.Peinado H., Olmeda D., Cano A. Snail, Zeb and bHLH factors in tumour progression: an alliance against the epithelial phenotype? Nat Rev Cancer. 2007;7:415–428. doi: 10.1038/nrc2131. [DOI] [PubMed] [Google Scholar]
- 6.Acloque H., Adams M.S., Fishwick K., Bronner-Fraser M., Nieto M.A. Epithelial-mesenchymal transitions: the importance of changing cell state in development and disease. J Clin Invest. 2009;119:1438–1449. doi: 10.1172/JCI38019. [DOI] [PMC free article] [PubMed] [Google Scholar]
- 7.Drake J.M., Strohbehn G., Bair T.B., Moreland J.G., Henry M.D. ZEB1 enhances transendothelial migration and represses the epithelial phenotype of prostate cancer cells. Mol Biol Cell. 2009;20:2207–2217. doi: 10.1091/mbc.E08-10-1076. [DOI] [PMC free article] [PubMed] [Google Scholar]
- 8.Graham T.R., Zhau H.E., Odero-Marah V.A., Osunkoya A.O., Kimbro K.S., Tighiouart M., Liu T., Simons J.W., O'Regan R.M. Insulin-like growth factor-I–dependent up-regulation of ZEB1 drives epithelial-to-mesenchymal transition in human prostate cancer cells. Cancer Res. 2008;68:2479–2488. doi: 10.1158/0008-5472.CAN-07-2559. [DOI] [PubMed] [Google Scholar]
- 9.Harris T.J., Tepass U. Adherens junctions: from molecules to morphogenesis. Nat Rev Mol Cell Biol. 2010;11:502–514. doi: 10.1038/nrm2927. [DOI] [PubMed] [Google Scholar]
- 10.Giehl K., Menke A. Microenvironmental regulation of E-cadherin–mediated adherens junctions. Front Biosci. 2008;13:3975–3985. doi: 10.2741/2985. [DOI] [PubMed] [Google Scholar]
- 11.Reynolds A.B., Carnahan R.H. Regulation of cadherin stability and turnover by p120ctn: implications in disease and cancer. Semin Cell Dev Biol. 2004;15:657–663. doi: 10.1016/j.semcdb.2004.09.003. [DOI] [PubMed] [Google Scholar]
- 12.Kachhap S.K., Faith D., Qian D.Z., Shabbeer S., Galloway N.L., Pili R., Denmeade S.R., DeMarzo A.M., Carducci M.A. The N-Myc down regulated gene1 (NDRG1) is a Rab4a effector involved in vesicular recycling of E-cadherin. PLoS ONE. 2007;2:e844. doi: 10.1371/journal.pone.0000844. [DOI] [PMC free article] [PubMed] [Google Scholar]
- 13.Kong D., Banerjee S., Ahmad A., Li Y., Wang Z., Sethi S., Sarkar F.H. Epithelial to mesenchymal transition is mechanistically linked with stem cell signatures in prostate cancer cells. PLoS One. 2010;5:e12445. doi: 10.1371/journal.pone.0012445. [DOI] [PMC free article] [PubMed] [Google Scholar]
- 14.Giannoni E., Bianchini F., Masieri L., Serni S., Torre E., Calorini L., Chiarugi P. Reciprocal activation of prostate cancer cells and cancer-associated fibroblasts stimulates epithelial-mesenchymal transition and cancer stemness. Cancer Res. 2010;70:6945–6956. doi: 10.1158/0008-5472.CAN-10-0785. [DOI] [PubMed] [Google Scholar]
- 15.Mak P., Leav I., Pursell B., Bae D., Yang X., Taglienti C.A., Gouvin L.M., Sharma V.M., Mercurio A.M. ERbeta impedes prostate cancer EMT by destabilizing HIF-1alpha and inhibiting VEGF-mediated SNAIL nuclear localization: implications for Gleason grading. Cancer Cell. 2010;17:319–332. doi: 10.1016/j.ccr.2010.02.030. [DOI] [PMC free article] [PubMed] [Google Scholar]
- 16.Xie D., Gore C., Liu J., Pong R.C., Mason R., Hao G., Long M., Kabbani W., Yu L., Zhang H., Chen H., Sun X., Boothman D.A., Min W., Hsieh J.T. Role of DAB2IP in modulating epithelial-to-mesenchymal transition and prostate cancer metastasis. Proc Natl Acad Sci USA. 2010;107:2485–2490. doi: 10.1073/pnas.0908133107. [DOI] [PMC free article] [PubMed] [Google Scholar]
- 17.Cheng L., Nagabhushan M., Pretlow T.P., Amini S.B., Pretlow T.G. Expression of E-cadherin in primary and metastatic prostate cancer. Am J Pathol. 1996;148:1375–1380. [PMC free article] [PubMed] [Google Scholar]
- 18.Umbas R., Isaacs W.B., Bringuier P.P., Xue Y., Debruyne F.M., Schalken J.A. Relation between aberrant alpha-catenin expression and loss of E-cadherin function in prostate cancer. Int J Cancer. 1997;74:374–377. doi: 10.1002/(sici)1097-0215(19970822)74:4<374::aid-ijc2>3.0.co;2-s. [DOI] [PubMed] [Google Scholar]
- 19.Kuczyk M., Serth J., Machtens S., Bokemeyer C., Bathke W., Stief C., Jonas U. Expression of E-cadherin in primary prostate cancer: correlation with clinical features. Br J Urol. 1998;81:406–412. doi: 10.1046/j.1464-410x.1998.00539.x. [DOI] [PubMed] [Google Scholar]
- 20.De Marzo A.M., Knudsen B., Chan-Tack K., Epstein J.I. E-cadherin expression as a marker of tumor aggressiveness in routinely processed radical prostatectomy specimens. Urology. 1999;53:707–713. doi: 10.1016/s0090-4295(98)00577-9. [DOI] [PubMed] [Google Scholar]
- 21.Kallakury B.V., Sheehan C.E., Ross J.S. Co-downregulation of cell adhesion proteins alpha- and beta-catenins, p120CTN, E-cadherin, and CD44 in prostatic adenocarcinomas. Hum Pathol. 2001;32:849–855. doi: 10.1053/hupa.2001.26463. [DOI] [PubMed] [Google Scholar]
- 22.Lu Q., Dobbs L.J., Gregory C.W., Lanford G.W., Revelo M.P., Shappell S., Chen Y.H. Increased expression of delta-catenin/neural plakophilin-related armadillo protein is associated with the down-regulation and redistribution of E-cadherin and p120ctn in human prostate cancer. Hum Pathol. 2005;36:1037–1048. doi: 10.1016/j.humpath.2005.07.012. [DOI] [PubMed] [Google Scholar]
- 23.Rao D.S., Gui D., Koski M.E., Popoviciu L.M., Wang H., Reiter R.E., Said J.W. An inverse relation between COX-2 and E-cadherin expression correlates with aggressive histologic features in prostate cancer. Appl Immunohistochem Mol Morphol. 2006;14:375–383. doi: 10.1097/01.pai.0000210417.61117.6c. [DOI] [PubMed] [Google Scholar]
- 24.Yuen H.F., Chua C.W., Chan Y.P., Wong Y.C., Wang X., Chan K.W. Significance of TWIST and E-cadherin expression in the metastatic progression of prostatic cancer. Histopathology. 2007;50:648–658. doi: 10.1111/j.1365-2559.2007.02665.x. [DOI] [PubMed] [Google Scholar]
- 25.van Oort I.M., Tomita K., van Bokhoven A., Bussemakers M.J., Kiemeney L.A., Karthaus H.F., Witjes J.A., Schalken J.A. The prognostic value of E-cadherin and the cadherin-associated molecules alpha-, beta-, gamma-catenin and p120ctn in prostate cancer specific survival: a long-term follow-up study. Prostate. 2007;67:1432–1438. doi: 10.1002/pros.20626. [DOI] [PubMed] [Google Scholar]
- 26.Gravdal K., Halvorsen O.J., Haukaas S.A., Akslen L.A. A switch from E-cadherin to N-cadherin expression indicates epithelial to mesenchymal transition and is of strong and independent importance for the progress of prostate cancer. Clin Cancer Res. 2007;13:7003–7011. doi: 10.1158/1078-0432.CCR-07-1263. [DOI] [PubMed] [Google Scholar]
- 27.Umbas R., Schalken J.A., Aalders T.W., Carter B.S., Karthaus H.F., Schaafsma H.E., Debruyne F.M., Isaacs W.B. Expression of the cellular adhesion molecule E-cadherin is reduced or absent in high-grade prostate cancer. Cancer Res. 1992;52:5104–5109. [PubMed] [Google Scholar]
- 28.Pontes J., Jr, Srougi M., Borra P.M., Dall' Oglio M.F., Ribeiro-Filho L.A., Leite K.R. E-cadherin and beta-catenin loss of expression related to bone metastasis in prostate cancer. Appl Immunohistochem Mol Morphol. 2010;18:179–184. doi: 10.1097/PAI.0b013e3181640bca. [DOI] [PubMed] [Google Scholar]
- 29.Rubin M.A., Mucci N.R., Figurski J., Fecko A., Pienta K.J., Day M.L. E-cadherin expression in prostate cancer: a broad survey using high-density tissue microarray technology. Hum Pathol. 2001;32:690–697. doi: 10.1053/hupa.2001.25902. [DOI] [PubMed] [Google Scholar]
- 30.Saha B., Arase A., Imam S.S., Tsao-Wei D., Naritoku W.Y., Groshen S., Jones L.W., Imam S.A. Overexpression of E-cadherin and beta-catenin proteins in metastatic prostate cancer cells in bone. Prostate. 2008;68:78–84. doi: 10.1002/pros.20670. [DOI] [PubMed] [Google Scholar]
- 31.Darling D.S., Stearman R.P., Qi Y., Qiu M.S., Feller J.P. Expression of Zfhep/deltaEF1 protein in palate, neural progenitors, and differentiated neurons. Gene Expr Patterns. 2003;3:709–717. doi: 10.1016/s1567-133x(03)00147-9. [DOI] [PMC free article] [PubMed] [Google Scholar]
- 32.Shaw K.R., Wrobel C.N., Brugge J.S. Use of three-dimensional basement membrane cultures to model oncogene-induced changes in mammary epithelial morphogenesis. J Mammary Gland Biol Neoplasia. 2004;9:297–310. doi: 10.1007/s10911-004-1402-z. [DOI] [PMC free article] [PubMed] [Google Scholar]
- 33.Gmyrek G.A., Walburg M., Webb C.P., Yu H- M., You X., Vaughan E.D., Vande Woude G.F., Knudsen B.S. Normal and malignant prostate epithelial cells differ in their response to hepatocyte growth factor/scatter factor. Am J Pathol. 2001;159:579–590. doi: 10.1016/S0002-9440(10)61729-4. [DOI] [PMC free article] [PubMed] [Google Scholar]
- 34.Roudier M.P., True L.D., Higano C.S., Vesselle H., Ellis W., Lange P., Vessella R.L. Phenotypic heterogeneity of end-stage prostate carcinoma metastatic to bone. Hum Pathol. 2003;34:646–653. doi: 10.1016/s0046-8177(03)00190-4. [DOI] [PubMed] [Google Scholar]
- 35.Liu A.Y., Corey E., Bladou F., Lange P.H., Vessella R.L. Prostatic cell lineage markers: emergence of BCL2+ cells of human prostate cancer xenograft LuCaP 23 following castration. Int J Cancer. 1996;65:85–89. doi: 10.1002/(SICI)1097-0215(19960103)65:1<85::AID-IJC15>3.0.CO;2-H. [DOI] [PubMed] [Google Scholar]
- 36.Corey E., Quinn J.E., Bladou F., Brown L.G., Roudier M.P., Brown J.M., Buhler K.R., Vessella R.L. Establishment and characterization of osseous prostate cancer models: intra-tibial injection of human prostate cancer cells. Prostate. 2002;52:20–33. doi: 10.1002/pros.10091. [DOI] [PubMed] [Google Scholar]
- 37.Berx G., van Roy F. Involvement of members of the cadherin superfamily in cancer. Cold Spring Harb Perspect Biol. 2009;1:a003129. doi: 10.1101/cshperspect.a003129. [DOI] [PMC free article] [PubMed] [Google Scholar]
- 38.Sharma A., Yeow W.S., Ertel A., Coleman I., Clegg N., Thangavel C., Morrissey C., Zhang X., Comstock C.E., Witkiewicz A.K., Gomella L., Knudsen E.S., Nelson P.S., Knudsen K.E. The retinoblastoma tumor suppressor controls androgen signaling and human prostate cancer progression. J Clin Invest. 2010;120:4478–4492. doi: 10.1172/JCI44239. [DOI] [PMC free article] [PubMed] [Google Scholar]
- 39.Tsukamoto T., Nigam S.K. Cell-cell dissociation upon epithelial cell scattering requires a step mediated by the proteosome. J Biol Chem. 1999;274:24579–24584. doi: 10.1074/jbc.274.35.24579. [DOI] [PubMed] [Google Scholar]
- 40.Chunthapong J., Seftor E.A., Khalkhali-Ellis Z., Seftor R.E., Amir S., Lubaroff D.M., Heidger P.M., Jr, Hendrix M.J. Dual roles of E-cadherin in prostate cancer invasion. J Cell Biochem. 2004;91:649–661. doi: 10.1002/jcb.20032. [DOI] [PubMed] [Google Scholar]
- 41.Gao C.F., Xie Q., Su Y.L., Koeman J., Khoo S.K., Gustafson M., Knudsen B.S., Hay R., Shinomiya N., Vande Woude G.F. Proliferation and invasion: plasticity in tumor cells. Proc Natl Acad Sci USA. 2005;102:10528–10533. doi: 10.1073/pnas.0504367102. [DOI] [PMC free article] [PubMed] [Google Scholar]
- 42.Bos P.D., Zhang X.H., Nadal C., Shu W., Gomis R.R., Nguyen D.X., Minn A.J., van de Vijver M.J., Gerald W.L., Foekens J.A., Massague J. Genes that mediate breast cancer metastasis to the brain. Nature. 2009;459:1005–1009. doi: 10.1038/nature08021. [DOI] [PMC free article] [PubMed] [Google Scholar]
- 43.Yates C.C., Shepard C.R., Stolz D.B., Wells A. Co-culturing human prostate carcinoma cells with hepatocytes leads to increased expression of E-cadherin. Br J Cancer. 2007;96:1246–1252. doi: 10.1038/sj.bjc.6603700. [DOI] [PMC free article] [PubMed] [Google Scholar]
- 44.Chao Y.L., Shepard C.R., Wells A. Breast carcinoma cells re-express E-cadherin during mesenchymal to epithelial reverting transition. Mol Cancer. 2010;9:179. doi: 10.1186/1476-4598-9-179. [DOI] [PMC free article] [PubMed] [Google Scholar]
- 45.Chaffer C.L., Brennan J.P., Slavin J.L., Blick T., Thompson E.W., Williams E.D. Mesenchymal-to-epithelial transition facilitates bladder cancer metastasis: role of fibroblast growth factor receptor-2. Cancer Res. 2006;66:11271–11278. doi: 10.1158/0008-5472.CAN-06-2044. [DOI] [PubMed] [Google Scholar]
- 46.Browne G., Sayan A.E., Tulchinsky E. ZEB proteins link cell motility with cell cycle control and cell survival in cancer. Cell Cycle. 2010;9:886–891. doi: 10.4161/cc.9.5.10839. [DOI] [PubMed] [Google Scholar]
- 47.Guarino M. Src signaling in cancer invasion. J Cell Physiol. 2010;223:14–26. doi: 10.1002/jcp.22011. [DOI] [PubMed] [Google Scholar]
- 48.Costantino M.E., Stearman R.P., Smith G.E., Darling D.S. Cell-specific phosphorylation of Zfhep transcription factor. Biochem Biophys Res Commun. 2002;296:368–373. doi: 10.1016/s0006-291x(02)00880-x. [DOI] [PMC free article] [PubMed] [Google Scholar]
- 49.Larue L., Antos C., Butz S., Huber O., Delmas V., Dominis M., Kemler R. A role for cadherins in tissue formation. Development. 1996;122:3185–3194. doi: 10.1242/dev.122.10.3185. [DOI] [PubMed] [Google Scholar]
- 50.Wang Y., Mah N., Prigione A., Wolfrum K., Andrade-Navarro M.A., Adjaye J. A transcriptional roadmap to the induction of pluripotency in somatic cells. Stem Cell Rev. 2010;6:282–296. doi: 10.1007/s12015-010-9137-2. [DOI] [PubMed] [Google Scholar]
- 51.Pfannkuche K., Summer H., Li O., Hescheler J., Droge P. The high mobility group protein HMGA2: a co-regulator of chromatin structure and pluripotency in stem cells? Stem Cell Rev. 2009;5:224–230. doi: 10.1007/s12015-009-9078-9. [DOI] [PubMed] [Google Scholar]
- 52.Glover C.H., Marin M., Eaves C.J., Helgason C.D., Piret J.M., Bryan J. Meta-analysis of differentiating mouse embryonic stem cell gene expression kinetics reveals early change of a small gene set. PLoS Comput Biol. 2006;2:e158. doi: 10.1371/journal.pcbi.0020158. [DOI] [PMC free article] [PubMed] [Google Scholar]
- 53.Hoffman R.M. The pluripotency of hair follicle stem cells. Cell Cycle. 2006;5:232–233. doi: 10.4161/cc.5.3.2397. [DOI] [PubMed] [Google Scholar]
- 54.Hirst C.E., Ng E.S., Azzola L., Voss A.K., Thomas T., Stanley E.G., Elefanty A.G. Transcriptional profiling of mouse and human ES cells identifies SLAIN1, a novel stem cell gene. Dev Biol. 2006;293:90–103. doi: 10.1016/j.ydbio.2006.01.023. [DOI] [PubMed] [Google Scholar]
- 55.Bai L., Rohrschneider L.R. s-SHIP promoter expression marks activated stem cells in developing mouse mammary tissue. Genes Dev. 2010;24:1882–1892. doi: 10.1101/gad.1932810. [DOI] [PMC free article] [PubMed] [Google Scholar]
- 56.Wellner U., Schubert J., Burk U.C., Schmalhofer O., Zhu F., Sonntag A., Waldvogel B., Vannier C., Darling D., zur Hausen A., Brunton V.G., Morton J., Sansom O., Schuler J., Stemmler M.P., Herzberger C., Hopt U., Keck T., Brabletz S., Brabletz T. The EMT-activator ZEB1 promotes tumorigenicity by repressing stemness-inhibiting microRNAs. Nat Cell Biol. 2009;11:1487–1495. doi: 10.1038/ncb1998. [DOI] [PubMed] [Google Scholar]
- 57.van der Pluijm G. Epithelial plasticity, cancer stem cells and bone metastasis formation. Bone. 2010;48:37–43. doi: 10.1016/j.bone.2010.07.023. [DOI] [PubMed] [Google Scholar]
- 58.Zhang X.H., Wang Q., Gerald W., Hudis C.A., Norton L., Smid M., Foekens J.A., Massague J. Latent bone metastasis in breast cancer tied to Src-dependent survival signals. Cancer Cell. 2009;16:67–78. doi: 10.1016/j.ccr.2009.05.017. [DOI] [PMC free article] [PubMed] [Google Scholar]
- 59.Singh A., Settleman J. EMT, cancer stem cells and drug resistance: an emerging axis of evil in the war on cancer. Oncogene. 2010;29:4741–4751. doi: 10.1038/onc.2010.215. [DOI] [PMC free article] [PubMed] [Google Scholar]
- 60.Schmidt-Kittler O., Ragg T., Daskalakis A., Granzow M., Ahr A., Blankenstein T.J., Kaufmann M., Diebold J., Arnholdt H., Muller P., Bischoff J., Harich D., Schlimok G., Riethmuller G., Eils R., Klein C.A. From latent disseminated cells to overt metastasis: genetic analysis of systemic breast cancer progression. Proc Natl Acad Sci USA. 2003;100:7737–7742. doi: 10.1073/pnas.1331931100. [DOI] [PMC free article] [PubMed] [Google Scholar]
Associated Data
This section collects any data citations, data availability statements, or supplementary materials included in this article.
Supplementary Materials
IHC for E-cadherin and ZEB1. Cores from the TMA stained for E-cadherin (A), control rabbit immunoglobulin for E-cadherin (B), ZEB1 (C), and control rabbit immunoglobulin for ZEB1 (D). Images were obtained at 10× magnification, and the insert at 40×. Scale bars = 50 μm. Note expression of E-cadherin at the membrane, as well as nuclear expression of ZEB1.
Expression of E-cadherin and E-cadherin repressors in prostate cancer cell lines. (A) E-cadherin cell surface expression in PC3 and DU145 cells. E-cadherin was measured via FACS after staining with HECD1 antibody. (B) RNA expression of E-cadherin and E-cadherin repressors in prostate cancer cell lines. Cells were grown to subconfluent density for RNA isolation. RNA was isolated from TRIzol extracts, reverse transcribed, and analyzed using real-time PCR for transcripts of E-cadherin, SNAIL, SLUG, ZEB1, and ZEB2. RNA expression is normalized to RPL13A. Numbers next to bars indicate expression levels of RNAs that exceed the scale on the y axis. (C) E-cadherin promoter activity in DU145 sublines. The proximal 1 kB of the E-cadherin promoter placed in front of the luciferase gene was expressed in S-DU145, R-DU145, and T-DU145 cells. Luciferase activity is reported in relative luminescent units (RLUs) after background subtraction. (D) RNA expression of E-cadherin repressors in PC3 cells. PC3 cells were isolated via FACS on the basis of E-cadherin expression. E-cadherin repressors were measured as described in A.
Knockdown and expression of E-cadherin repressors. (A) Knockdown of SNAIL, SLUG, ZEB1, and ZEB2 in S-DU145 and R-DU145 cells. Reduction in RNA expression was calculated relative to cells transfected with scrambled control siRNA. (B) Change in E-cadherin RNA expression in S-DU145 and R-DU145 after knockdown of SNAIL, SLUG, ZEB1, or ZEB2. E-cadherin RNA expression was measured in cells transfected with siRNA as indicated below the bars. Bars reflect the difference between cells transfected with E-cadherin repressors and control siRNA. RNA expression was normalized to RPL13A. Note the fivefold mmcater induction of E-cadherin expression in R-DU145 cells compared with S-DU145 cells after ZEB1 silencing.
Growth curves of R-DU145 and T-DU145 cells in subcutaneous xenografts. Because growth cannot be followed in tibial tumors, cells were injected subcutaneously to evaluate growth rates. Subcutaneous tumors were obtained from four of five T-DU145 and four of five R-DU145 injections. At each time point, the largest diameter of the xenografts was measured using a caliber, and plotted on the y axis.