

Abstract
Prostate-specific deletion of Pten in mice has been reported to recapitulate histological progression of human prostate cancer. To improve on this model, we introduced the conditional ROSA26 luciferase reporter allele to monitor prostate cancer progression via bioluminescence imaging and extensively backcrossed mice onto the albino C57BL/6 genetic background to address variability in tumor kinetics and to enhance imaging sensitivity. Bioluminescence signal increased rapidly in Ptenp−/− mice from 3 to 11 weeks, but was much slower from 11 to 52 weeks. Changes in bioluminescence signal were correlated with epithelial proliferation. Magnetic resonance imaging revealed progressive increases in prostate volume, which were attributed to excessive fluid retention in the anterior prostate and to expansion of the stroma. Development of invasive prostate cancer in 52-week-old Ptenp−/− mice was rare, indicating that disease progression was slowed relative to that in previous reports. Tumors in these mice exhibited a spontaneous inflammatory phenotype and were rapidly infiltrated by myeloid-derived suppressor cells. Although Ptenp−/− tumors responded to androgen withdrawal, they failed to exhibit relapsed growth for up to 1 year. Taken together, these data identify a mild prostate cancer phenotype in C57BL/6 prostate-specific Pten-deficient mice, reflecting effects of the C57BL/6 genetic background on cancer progression. This model provides a platform for noninvasive assessment of how genetic and environmental risk factors may affect disease progression.
The progression of human prostate cancer is a multistep process, beginning with primary tumor formation and ending with metastasis of cancer cells and their growth at secondary tissue sites, such as bone. Although prostate cancer is the most commonly diagnosed visceral neoplasm in men, it typically exhibits slow progression and many more men die with prostate cancer than of it.1,2 The development of genetically engineered mouse models of prostate cancer to model these events presents a considerable challenge, because few models are able to mimic this progression series in detail.3 One model that has gained considerable attention is prostate-specific deletion of the Pten tumor suppressor gene, a gene that is commonly disrupted in human prostate cancer.4 Ptenp−/− mice rapidly developed murine prostatic intraepithelial neoplasia (mPIN), which eventually progressed to invasive adenocarcinoma and metastases in 45% of mice by 12 to 29 weeks; however, metastatic disease was not observed by others using a different prostate-specific Pten mutant allele.5 The Ptenp−/− model is now widely used in an attempt to elucidate the mechanistic basis for prostate cancer progression and as a preclinical model to develop therapeutic interventions.5–8
To evaluate disease progression, time-consuming postmortem studies of large cohorts of mice are required. To circumvent this difficulty, others have used molecular imaging techniques in an effort to noninvasively monitor tumor progression.9 For example, the Ptenp−/− model of prostate cancer was adapted by incorporating a conditional firefly luciferase reporter transgene under control of the β-actin promoter.10 Although bioluminescence imaging (BLI) in these mice enabled monitoring of spontaneous tumorigenesis, this model demonstrated highly variable tumor growth kinetics and could be improved in terms of both the sensitivity and specificity of the bioluminescence signal.
In the present study, we attempted to improve further on the Ptenp−/− mouse model of spontaneous prostate cancer using a more sensitive, more specific, and less variable approach to monitoring prostate cancer progression. Toward this end, we introduced the conditional ROSA26-LSL firefly luciferase allele11 and extensively backcrossed mice onto the albino C57BL/6 genetic background (C57BL/6J-Tyrc-2J/J) and designated these mice C57/Luc/Ptenp. We found a marked difference in prostate cancer progression in C57/Luc/Ptenp mice, compared with other Ptenp−/− mouse models of prostate cancer, indicating a strong influence of the C57BL/6 genetic background. BLI revealed an initial rapid growth phase in the epithelial compartment up to 11 weeks, which was followed by a markedly decreased rate of growth. Progression to microinvasive prostate cancer was rare in 1-year-old animals, and metastatic prostate cancer was never detected. Furthermore, although C57/Luc/Ptenp−/− mice responded to castration by decreases in bioluminescence signal, they failed to exhibit relapsed growth, a finding in contrast to other report.10 Despite the slow disease progression revealed by BLI, another noninvasive imaging modality, magnetic resonance imaging (MRI), indicated progressive increase in prostate volume. Further investigation revealed that this increased signal was derived from fluid retention in the anterior prostate. Furthermore, we documented rapid recruitment of immunosuppressive Gr-1+CD11b+ myeloid-derived suppressor cells (MDSCs), highlighting a possible role for inflammation during early stages of disease progression. This model affords the opportunity to identify and evaluate genetic, inflammatory, and environmental modifiers of prostate cancer progression using a sensitive and specific BLI approach to monitor disease progression.
Materials and Methods
Mouse Strains and Genotyping
All animal procedures were performed with approval from the University of Iowa Animal Care and Use Committee and by the Iowa and Purdue institutional review boards. The B6.Cg-Tg(Pbsn-cre)4Prb (Pb-Cre4+) mice were obtained from the NIH Mouse Models of Human Cancer Consortium, the C;129S4-Ptentm1Hwu/J (Ptenfl/fl) mice were obtained from the Jackson Laboratory (Bar Harbor, ME), and the FVB.129S6 (B6)-Gt(ROSA)26Sortm1(Luc)Kael/J (ROSA26-LSL-Luc) mice were a kind gift from Dr. William Kaelin of the Dana-Farber Cancer Institute. Mice were intercrossed to combine alleles and then backcrossed to C57BL/6J-Tyrc-2J/J (Jackson Laboratory) for seven generations. Mice were genotyped for Cre, floxed alleles of Pten, and luciferase using gene-specific primers, as described previously.11–13 Strains analyzed in the present study were hemizygous for Pb-Cre and homozygous for ROSA26-LSL-Luc. Castration of C57/Luc/Ptenp mice was performed as described previously.14
Imaging
All BLI was performed with an IVIS100 imaging system (Caliper Life Sciences, Hopkinton, MA) as described previously.15 Kinetic imaging studies revealed that the bioluminescence signal showed a broad peak after D-luciferin (Promega, Madison, WI) injection, with 8 minutes being an optimal imaging time point. Bioluminescence signal kinetics were independent of mouse genotype and age (data not shown). Mice were therefore routinely imaged 8 minutes after luciferin injection, using a 20-cm field of view and an exposure time varying from 1 to 30 seconds. Bioluminescence values were calculated by measuring photon flux (photons/second) in a region of interest surrounding the bioluminescence signal (with the edge of the region of interest defined as 5% maximum signal), using Living Image software version 2.5 (Caliper Life Sciences).
Magnetic resonance imaging was performed on a 4.7-T Varian Unity/INOVA small-bore MRI scanner (Varian, Palo Alto, CA) equipped with a 38-mm-diameter transmit-receive volume radio frequency (RF) coil. T2-weighted images were acquired in all three principal planes (axial, sagittal, and coronal) using a fast spin-echo (FSE) pulse sequence with repetition time TR = 3000 to 4500 ms, echo time TE = 48 ms, echo train length ETL = 8, and averages = 7. A matrix size of 512 × 128 covered a field of view of 72 mm × 32 mm, with 25 to 45 contiguous slices of 1.0 mm thickness. The TR and number of slices depended on the size of the animal and the slice orientation.
RNA, DNA, and Protein Analysis
Tissues from C57/Luc/Ptenp mice were removed and flash-frozen in liquid nitrogen for subsequent protein and RNA preparation. For RNA extraction, frozen samples were homogenized using a mortar and pestle, suspended into RNeasy lysis buffer (buffer RLT; Qiagen, Valencia, CA), and subjected to RNA extraction under the manufacturer's conditions (RNeasy kit; Qiagen). Purified RNA preparations were subjected to DNase I treatment to remove any contaminating genomic DNA. For protein preparation, tissues were prepared as described previously.16 Protein samples (150 μg) were subjected to an in vitro luciferase activity assay as described previously.16 RNA and DNA samples were subjected to quantitative PCR as described previously.17 For RNA analysis, laser-capture microdissection was performed on 5-μm frozen sections cut using a Leica cryostat microtome (Leica Microsystems, Wetzlar, Germany). Sections were cut from samples embedded in Tissue-Tek optimum cutting temperature compound (Sakura Finetek, Torrance, CA) on charged superfrost glass slides (Fisher Scientific, Waltham, MA), dehydrated using a graded series of ethanol, and air-dried for 30 minutes. For DNA analysis, laser-capture microdissection was performed on paraffin-embedded 7-μm sections cut using a Leica microtome. Prostatic epithelial and stromal cells were collected on Arcturus HS LCM caps (Applied Biosystems, Sunnyvale, CA). RNA was extracted using an Arcturus Picopure RNA isolation kit (Applied Biosystems) and subjected to DNase I treatment to remove any contaminating genomic DNA. DNA was extracted using an Arcturus Picopure DNA isolation kit (Applied Biosystems) according to the manufacturer's instructions.
Histopathology and Immunofluorescence
Prostates were fixed in 4% paraformaldehyde overnight, transferred to 30% ethanol, embedded in paraffin and stained with H&E or Masson's trichrome in accordance with standard procedures. Prostate pathology was assessed according to the criteria established by Shappell et al.18 For immunofluorescence, sections were stained with antibodies to phospho S6 (1:200) (S235/S236; Cell Signaling, Danvers, MA), phospho AKT (1:200) (S473, T308; Cell Signaling), and Ki-67 (1:400) (Novocastra, Newcastle, UK), using heated citrate buffer antigen retrieval. For H&E and immunofluorescence analyses, images were taken using an Olympus BX-61 microscope.
Fluorescence-Activated Cell Sorting Analysis of Inflammatory Subsets
Prostate tissue was placed in a solution of 2 μg/mL collagenase D (Roche, Nutley, NJ) in RPMI-1640 medium containing 10% fetal bovine serum. Tissue was minced, placed at 37°C for 1 hour for digestion, and then was passed through a 70-μm filter. Spleens were removed and ground between frosted microscope slides in PBS. Red blood cells were lysed with ACK buffer and passed through a 70-μm filter. Single cell suspensions were then incubated with TruStain FcX antibody (BioLegend, San Diego, CA) and stained with directly conjugated antibodies (eBioscience, San Diego, CA; BioLegend) according to the manufacturer's instructions. Flow-cytometric analysis was performed on a FACSCanto system (BD Biosciences, Franklin Lakes, NJ) and data were analyzed using FlowJo software version 7.6.2 (Tree Star, Ashland, OR).
MDSC Activation Assays
For analysis of arginase-1 (Arg1) and inducible nitric oxide synthase (iNOS) expression analysis, total RNA was prepared from fluorescence-activated cell-sorted CD45+Gr-1+CD11b+ cells using an RNeasy kit (Qiagen). cDNA was synthesized using a qScript Flex cDNA synthesis kit (Quanta BioSciences, Gaithersburg, MD). Quantitative RT-PCR was performed using TaqMan primer and probe sets for mouse Arg1, iNOS, and 18S rRNA (Applied Biosystems, Carlsbad, CA). Relative mRNA expression was calculated as 2 − (Ct of Arg1 or iNOS − Ct of 18S rRNA), where Ct is the threshold cycle value. Data were normalized to 18S RNA and are representative of three independent experiments.
For in vitro suppression assays, CD45+Gr-1+CD11b+ cells were pooled from four mice per group. Cells were sorted from tissues using an iCyt Reflection cell sorter (iCyt, Champaign, IL) and were seeded at 1 × 10⁵ per well. Thy1.1+ OT-I cells were preactivated for 24 to 48 hours with SIINFEKL (1 mg/mL), purified by Fico/Lite gradient medium (Atlanta Biologicals, Lawrenceville, GA), and added at 1 × 10⁵ cells per well. Bromodeoxyuridine (BrdU) was added directly to OT-I cells at the time of incubation with MDSC and cells were harvested for analysis of proliferation after 12 hours. To evaluate suppression, the percentage of BrdU+Thy1.1+ cells was analyzed by flow cytometry. The percentage suppression of proliferation was calculated as [1 − (proliferation with MDSC/proliferation without MDSC)] × 100.
Results
Generation and Characterization of C57/Luc/Ptenp Mice
To generate C57/Luc/Ptenp mice, we incorporated the ROSA26-LSL-luciferase allele11 into Pb-Cre4+12 and Ptenfl/fl13 animals and backcrossed them for seven generations onto the C57BL/6J-Tyrc-2J/J genetic background. Key features of this approach are that luciferase expression is specifically coupled to the tumor-initiating event and that ROSA26-driven luciferase expression is not expected to be androgen dependent; this approach departs from previous efforts, in which luciferase is expressed in the prostate epithelium under the control of androgen-dependent promoters.19–21 In C57/Luc/Ptenp mice, bioluminescence signal was largely restricted to the prostate (Figure 1; see also Supplemental Figure S1 at http://ajp.amjpathol.org) and, as expected, prostate epithelial cells in C57/Luc/Ptenp−/− mice exhibited phosphorylation of AKT on Thr308 (pAKTT308) and Ser473 (pAKTS473) (see Supplemental Figure S2 at http://ajp.amjpathol.org). Because the Pb-Cre4 transgene has been reported to be expressed in prostatic stroma,12 albeit at low levels, we performed quantitative PCR for the recombined luciferase allele in genomic DNA isolated from epithelium and stroma of C57/Luc/Ptenp−/− prostates via laser-capture microdissection (see Supplemental Figure S3, A and B, at http://ajp.amjpathol.org). We detected minute levels of recombined luciferase in the stroma, consistent with the previous report; however, we detected significantly greater levels of recombination (50-fold) in the epithelium, suggesting that the majority of bioluminescence signal in C57/Luc/Ptenp mice is exclusive to prostate epithelial cells.
Figure 1.
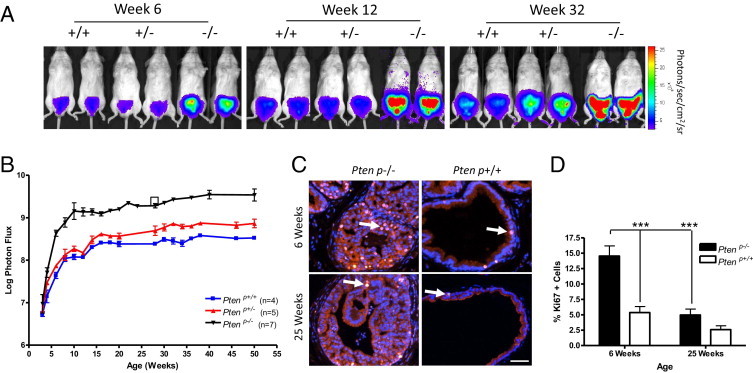
Bioluminescence imaging (BLI) of prostate cancer progression in C57/Luc/Ptenp−/− mice reveals biphasic expansion of the prostatic epithelium. A: Bioluminescent overlay images from the IVIS100 imaging system demonstrate increasing bioluminescence intensity in C57/Luc/Ptenp+/− and Ptenp−/− mice from 6 to 32 weeks. B: Quantitation of bioluminescence signal demonstrates that bioluminescence increase is rapid in C57/Luc/Ptenp−/− mice from 3 to 11 weeks, but then is slow from 11 to 52 weeks. Bioluminescence intensity also increases in C57/Luc/Ptenp+/− mice, compared with Ptenp+/+ mice, from 20 weeks. The bioluminescence signal is expressed as log photon flux (photons/second) from the region of interest surrounding the prostate. The square represents bioluminescence signal from nonserially imaged C57/Luc/Ptenp−/− mice. C: Immunofluorescence for Ki-67 demonstrates that bioluminescence intensity is correlated with proliferation in the prostatic epithelium. The 6-week-old C57/Luc/Ptenp−/− mice exhibit increased proliferation rates, compared with rates at 25 weeks. Examples of Ki-67-positive cells are marked by arrows. Scale bar = 100 μm. D: Quantitation of Ki-67-positive cells (% of total DAPI-positive epithelial cells) reveals a significant reduction in proliferation from 6 weeks to 25 weeks in C57/Luc/Ptenp−/− mice. ***P < 0.001, Student's t-test.
Bioluminescence Imaging of Prostate Cancer Progression in C57/Luc/Ptenp Mice Reveals Biphasic Expansion of the Prostatic Epithelium
We performed BLI weekly in C57/Luc/Ptenp wild-type (Ptenp+/+), Pten heterozygous (Ptenp+/−), and Pten homozygous (Ptenp−/−) mice from weaning, to determine whether bioluminescence signal correlates with prostate cancer progression (Figure 1, A and B). Bioluminescence signal increased rapidly from 3 to 11 weeks independent of Pten status, albeit to a much greater extent in C57/Luc/Ptenp−/− than in either C57/Luc/Ptenp+/+ or C57/Luc/Ptenp+/− mice (Figure 1, A and B). Increasing signal in all three genotypes during this period is influenced by development, growth and maturation of the prostate during puberty, as well as asynchronous expression of Cre, as documented previously.12 Nonetheless, the magnitude of increase in C57/Luc/Ptenp−/− mice suggests that bioluminescence signal correlates with the development of prostate cancer in this model, consistent with previous studies.4
Notably, bioluminescence intensity increased at a much slower rate in all mice from 11 to 52 weeks (Figure 1B). Because we expected to see a more pronounced increase in Ptenp−/− mice, we performed several studies to eliminate potential artifacts. First, we determined that serial BLI measurements did not affect disease progression; a mouse that had not been imaged before 25 weeks showed a signal similar to that of the cohort of mice that had been serially imaged (Figure 1B). Next, we examined whether expression of luciferase mRNA from the ROSA26 promoter was dependent on Pten status or on age. Laser-capture microdissection of prostate epithelium showed that luciferase mRNA levels are equivalent in Ptenp−/− and Ptenp+/+ mice across a range of ages (see Supplemental Figure S3C at http://ajp.amjpathol.org). Furthermore, and in contrast to the report of Liao et al,10 the overall kinetics of tumor growth as visualized by BLI were very similar across all individual C57/Luc/Ptenp−/− mice (see Supplemental Figure S4 at http://ajp.amjpathol.org), and bioluminescence signal intensity was also at least 10-fold greater in C57/Luc/Ptenp−/− mice, suggesting that expression of luciferase from the endogenous ROSA26 promoter and/or white coat color may facilitate detection of pathological changes in the prostate.22 In support of this notion, we observed that bioluminescence signal in C57/Luc/Ptenp+/− mice increased significantly from 28 weeks of age, compared with C57/Luc/Ptenp+/+ mice (Figure 1B). Histopathology revealed that increases in bioluminescence signal were correlated with the onset of focal mPIN in Ptenp+/− animals at 25 weeks (see below), demonstrating that BLI is sensitive enough to capture the development of this rather subtle pathological change in C57/Luc/Ptenp+/− mice. Finally, to determine whether the biphasic nature of bioluminescence signal in C57/Luc/Ptenp−/− mice is correlated with changes in the proliferative status of the prostatic epithelium, we evaluated the expression of Ki-67 in tissue sections. Immunofluorescence analysis revealed a significant increase in Ki-67-positive cells in Ptenp−/−, compared with C57/Luc/Ptenp+/+ mice, at 6 weeks of age (Figure 1, C and D). However, proliferation dramatically decreased in 25-week-old C57/Luc/Ptenp−/− mice, compared with the same genotype at 6 weeks of age. Taken together, these data show that bioluminescence signal faithfully reflects the biphasic expansion of the prostatic epithelium in C57/Luc/Ptenp mice.
MRI Reveals Significant Increases in Prostate Growth in C57/Luc/Ptenp−/− Mice
Previous studies using prostate-specific Ptenp−/− mice have documented progressive increases in prostate tumor growth assessed using other noninvasive imaging modalities, such as ultrasound or MRI.23–25 In contrast, BLI of tumor growth in C57/Luc/Ptenp−/− mice indicated a much slower growth rate. We therefore used MRI as an alternative noninvasive imaging modality to monitor prostate growth of C57/Luc/Ptenp−/− mice at 3, 6, and 12 months of age (Figure 2). MRI revealed a progressive increase in prostate growth in C57/Luc/Ptenp−/− mice from 3 to 12 months of age (Figure 2, A and B). Quantification revealed an approximate 70-fold increase in prostate volume from 3 to 12 months (Figure 2B); however bioluminescence intensities from the same animals were not significantly different (Figure 2B). The discrepancy between the MRI and BLI data suggested that the expansion of nonepithelial compartments contributes significantly to prostate growth in C57/Luc/Ptenp−/− mice. When we analyzed 12-month-old C57/Luc/Ptenp−/− mice post mortem, we noticed that anterior prostate (AP) lobes were fluid-filled, not solid tumors (Figure 2C; photos); thus, the increase in prostate volume detected by MRI was due to fluid retention in the AP and not to tumor growth. Histopathology of drained AP in C57/Luc/Ptenp−/− mice revealed that the majority of prostate tissue consisted of dense fibrotic stroma with a thin layer of epithelial cells (Figure 2C). These data reveal that, despite slow expansion of the prostatic epithelium in C57/Luc/Ptenp−/− mice, other complications such as prostatic fluid retention and expansion of the stromal compartment contribute to increases in prostate size in C57/Luc/Ptenp−/− mice.
Figure 2.
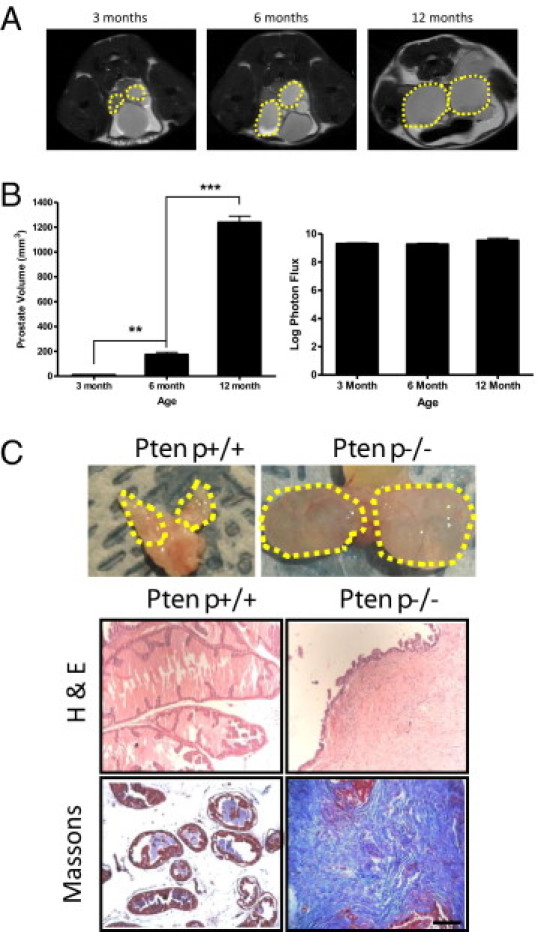
Magnetic resonance imaging reveals progressive increases in prostate growth attributable to excessive fluid retention in anterior prostate (AP) and stromal responses. C57/Luc/Ptenp−/− mice aged 3 months (n = 3), 6 months (n = 3), and 12 months (n = 3) were subjected to MRI to assess bulk prostate growth. A: Sagittal MRI images demonstrate progressive increases in prostate growth from 3 to 12 months of age (dashed line). B: Quantitation of MRI indicates significant increase in prostate volume (left), but BLI does not (right). C: Postmortem analyses revealed considerable fluid retention in AP from 12-month-old C57/Luc/Ptenp−/− mice, compared with age-matched C57/Luc/Ptenp+/+ mice (dashed lines, top row; imaging captured by digital camera). H&E and Masson's trichrome staining demonstrate florid stromal response in AP from 52-week-old C57/Luc/Ptenp−/− mice. Scale bar = 100 μm. **P < 0.01, ***P < 0.001, one-way analysis of variance.
Slow Disease Progression in C57/Luc/Ptenp−/− Mice
To assess the histological progression of prostate cancer in C57/Luc/Ptenp mice and to correlate these findings with BLI, we analyzed and quantified H&E-stained prostate sections of C57/Luc/Ptenp+/+, Ptenp+/−, and Ptenp−/− mice (Figure 3 and Table 1; see also Supplemental Figures S5 and S6 at http://ajp.amjpathol.org). The development of mPIN was evident as early as 6 weeks in dorsal prostates (DP) and lateral prostates (LP) in C57/Luc/Ptenp−/− mice (Figure 3 and Table 1; see also Supplemental Figure S5 at http://ajp.amjpathol.org). mPIN was more prominent in DP and LP than in the ventral prostate (VP) and AP at 6 weeks, suggesting that increases in bioluminescence signal intensity from 3 to 6 weeks are due mostly to development of mPIN in DP and LP (Figure 3B; see also Supplemental Figure S5A at http://ajp.amjpathol.org). From 6 to 12 weeks, however, we detected a large increase in the number of mPIN lesions developing in VP and AP. These findings suggest that the large increase in bioluminescence signal intensity from 6 to 12 weeks (Figure 1A) correlates mostly with the development of mPIN in VP and AP, and only to a lesser extent in DP and LP (Figure 3B; see also Supplemental Figure S5B at http://ajp.amjpathol.org). At 25 weeks, the degree of mPIN was similar to that of 12-week-old animals, with only small increases in the number of lesions detected in VP and AP. In contrast to findings from other studies,4,5,25,26 we did not detect any evidence of microinvasive prostate cancer in C57/Luc/Ptenp−/− mice at 25 weeks. The 25-week-old C57/Luc/Ptenp+/− mice presented with focal areas of mPIN in DP, LP, and AP (Figure 3B; see also Supplemental Figure S5 at http://ajp.amjpathol.org), suggesting that the increase in bioluminescence signal intensity (Figure 1A) in these mice correlates with these pathological findings. At 52 weeks of age, we detected only a small increase in the number of mPIN lesions in VP (Figure 3B), correlating with a small increase in bioluminescence intensity from 25 to 52 weeks. Furthermore, only approximately 30% of 52-week-old C57/Luc/Ptenp−/− mice exhibited microinvasive lesions in LP and VP (Figure 3A and Table 1). The AP in the same animals consisted only of mPIN lesions and pronounced fibrosis (see Supplemental Figure S5 at http://ajp.amjpathol.org). Notably, we did not detect any signs of regional or distant metastases when mice were analyzed at necropsy via BLI or lymph node histology up to 52 weeks (see Supplemental Figure S6 at http://ajp.amjpathol.org). These data demonstrate that prostate cancer progression in C57/Luc/Ptenp−/− mice is slower than reported from other published studies using mixed genetic backgrounds. Furthermore, the histopathological findings correlate precisely with prostate tumor growth assessed via BLI.
Figure 3.
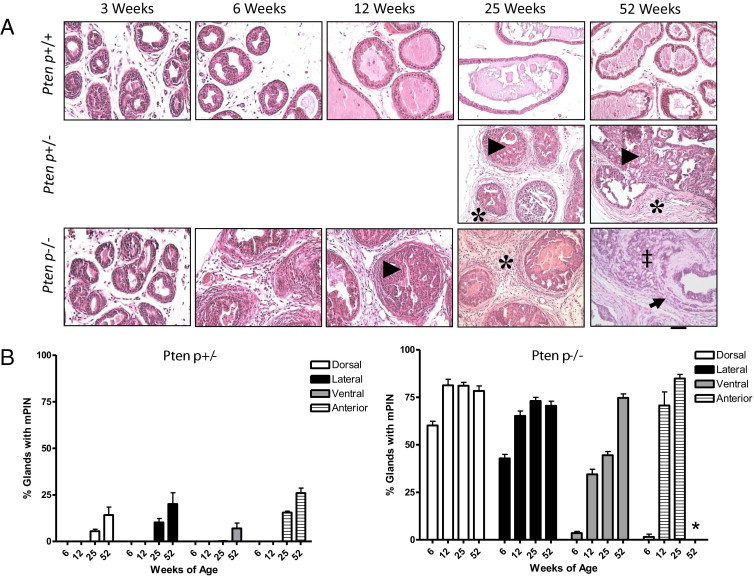
Histological disease progression in C57/Luc/Pten mice. C57/Luc/Ptenp−/−, Ptenp+/−, and Ptenp+/+ mice were analyzed for pathological changes to the prostatic epithelium via histology. A: Hematoxylin and eosin staining of Ptenp+/+, Ptenp+/−, and Ptenp−/− mice demonstrates the development of pathological changes to the epithelial and stromal compartments in Ptenp+/− and Ptenp−/− mice. Arrowheads mark mPIN lesions, asterisks mark stromal response, the double dagger marks loss of gland architecture, and the arrow marks invasive lesion in a 52-week-old Ptenp−/− animal. Scale bar = 100 μm. B: Quantitative analysis of mPIN lesions in individual prostate lobes of Ptenp+/− and Ptenp−/− mice demonstrates that lobular progression to mPIN is asynchronous. No data were collected for AP of 52-week-old Ptenp−/− (asterisk). For numbers of animals, see Table 1.
Table 1.
Pathological Changes to Prostates of C57/Luc/Ptenp−/− and Ptenp+/− Mice
| Pathological change (no. of animals) |
||||||
|---|---|---|---|---|---|---|
| Genotype | Age (weeks) | N | mPIN | Microinvasion | Metastases | Fibrosis |
| Ptenp−/− | 6 | 3 | 3 | 0 | 0 | 0 |
| 9 | 2 | 2 | 0 | 0 | 0 | |
| 12 | 3 | 3 | 0 | 0 | 3 | |
| 25 | 7 | 7 | 0 | 0 | 7 | |
| 52 | 7 | 7 | 2⁎ | 0 | 7 | |
| Ptenp+/− | 25 | 3 | 3⁎ | 0 | 0 | 3⁎ |
| 52 | 7 | 7⁎ | 0 | 0 | 7⁎ | |
Focal lesions.
Despite slow disease progression in the epithelial compartment, we noted significant changes in the prostatic stroma of C57/Luc/Ptenp−/− mice. A stromal response is evident as early as 6 weeks, surrounding glands exhibiting mPIN, and stromal cellularity progressively increases with age (Figure 3A). Masson's trichrome staining revealed extensive collagen deposition (fibrosis) in 25-week-old Ptenp−/− prostates (Figure 4A). In C57/Luc/Ptenp+/− mice, a stromal response was evident surrounding glands exhibiting focal mPIN (Figure 3A).
Figure 4.
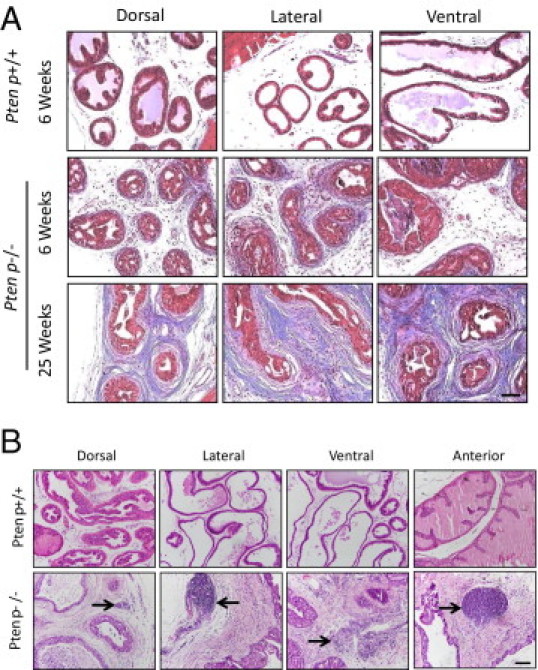
Stromal changes in prostates from C57/Luc/Ptenp−/− mice. A: Masson's trichrome stain in C57/Luc/Ptenp+/+ and Ptenp−/− mice demonstrates increased collagen deposition in 25-week-old Ptenp−/− prostates. B: H&E stain reveals infiltrating inflammatory cells (arrows) in prostate lobes of 25-week-old C57/Luc/Ptenp−/− mice. Scale bars = 100 μm.
C57/Luc/Ptenp−/− Mice Respond to Castration, but Tumors Do Not Relapse to a Growth Phase
Previous studies have demonstrated that prostates of Ptenp−/− mice are able to proliferate in the absence of androgens and will ultimately develop castrate-resistant prostate cancer.4,10 To assess this possibility in C57/Luc/Ptenp mice, we castrated mice at 11 weeks and monitored response via BLI (Figure 5). Importantly, in our approach the luciferase expression from the ROSA26 promoter is not expected to be influenced by androgen levels, in contrast to other bioluminescent models.19–21 Castration induced a decrease in bioluminescence signal intensity in C57/Luc/Ptenp−/− and Ptenp+/− mice. After castration, bioluminescence intensity in Ptenp−/− mice decreased by an order of magnitude, but remained at a constant level for the duration of the study, well above the levels detected at the initial measurement at 3 weeks. We did not, however, detect a relapse in tumor growth up to 1 year after castration, suggesting that Ptenp−/− prostate epithelial cells are unable to proliferate substantially in the absence of androgens. At 20 weeks after castration, bioluminescence signal in C57/Luc/Ptenp+/− mice returned to levels similar to those present in 3-week-old mice (Figure 5A).
Figure 5.
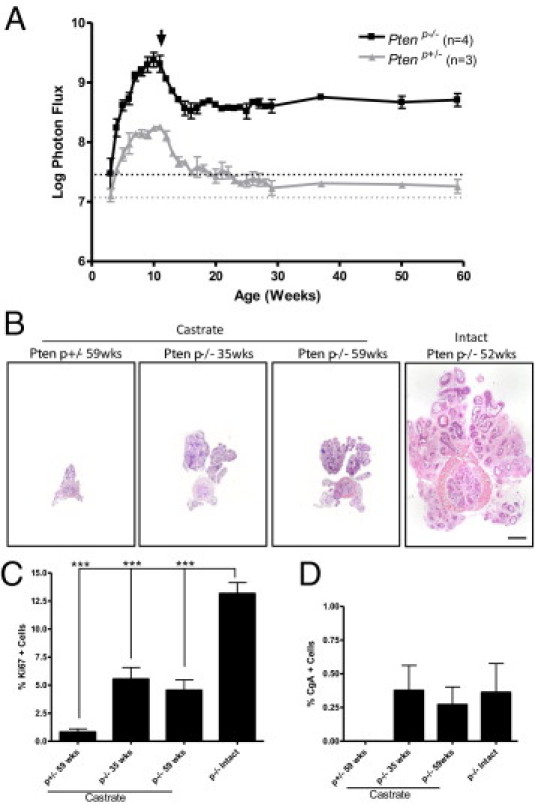
C57/Luc/Ptenp−/− mice exhibit persistence of a castrate-resistant population of epithelial cells, but fail to relapse to a growth phase. C57/Luc/Ptenp−/− mice were monitored for response to hormone deprivation therapy via BLI and histopathology. A: Quantitation of bioluminescence signal demonstrates that after castration at 11 weeks (arrow), bioluminescence signal in Ptenp−/− mice remains constant above initial values at 3 weeks (dotted horizontal line), compared with Ptenp+/− mice, which display progressively decreasing signal intensity. B: Images of whole prostate sections demonstrate that castrated Ptenp−/− prostates are significantly smaller than intact 52-week-old Ptenp−/− prostates. Castrated Ptenp−/− prostates at 35 and 59 weeks after castration are of similar size. Scale bar = 1 mm. C: Ki-67 staining reveals that castrated Ptenp−/− prostates proliferate significantly less than intact 6-week-old Ptenp−/− prostates. D: Quantitation of chromogranin A (CgA) staining reveals no significant difference in numbers of CgA-positive cells in castrated versus intact Ptenp−/− prostates. ***P < 0.001, Student's t-test.
To correlate our BLI findings with the histopathology of castrated Ptenp−/− prostate tumors, we first analyzed H&E-stained sections from mice at 35 weeks and 59 weeks after castration and compared them with 52-week-old intact Ptenp−/− mice. Consistent with BLI findings, castrated prostates were significantly smaller than intact 52-week-old specimens (Figure 5B). Furthermore, castrated Ptenp+/− prostates were significantly smaller than castrated Ptenp−/− prostates, correlating with significantly decreased bioluminescence signal intensity in castrated Ptenp+/− animals. We did not see a difference in overall prostate size between Ptenp−/− prostates analyzed at 35 weeks after castration, compared with 59 weeks (Figure 5B), nor did we see any difference in Ki-67 proliferative levels between the two (Figure 5C), demonstrating that castrated Ptenp−/− prostates fail to relapse to a growth phase, again consistent with BLI findings.
To determine whether castrated Ptenp−/− prostate tumors underwent significant neuroendocrine differentiation, as has been reported,10 we quantified the number of cells positive for chromogranin A (CgA) in castrated and intact Ptenp−/− prostates. We did not find any significant difference between the numbers of CgA-positive cells in castrated versus intact Ptenp−/− prostates, demonstrating that androgen deprivation does not induce significant neuroendocrine differentiation in C57/Luc/Ptenp−/− mice, consistent with the mild prostate cancer phenotype in the present study. Taken together, these data demonstrate that C57/Luc/Ptenp−/− respond to androgen deprivation by a decrease in bioluminescence intensity. In contrast to findings from other studies, however, the tumors do not exhibit relapsed growth or neuroendocrine differentiation in the castrate state.
Recruitment of MDSCs in Prostates of C57/Luc/Ptenp−/− Mice
During our histological assessment of prostate cancer progression, we noticed that prostates of older C57/Luc/Ptenp−/− mice contained large foci of inflammatory cells, indicative of a chronic inflammatory response (Figure 4B). To characterize this response, we dissected individual prostate lobes from 4-month-old C57/Luc/Ptenp−/− and C57/Luc/Ptenp+/+ mice and performed fluorescence-activated cell sorting analysis of infiltrating leukocytes (Figure 6A). We documented a significant increase in the number of infiltrating leukocytes in prostates of C57/Luc/Ptenp−/− mice, and this was a function of age (Figure 6A; see also Supplemental Figure S7, A and B, at http://ajp.amjpathol.org). Because of emerging recognition of the role of MDSCs in cancer progression, we sought to determine the contribution of Gr-1+CD11b+ cells to the total leukocyte population.27,28 We detected large numbers of Gr-1+CD11b+ cells in prostates of C57/Luc/Ptenp−/− mice, but prostates of Ptenp+/+ mice contained only trace numbers of Gr-1+CD11b+ cells (Figure 6B; see also Supplemental Figure S7C at http://ajp.amjpathol.org). Strikingly, >70% of the total population of CD45+ cells in the DP of C57/Luc/Ptenp−/− mice were Gr-1+CD11b+ (see Supplemental Figure 7D at http://ajp.amjpathol.org).
Figure 6.
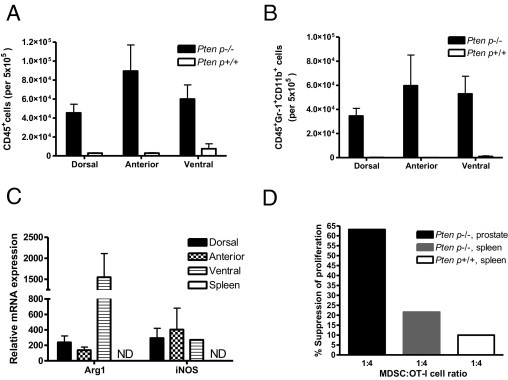
Recruitment of CD45+Gr-1+CD11b+ cells, which express Arg-1 and iNOS and are T-cell suppressive, in prostates of C57/Luc/Ptenp−/− mice. Prostates from 4-month-old C57/Luc/Ptenp−/− (n = 6) and Ptenp+/+ mice (n = 6) were analyzed for infiltrating CD45+ and CD45+Gr-1+CD11b+ cells by fluorescence-activated cell sorting and were assessed for Arg-1 and iNOS expression and for their ability to inhibit T-cell proliferation in vitro. A: Absolute numbers of infiltrating CD45+ cells are increased in DP, AP, and VP in Ptenp−/− C57/Luc mice. B: Absolute numbers of CD45+CD11b+ and Gr-1+ cells are increased in DP, AP, and VP of C57/Luc/Ptenp−/− mice. C: Arg-1 and iNOS are up-regulated in prostate CD45+Gr-1+CD11b+ cells. ND, not detected. D: CD45+Gr-1+CD11b+ cells from prostates of C57/Luc/Ptenp−/− mice are more potent suppressors of T-cell proliferation in vitro, compared with the two other genotypes.
Activated Gr-1+CD11b+ cells with the capacity to suppress T-cell responses (ie, MDSCs) are known to express high levels of both iNOS and Arg1, which have been shown to be directly involved in inhibiting T-cell function.27,29 Levels of Arg1 and iNOS were significantly up-regulated in Gr-1+CD11b+ cells from the DP, VP, and AP of C57/Luc/Ptenp−/− mice (Figure 6C); however, we did not detect expression of either transcript in purified MDSCs from the spleens of the same animals, suggesting that the immunosuppressive function of MDSCs is restricted to the prostate. To determine whether Gr-1+CD11b+ cells in the prostates of C57/Luc/Ptenp−/− mice were functional MDSCs, we collected purified populations of Gr-1+CD11b+ cells from the prostates and spleens of C57/Luc/Ptenp−/− and Ptenp+/+ mice and performed an in vitro T-cell suppression assay (Figure 6D). Purified Gr-1+CD11b+ cells from the prostates of C57/Luc/Ptenp−/− mice exhibited strong suppressive activity that was more potent than suppression by Gr-1+CD11b+ cells from the spleens of C57/Luc/Ptenp−/− mice or spleens of C57/Luc/Ptenp+/+ mice (Figure 6D). These functional data clearly define the Gr-1+CD11b+ cells isolated from prostate tumors as MDSCs. Taken together, these data show that the robust inflammatory response seen in prostates of C57/Luc/Ptenp−/− mice is characterized by enhanced recruitment of MDSCs that possess hallmark T-cell suppressive functions.
Discussion
In the present study, we have developed a new model of prostate cancer, C57/Luc/Ptenp mice. Prostate-specific deletion of Pten was first reported in 2003,4 and since then has become a widely used mouse model of prostate cancer. We developed C57/Luc/Ptenp mice in an effort to improve on this model. We found that bioluminescence signal intensity in C57/Luc/Ptenp mice was significantly greater than in other comparable models,10,19,20 was almost exclusively restricted to prostate epithelial cells, and was correlated with the proliferative capacity of the prostatic epithelium. Although BLI of 3- to 11-week-old C57/Luc/Ptenp−/− mice revealed rapid growth of the prostatic epithelium, subsequent epithelial expansion was slow. MRI revealed progressive increases in prostate volume, which was attributed to excessive fluid retention and stromal responses in AP rather than to solid tumor growth, warranting caution when using MRI to analyze prostate growth in tumor-prone mice. Furthermore, we found a marked difference in prostate cancer progression in C57/Luc/Ptenp−/− mice, compared with previous studies in Ptenp−/− mice. Invasive prostate cancer was rare even in 1-year-old animals, and we did not detect metastatic disease.
Several studies have described the detection of metastatic prostate cancer in Ptenp−/− animals,4,10,30,31 and all have reported highly penetrant invasive adenocarcinomas, albeit with variable latency.5,23–26,30,32 To our knowledge, the present study is the first to report the tumor phenotype in cohorts of prostate-specific Ptenp−/− animals extensively backcrossed to the C57BL/6 genetic background. This model does not recapitulate the pace, extent, or variability of disease progression associated with prostate-specific Pten deletion on mixed 129 genetic backgrounds (ie, C57BL/6;DBA;129/BALB/c;FVB/N,10 129/C57BL/6,32 129;C57BL/6;DBA;BALB/c,4,25 and 129;FVB30). Prior studies have clearly demonstrated that Pten-dependent tumorigenesis is influenced by genetic background,33 which is also known to affect prostate gene expression in mice.34
Blando et al35 recently reported that Pten deficiency is fully penetrant for prostate adenocarcinoma in the anterior prostate of constitutive Pten+/− animals on an extensively backcrossed C57BL/6 genetic background. This finding is most surprising in light of our results, in which there was little progression beyond focal mPIN in the C57/Luc/Ptenp+/− mice. There may be a different cell of origin in the constitutive Pten knockout mouse prostate, compared with tissue-specific knockout mice using Pb-Cre4. Other studies are in accord with our findings of mild disease progression in the C57BL/6 background. TRAMP mice on a C57BL/6 genetic background frequently survive to 36 to 40 weeks of age, and sometimes up to 52 weeks of age, whereas those on a C57BL/6;FVB F1 background never survive past 33 weeks of age.36 However, genetic background is likely to collaborate with the specific mutations used to drive prostate cancer in mouse models.37,38 Because in this model disease progression can be assessed noninvasively, the C57/Luc/Ptenp mice described here could be a valuable tool for forward genetic analysis of modifier loci.
The present study also revealed that expansion of the epithelial compartment in C57/Luc/Ptenp−/− mice animals is biphasic, with an initial rapid phase followed by a slow phase. During the rapid phase, we found that the immediate increase in bioluminescence signal intensity from 3 to 6 weeks is due to the development of mPIN in DP and LP, compared with 6 to 11 weeks, when increases in bioluminescence are correlated with mPIN development in VP and AP. During the slow phase from 11 weeks onward, we did not see pronounced development of further mPIN. Moreover, proliferative levels of the epithelium were substantially reduced, compared with the rapid phase. Prior studies indicate that this apparent growth arrest may be due to p53- or p27-induced senescence.5,39 However, it is striking that the biphasic kinetics of bioluminescence signal are independent of Pten status, suggesting that the majority of epithelial tumor growth occurs during the development and maturation phase of the prostate. This raises the possibility that developmental mechanisms in the prostate may trigger a senescence program driven by Pten disruption. Indeed, the developmental timing of Pten deletion has been shown to affect the disease phenotype.40,41 We also found that prostate tumors from C57/Luc/Ptenp−/− mice failed to proliferate in the castrate state for up to 1 year, consistent with the overall diminished disease phenotype in this model. However, bioluminescence signal maintained at a constant level, approximately one order of magnitude above baseline only 4 weeks after castration, suggesting that a population of castrate-resistant cells that were already present in C57/Luc/Ptenp−/− prostate tumors were selected for during androgen deprivation. Accordingly, Gao et al42 demonstrated that prostate epithelial cells from Nkx3.1;Pten mutant mice were capable of surviving in the absence of androgens well before they displayed an overt cancer phenotype, suggesting the early emergence of a castrate-resistant phenotype.
The tumor-associated stroma is a complex microenvironment that consists of a number of extracellular matrix proteins, growth factors, fibroblasts, and immune cells. Stromal expansion in C57/Luc/Ptenp−/− animals was accompanied by increased collagen deposition, as reported previously,4 but also by enhanced recruitment of Gr-1+CD11b+ MDSCs. MDSCs have been shown to accumulate at tumor sites in experimental animals of cancer,43,44 but their accumulation in mouse models of spontaneous prostate cancer has not been assessed to date. We have shown that prostates of C57/Luc/Ptenp−/− mice display a progressive increase in recruitment of Gr-1+CD11b+ cells (which are identified as MDSCs, based on functional studies at 4 months). Furthermore, Gr-1+CD11b+ cells isolated from the prostates expressed high levels of Arg1 and iNOS and were able to more effectively suppress T-cell proliferation in vitro than Gr-1+CD11b+ cells from spleens of the same animals. A recently published model of abacterial prostatitis showed that the immunosuppressive function of MDSC is limited to the inflammatory site.45 We did not, in the present study, determine the relative contribution of MDSCs in prostate cancer progression in these animals, but previous studies have highlighted a crucial role for MDSCs in early cancer development.46 Although speculative, the present data demonstrating diminished prostate cancer progression in C57/Luc/Ptenp−/− mice suggest that MDSC function may be linked to initial tumor development but not to progression to an invasive phenotype. Although the C57/Luc/Ptenp−/− mouse reported here has a much milder phenotype than other prostate-specific Pten mutant models, this model may nonetheless provide a very useful background for evaluating genetic and environmental factors that convert an indolent to an aggressive disease—a process that remains a central question for prostate cancer in humans.
Acknowledgments
We thank members of the Henry laboratory for comments on the manuscript and K. Brooks Henry for assistance.
Footnotes
Supported by pilot grants from the University of Iowa Cancer and Aging Program (5 P20 CA103672), by the Center for Health Effects of Environmental Contamination, and by NIH grants R21-CA137490 and RC1-ES018097 (M.D.H.) and R21-CA154126 (T.L.R. and M.D.H.).
Supplemental material for this article can be found at http://ajp.amjpathol.org or at doi: 10.1016/j.ajpath.2011.03.014.
Supplementary data
Characterization of C57/Luc/Ptenp mice. A: BLI of PbCre+, R26-LSL-Lucfl/fl mice demonstrates that bioluminescence signal emanates from the lower abdominal region, which was confirmed as prostate tissue when prostate and seminal vesicles were imaged ex vivo (right image). B: Detection of the recombined luciferase allele in prostate, seminal vesicles, and testis by PCR. C: Luciferase activity assay in protein homogenates demonstrates that the most intense bioluminescence signal is specific to the prostate.
Activation of the pAKT pathway in C57/Luc/Ptenp−/− mice. Immunofluorescence for pAKT in lateral lobes of 12-week-old Ptenp−/− and Ptenp+/+ mice demonstrates that expression of pAKTS473 and pAKTT308 is restricted to epithelial cells in Ptenp−/− animals. Original magnification, ×20.
Assessing Pb-Cre4 expression in the prostate stroma. A: Laser-capture microdissection qPCR for recombined luciferase in genomic DNA from prostate epithelial cells versus prostate stromal cells demonstrates that, despite low levels of recombination in stroma, a 50-fold increase in recombination occurs in the epithelium. Stroma is set at 1.0. B: Agarose gel electrophoresis of qPCR products demonstrates barely detectable levels of luciferase recombination in prostate stroma. Schematic depicts primer sets used to detect recombined luciferase (Rec-Luc, primer set 1) and luciferase (Luc, primer set 2). C: Laser capture microdissection qRT-PCR for luciferase mRNA in prostate epithelial cells demonstrates that levels of luciferase mRNA expression are similar in Ptenp+/+ versus Ptenp−/− animals. The wild-type Pten+/+ is set at 1.0.
Tumor kinetics of individual C57/Luc/Ptenp−/− mice (n = 14). BLI of 14 individual Ptenp−/− C57/Luc animals demonstrates that tumor kinetics are similar between all animals studied. The bioluminescence signal is expressed as log photon flux (photons/second) from the region of interest surrounding the prostate.
Complete histopathology of prostates from dorsal, lateral, ventral, and anterior prostate in C57/Luc/Ptenp mice at 6, 12, 25, and 52 weeks. Original magnification, ×20.
Histopathology of lymph nodes from C57/Luc/Ptenp mice. A:Ex vivo BLI reveals no bioluminescent signal in draining lymph nodes harvested from two Ptenp−/− mice at 52 weeks. B: Histopathology of draining lymph nodes from A. Original magnification, ×20.
Recruitment of CD45+CD11b+Gr-1+ cells into prostates of C57/Luc/Ptenp−/− mice. A: Dot plots showing CD45+ cells in dorsal/lateral, ventral, and anterior prostate in Ptenp−/− and Ptenp+/+ mice demonstrates increased leukocyte infiltration into Ptenp−/− prostates. B: Percent of total CD45+ cells in prostates of Ptenp−/− and Ptenp+/+ mice aged 2, 4, 6, and 8 months. C: Dot plots showing CD45+CD11b+Gr-1+ cells in dorsal/lateral, ventral, and anterior prostate of Ptenp−/− and Ptenp+/+ C57/Luc mice demonstrates increased infiltration of MDSCs in prostates of Ptenp−/− mice. D: Percent of CD45+ cells that are MDSCs in prostates of Ptenp−/− mice. Up to 70% of CD45+ cells were found to be MDSCs in dorsal prostates of Ptenp−/− mice.
References
- 1.Scher H.I. Prostate carcinoma: defining therapeutic objectives and improving overall outcomes. Cancer. 2003;97:758–771. doi: 10.1002/cncr.11151. [DOI] [PubMed] [Google Scholar]
- 2.Jemal A., Siegel R., Ward E., Hao Y., Xu J., Thun M.J. Cancer statistics, 2009. CA Cancer J Clin. 2009;59:225–249. doi: 10.3322/caac.20006. [DOI] [PubMed] [Google Scholar]
- 3.Pienta K.J., Abate-Shen C., Agus D.B., Attar R.M., Chung L.W., Greenberg N.M., Hahn W.C., Isaacs J.T., Navone N.M., Peehl D.M., Simons J.W., Solit D.B., Soule H.R., VanDyke T.A., Weber M.J., Wu L., Vessella R.L. The current state of preclinical prostate cancer animal models. Prostate. 2008;68:629–639. doi: 10.1002/pros.20726. [DOI] [PMC free article] [PubMed] [Google Scholar]
- 4.Wang S., Gao J., Lei Q., Rozengurt N., Pritchard C., Jiao J., Thomas G.V., Li G., Roy-Burman P., Nelson P.S., Liu X., Wu H. Prostate-specific deletion of the murine Pten tumor suppressor gene leads to metastatic prostate cancer. Cancer Cell. 2003;4:209–221. doi: 10.1016/s1535-6108(03)00215-0. [DOI] [PubMed] [Google Scholar]
- 5.Chen Z., Trotman L.C., Shaffer D., Lin H.K., Dotan Z.A., Niki M., Koutcher J.A., Scher H.I., Ludwig T., Gerald W., Cordon-Cardo C., Pandolfi P.P. Crucial role of p53-dependent cellular senescence in suppression of Pten-deficient tumorigenesis. Nature. 2005;436:725–730. doi: 10.1038/nature03918. [DOI] [PMC free article] [PubMed] [Google Scholar]
- 6.Wang S., Garcia A.J., Wu M., Lawson D.A., Witte O.N., Wu H. Pten deletion leads to the expansion of a prostatic stem/progenitor cell subpopulation and tumor initiation. Proc Natl Acad Sci USA. 2006;103:1480–1485. doi: 10.1073/pnas.0510652103. [DOI] [PMC free article] [PubMed] [Google Scholar]
- 7.Akins E.J., Moore M.L., Tang S., Willingham M.C., Tooze J.A., Dubey P. In situ vaccination combined with androgen ablation and regulatory T-cell depletion reduces castration-resistant tumor burden in prostate-specific Pten knockout mice. Cancer Res. 2010;70:3473–3482. doi: 10.1158/0008-5472.CAN-09-2490. [DOI] [PMC free article] [PubMed] [Google Scholar]
- 8.Moussavi M., Fazli L., Tearle H., Guo Y., Cox M., Bell J., Ong C., Jia W., Rennie P.S. Oncolysis of prostate cancers induced by vesicular stomatitis virus in PTEN knockout mice. Cancer Res. 2010;70:1367–1376. doi: 10.1158/0008-5472.CAN-09-2377. [DOI] [PubMed] [Google Scholar]
- 9.Gross S., Piwnica-Worms D. Spying on cancer: molecular imaging in vivo with genetically encoded reporters. Cancer Cell. 2005;7:5–15. doi: 10.1016/j.ccr.2004.12.011. [DOI] [PubMed] [Google Scholar]
- 10.Liao C.P., Zhong C., Saribekyan G., Bading J., Park R., Conti P.S., Moats R., Berns A., Shi W., Zhou Z., Nikitin A.Y., Roy-Burman P. Mouse models of prostate adenocarcinoma with the capacity to monitor spontaneous carcinogenesis by bioluminescence or fluorescence. Cancer Res. 2007;67:7525–7533. doi: 10.1158/0008-5472.CAN-07-0668. [DOI] [PubMed] [Google Scholar]
- 11.Safran M., Kim W.Y., Kung A.L., Horner J.W., DePinho R.A., Kaelin W.G., Jr Mouse reporter strain for noninvasive bioluminescent imaging of cells that have undergone Cre-mediated recombination. Mol Imaging. 2003;2:297–302. doi: 10.1162/15353500200303154. [DOI] [PubMed] [Google Scholar]
- 12.Wu X., Wu J., Huang J., Powell W.C., Zhang J., Matusik R.J., Sangiorgi F.O., Maxson R.E., Sucov H.M., Roy-Burman P. Generation of a prostate epithelial cell-specific Cre transgenic mouse model for tissue-specific gene ablation. Mech Dev. 2001;101:61–69. doi: 10.1016/s0925-4773(00)00551-7. [DOI] [PubMed] [Google Scholar]
- 13.Lesche R., Groszer M., Gao J., Wang Y., Messing A., Sun H., Liu X., Wu H. Cre/loxP-mediated inactivation of the murine Pten tumor suppressor gene. Genesis. 2002;32:148–149. doi: 10.1002/gene.10036. [DOI] [PubMed] [Google Scholar]
- 14.Esser A.K., Cohen M.B., Henry M.D. Dystroglycan is not required for maintenance of the luminal epithelial basement membrane or cell polarity in the mouse prostate. Prostate. 2010;70:777–787. doi: 10.1002/pros.21110. [DOI] [PMC free article] [PubMed] [Google Scholar]
- 15.Drake J.M., Gabriel C.L., Henry M.D. Assessing tumor growth and distribution in a model of prostate cancer metastasis using bioluminescence imaging. Clin Exp Metastasis. 2005;22:674–684. doi: 10.1007/s10585-006-9011-4. [DOI] [PubMed] [Google Scholar]
- 16.Svensson R.U., Shey M.R., Ballas Z.K., Dorkin J.R., Goldberg M., Akinc A., Langer R., Anderson D.G., Bumcrot D., Henry M.D. Assessing siRNA pharmacodynamics in a luciferase-expressing mouse. Mol Ther. 2008;16:1995–2001. doi: 10.1038/mt.2008.187. [DOI] [PMC free article] [PubMed] [Google Scholar]
- 17.Svensson R.U., Barnes J.M., Rokhlin O.W., Cohen M.B., Henry M.D. Chemotherapeutic agents up-regulate the cytomegalovirus promoter: implications for bioluminescence imaging of tumor response to therapy. Cancer Res. 2007;67:10445–10454. doi: 10.1158/0008-5472.CAN-07-1955. [DOI] [PubMed] [Google Scholar]
- 18.Shappell S.B., Thomas G.V., Roberts R.L., Herbert R., Ittmann M.M., Rubin M.A., Humphrey P.A., Sundberg J.P., Rozengurt N., Barrios R., Ward J.M., Cardiff R.D. Prostate pathology of genetically engineered mice: definitions and classification: The consensus report from the Bar Harbor meeting of the Mouse Models of Human Cancer Consortium Prostate Pathology Committee. Cancer Res. 2004;64:2270–2305. doi: 10.1158/0008-5472.can-03-0946. [DOI] [PubMed] [Google Scholar]
- 19.Hsieh C.L., Xie Z., Yu J., Martin W.D., Datta M.W., Wu G.J., Chung L.W. Non-invasive bioluminescent detection of prostate cancer growth and metastasis in a bigenic transgenic mouse model. Prostate. 2007;67:685–691. doi: 10.1002/pros.20510. [DOI] [PubMed] [Google Scholar]
- 20.Seethammagari M.R., Xie X., Greenberg N.M., Spencer D.M. EZC-prostate models offer high sensitivity and specificity for noninvasive imaging of prostate cancer progression and androgen receptor action. Cancer Res. 2006;66:6199–6209. doi: 10.1158/0008-5472.CAN-05-3954. [DOI] [PubMed] [Google Scholar]
- 21.Lyons S.K., Lim E., Clermont A.O., Dusich J., Zhu L., Campbell K.D., Coffee R.J., Grass D.S., Hunter J., Purchio T., Jenkins D. Noninvasive bioluminescence imaging of normal and spontaneously transformed prostate tissue in mice. Cancer Res. 2006;66:4701–4707. doi: 10.1158/0008-5472.CAN-05-3598. [DOI] [PubMed] [Google Scholar]
- 22.Troy T., Jekic-McMullen D., Sambucetti L., Rice B. Quantitative comparison of the sensitivity of detection of fluorescent and bioluminescent reporters in animal models. Mol Imaging. 2004;3:9–23. doi: 10.1162/15353500200403196. [DOI] [PubMed] [Google Scholar]
- 23.Zhang W., Zhu J., Efferson C.L., Ware C., Tammam J., Angagaw M., Laskey J., Bettano K.A., Kasibhatla S., Reilly J.F., Sur C., Majumder P.K. Inhibition of tumor growth progression by antiandrogens and mTOR inhibitor in a Pten-deficient mouse model of prostate cancer. Cancer Res. 2009;69:7466–7472. doi: 10.1158/0008-5472.CAN-08-4385. [DOI] [PubMed] [Google Scholar]
- 24.Lin H.K., Chen Z., Wang G., Nardella C., Lee S.W., Chan C.H., Yang W.L., Wang J., Egia A., Nakayama K.I., Cordon-Cardo C., Teruya-Feldstein J., Pandolfi P.P. Skp2 targeting suppresses tumorigenesis by Arf-p53-independent cellular senescence. Nature. 2010;464:374–379. doi: 10.1038/nature08815. [DOI] [PMC free article] [PubMed] [Google Scholar]
- 25.Trotman L.C., Niki M., Dotan Z.A., Koutcher J.A., Di Cristofano A., Xiao A., Khoo A.S., Roy-Burman P., Greenberg N.M., Van Dyke T., Cordon-Cardo C., Pandolfi P.P. Pten dose dictates cancer progression in the prostate. PLoS Biol. 2003;1:E59. doi: 10.1371/journal.pbio.0000059. [DOI] [PMC free article] [PubMed] [Google Scholar]
- 26.Nardella C., Carracedo A., Alimonti A., Hobbs R.M., Clohessy J.G., Chen Z., Egia A., Fornari A., Fiorentino M., Loda M., Kozma S.C., Thomas G., Cordon-Cardo C., Pandolfi P.P. Differential requirement of mTOR in postmitotic tissues and tumorigenesis. Sci Signal. 2009;2(55):ra2. doi: 10.1126/scisignal.2000189. [DOI] [PMC free article] [PubMed] [Google Scholar]
- 27.Gabrilovich D.I., Nagaraj S. Myeloid-derived suppressor cells as regulators of the immune system. Nat Rev Immunol. 2009;9:162–174. doi: 10.1038/nri2506. [DOI] [PMC free article] [PubMed] [Google Scholar]
- 28.Ostrand-Rosenberg S., Sinha P. Myeloid-derived suppressor cells: linking inflammation and cancer. J Immunol. 2009;182:4499–4506. doi: 10.4049/jimmunol.0802740. [DOI] [PMC free article] [PubMed] [Google Scholar]
- 29.Kusmartsev S., Nefedova Y., Yoder D., Gabrilovich D.I. Antigen-specific inhibition of CD8+ T cell response by immature myeloid cells in cancer is mediated by reactive oxygen species. J Immunol. 2004;172:989–999. doi: 10.4049/jimmunol.172.2.989. [Erratum appeared in J Immunol 2004, 172:4647] [DOI] [PubMed] [Google Scholar]
- 30.Ma X., Ziel-van der Made A.C., Autar B., van der Korput H.A., Vermeij M., van Duijn P., Cleutjens K.B., de Krijger R., Krimpenfort P., Berns A., van der Kwast T.H., Trapman J. Targeted biallelic inactivation of Pten in the mouse prostate leads to prostate cancer accompanied by increased epithelial cell proliferation but not by reduced apoptosis. Cancer Res. 2005;65:5730–5739. doi: 10.1158/0008-5472.CAN-04-4519. [DOI] [PubMed] [Google Scholar]
- 31.Burton J.B., Johnson M., Sato M., Koh S.B., Mulholland D.J., Stout D., Chatziioannou A.F., Phelps M.E., Wu H., Wu L. Adenovirus-mediated gene expression imaging to directly detect sentinel lymph node metastasis of prostate cancer. Nat Med. 2008;14:882–888. doi: 10.1038/nm.1727. [DOI] [PMC free article] [PubMed] [Google Scholar]
- 32.Backman S.A., Ghazarian D., So K., Sanchez O., Wagner K.U., Hennighausen L., Suzuki A., Tsao M.S., Chapman W.B., Stambolic V., Mak T.W. Early onset of neoplasia in the prostate and skin of mice with tissue-specific deletion of Pten. Proc Natl Acad Sci USA. 2004;101:1725–1730. doi: 10.1073/pnas.0308217100. [DOI] [PMC free article] [PubMed] [Google Scholar]
- 33.Freeman D., Lesche R., Kertesz N., Wang S., Li G., Gao J., Groszer M., Martinez-Diaz H., Rozengurt N., Thomas G., Liu X., Wu H. Genetic background controls tumor development in PTEN-deficient mice. Cancer Res. 2006;66:6492–6496. doi: 10.1158/0008-5472.CAN-05-4143. [DOI] [PubMed] [Google Scholar]
- 34.Bianchi-Frias D., Pritchard C., Mecham B.H., Coleman I.M., Nelson P.S. Genetic background influences murine prostate gene expression: implications for cancer phenotypes. Genome Biol. 2007;8:R117. doi: 10.1186/gb-2007-8-6-r117. [DOI] [PMC free article] [PubMed] [Google Scholar]
- 35.Blando J., Portis M., Benavides F., Alexander A., Mills G., Dave B., Conti C.J., Kim J., Walker C.L. PTEN deficiency is fully penetrant for prostate adenocarcinoma in C57BL/6 mice via mTOR-dependent growth. Am J Pathol. 2009;174:1869–1879. doi: 10.2353/ajpath.2009.080055. [DOI] [PMC free article] [PubMed] [Google Scholar]
- 36.Gingrich J.R., Barrios R.J., Foster B.A., Greenberg N.M. Pathologic progression of autochthonous prostate cancer in the TRAMP model. Prostate Cancer Prostatic Dis. 1999;2:70–75. doi: 10.1038/sj.pcan.4500296. [DOI] [PubMed] [Google Scholar]
- 37.Xu Q., Majumder P.K., Ross K., Shim Y., Golub T.R., Loda M., Sellers W.R. Identification of prostate cancer modifier pathways using parental strain expression mapping. Proc Natl Acad Sci USA. 2007;104:17771–17776. doi: 10.1073/pnas.0708476104. [DOI] [PMC free article] [PubMed] [Google Scholar]
- 38.Kim M.J., Bhatia-Gaur R., Banach-Petrosky W.A., Desai N., Wang Y., Hayward S.W., Cunha G.R., Cardiff R.D., Shen M.M., Abate-Shen C. Nkx3.1 mutant mice recapitulate early stages of prostate carcinogenesis. Cancer Res. 2002;62:2999–3004. [PubMed] [Google Scholar]
- 39.Majumder P.K., Grisanzio C., O'Connell F., Barry M., Brito J.M., Xu Q., Guney I., Berger R., Herman P., Bikoff R., Fedele G., Baek W.K., Wang S., Ellwood-Yen K., Wu H., Sawyers C.L., Signoretti S., Hahn W.C., Loda M., Sellers W.R. A prostatic intraepithelial neoplasia-dependent p27 Kip1 checkpoint induces senescence and inhibits cell proliferation and cancer progression. Cancer Cell. 2008;14:146–155. doi: 10.1016/j.ccr.2008.06.00. [DOI] [PMC free article] [PubMed] [Google Scholar]
- 40.Luchman H.A., Benediktsson H., Villemaire M.L., Peterson A.C., Jirik F.R. The pace of prostatic intraepithelial neoplasia development is determined by the timing of Pten tumor suppressor gene excision. PLoS One. 2008;3:e3940. doi: 10.1371/journal.pone.0003940. [DOI] [PMC free article] [PubMed] [Google Scholar]
- 41.Ratnacaram C.K., Teletin M., Jiang M., Meng X., Chambon P., Metzger D. Temporally controlled ablation of PTEN in adult mouse prostate epithelium generates a model of invasive prostatic adenocarcinoma. Proc Natl Acad Sci USA. 2008;105:2521–2526. doi: 10.1073/pnas.0712021105. [DOI] [PMC free article] [PubMed] [Google Scholar]
- 42.Gao H., Ouyang X., Banach-Petrosky W.A., Shen M.M., Abate-Shen C. Emergence of androgen independence at early stages of prostate cancer progression in Nkx3.1; pten mice. Cancer Res. 2006;66:7929–7933. doi: 10.1158/0008-5472.CAN-06-1637. [DOI] [PubMed] [Google Scholar]
- 43.Youn J.I., Nagaraj S., Collazo M., Gabrilovich D.I. Subsets of myeloid-derived suppressor cells in tumor-bearing mice. J Immunol. 2008;181:5791–5802. doi: 10.4049/jimmunol.181.8.5791. [DOI] [PMC free article] [PubMed] [Google Scholar]
- 44.Zhao F., Obermann S., von Wasielewski R., Haile L., Manns M.P., Korangy F., Greten T.F. Increase in frequency of myeloid-derived suppressor cells in mice with spontaneous pancreatic carcinoma. Immunology. 2009;128:141–149. doi: 10.1111/j.1365-2567.2009.03105.x. [DOI] [PMC free article] [PubMed] [Google Scholar]
- 45.Haverkamp J.M., Crist S.A., Elzey B.D., Cimen C., Ratliff T.L. In vivo suppressive function of myeloid-derived suppressor cells is limited to the inflammatory site. Eur J Immunol. 2011;41:749–759. doi: 10.1002/eji.201041069. [DOI] [PMC free article] [PubMed] [Google Scholar]
- 46.Tu S., Bhagat G., Cui G., Takaishi S., Kurt-Jones E.A., Rickman B., Betz K.S., Penz-Oesterreicher M., Bjorkdahl O., Fox J.G., Wang T.C. Overexpression of interleukin-1beta induces gastric inflammation and cancer and mobilizes myeloid-derived suppressor cells in mice. Cancer Cell. 2008;14:408–419. doi: 10.1016/j.ccr.2008.10.011. [Erratum appeared in Cancer Cell 2011;19:154 and in Cancer Cell 2008;14(6):494] [DOI] [PMC free article] [PubMed] [Google Scholar]
Associated Data
This section collects any data citations, data availability statements, or supplementary materials included in this article.
Supplementary Materials
Characterization of C57/Luc/Ptenp mice. A: BLI of PbCre+, R26-LSL-Lucfl/fl mice demonstrates that bioluminescence signal emanates from the lower abdominal region, which was confirmed as prostate tissue when prostate and seminal vesicles were imaged ex vivo (right image). B: Detection of the recombined luciferase allele in prostate, seminal vesicles, and testis by PCR. C: Luciferase activity assay in protein homogenates demonstrates that the most intense bioluminescence signal is specific to the prostate.
Activation of the pAKT pathway in C57/Luc/Ptenp−/− mice. Immunofluorescence for pAKT in lateral lobes of 12-week-old Ptenp−/− and Ptenp+/+ mice demonstrates that expression of pAKTS473 and pAKTT308 is restricted to epithelial cells in Ptenp−/− animals. Original magnification, ×20.
Assessing Pb-Cre4 expression in the prostate stroma. A: Laser-capture microdissection qPCR for recombined luciferase in genomic DNA from prostate epithelial cells versus prostate stromal cells demonstrates that, despite low levels of recombination in stroma, a 50-fold increase in recombination occurs in the epithelium. Stroma is set at 1.0. B: Agarose gel electrophoresis of qPCR products demonstrates barely detectable levels of luciferase recombination in prostate stroma. Schematic depicts primer sets used to detect recombined luciferase (Rec-Luc, primer set 1) and luciferase (Luc, primer set 2). C: Laser capture microdissection qRT-PCR for luciferase mRNA in prostate epithelial cells demonstrates that levels of luciferase mRNA expression are similar in Ptenp+/+ versus Ptenp−/− animals. The wild-type Pten+/+ is set at 1.0.
Tumor kinetics of individual C57/Luc/Ptenp−/− mice (n = 14). BLI of 14 individual Ptenp−/− C57/Luc animals demonstrates that tumor kinetics are similar between all animals studied. The bioluminescence signal is expressed as log photon flux (photons/second) from the region of interest surrounding the prostate.
Complete histopathology of prostates from dorsal, lateral, ventral, and anterior prostate in C57/Luc/Ptenp mice at 6, 12, 25, and 52 weeks. Original magnification, ×20.
Histopathology of lymph nodes from C57/Luc/Ptenp mice. A:Ex vivo BLI reveals no bioluminescent signal in draining lymph nodes harvested from two Ptenp−/− mice at 52 weeks. B: Histopathology of draining lymph nodes from A. Original magnification, ×20.
Recruitment of CD45+CD11b+Gr-1+ cells into prostates of C57/Luc/Ptenp−/− mice. A: Dot plots showing CD45+ cells in dorsal/lateral, ventral, and anterior prostate in Ptenp−/− and Ptenp+/+ mice demonstrates increased leukocyte infiltration into Ptenp−/− prostates. B: Percent of total CD45+ cells in prostates of Ptenp−/− and Ptenp+/+ mice aged 2, 4, 6, and 8 months. C: Dot plots showing CD45+CD11b+Gr-1+ cells in dorsal/lateral, ventral, and anterior prostate of Ptenp−/− and Ptenp+/+ C57/Luc mice demonstrates increased infiltration of MDSCs in prostates of Ptenp−/− mice. D: Percent of CD45+ cells that are MDSCs in prostates of Ptenp−/− mice. Up to 70% of CD45+ cells were found to be MDSCs in dorsal prostates of Ptenp−/− mice.