

Abstract
We hypothesized that immune gene-related signatures would predict the presence of unique histological features of lymphoid cell infiltrates in colorectal carcinoma (CRC) that correlate with clinical parameters. Metagene analysis with gene chip technology was performed on 326 CRCs, which were then sorted by low versus high gene scores. Microscopically, CRCs with a high gene score revealed a marked host immune response organized, remarkably, as lymphoid follicles. Proliferation involved both B and T cells. In every case, the presence of CD79a+ B-cell precursors was identified, suggesting that the lymphoid follicles represent newly formed, ectopic lymph node-like structures. CD21+ dendritic cells were present within the follicular germinal centers, and CD3+ T cells were localized mainly in the parafollicular cortex zone surrounding the B-cell area of the follicles. A strong correlation between a 12-chemokine gene subset of the molecular profile and the presence of ectopic lymph node-like structures was associated with better patient survival independent of tumor staging, site location, microsatellite instability or stability, and patient treatment. These findings suggest beneficial, intratumoral immune cell priming and raise the possibility of immunotherapy intervention decisions based on molecular signatures that can identify the presence of tumor-localized, ectopic lymph node-like structures.
Colorectal adenocarcinoma (CRC) is one of the most common malignancies, accounting for approximately 15% of all cancer-related deaths in the United States. The prevalence of CRC increases with age, the largest number of tumors occurring during the sixth decade. The expected annual incidence of this tumor has risen over the last decade, and 149,000 new cases were estimated in 2009.1 If not diagnosed and treated early, this tumor spreads through the entire bowel wall, extends to adjacent organs, and eventually metastasizes to regional lymph nodes and distant sites. The majority of deaths from CRC occur in patients with metastatic late-stage tumors, most of which are incurable.
Tumor-induced host immune response has been described in breast,2–5 lung,6,7 ovarian,8,9 and colorectal10,11 cancer, among other solid tumor types. This response may include fibrosis, lymphocytic or neutrophilic infiltration, and other reactive changes within the tumor and/or in the surrounding tissue. CRC is known to elicit an inflammatory immune reaction composed of acute and/or chronic inflammatory cells, including lymphocytes, infiltrating the tumor and the surrounding colonic wall. The lymphocytic component of this response has been shown to include some antigen-specific T cells originating without prior immunotherapy.12,13 We therefore hypothesized that immune gene-related signatures would predict the presence of unique histological features of lymphoid cell infiltrates in colorectal carcinoma (CRCs) that correlate with clinical parameters.
In the present study, we focused on interrogating the Moffitt Cancer Center CRC gene profiling database of 347 samples (normal and tumor) exhibiting the highest or lowest expression of genes biologically related to the host immune response, with the specific aim of determining whether or not unique distinctions exist in the pattern and composition of lymphoid infiltrates that correlate with defined clinical parameters. Archived histological sections representative of these selected cases were subsequently examined histologically to confirm the presence or absence of immune cell infiltrates, as well as their patterns of organization; immunohistochemistry (IHC) was used to determine cellular phenotype. Microscopically, the CRCs with the highest gene scores revealed a marked lymphocytic host response organized, remarkably, as active lymphoid follicles or ectopic lymph node-like structures. We further evaluated this observation for linkages to tumor staging, tumor site location, microsatellite instability/stability status, patient treatment, and patient survival. Collectively, the findings suggest beneficial immune cell priming outside of the peripheral lymphoid tissues, predicted by certain immune gene signatures, which could be potentially beneficial for immunotherapy-based intervention decisions.
Materials and Methods
mRNA Microarray Analysis
In all, 12 normal colorectal mucosa samples, 9 normal liver samples, and 326 colorectal adenocarcinoma tumor specimens (19 annotated as metastasis, 265 as primary, and 42 as unknown) from patients treated at the Moffitt Cancer Center under a University of South Florida Institutional Review Board-approved protocol were arrayed on Affymetrix HG-U133+ GeneChip microarrays (denoted MCC CRC500) (Affymetrix, Santa Clara, CA). The chip contained 20,155 unique genes. For the present study, this existing MCC CRC500 database was interrogated and the data were processed using a robust multichip average (RMA) normalization algorithm as implemented with default settings in the Affymetrix Power Tools software package, which comprises a set of cross-platform command-line programs that implement algorithms for analyzing and working with Affymetrix GeneChip arrays. Obtained probe set intensities were then converted to log10 transformed values. When selecting probes for heat maps, we started with all gene symbols from a given family and then reduced the set to probes that showed the desired correlation pattern.
Selection of Human Tissues
We interrogated the MCC CRC500 gene profiling database for the presence of genes biologically related to inflammation and immune response. We selected the 10 CRCs with the highest expression of these genes and compared them with the 11 CRCs with the lowest expression of the same genes (two of the CRCs, denoted T2157A1 and T2157A3, are separate samples obtained from the same patient). The histological slides corresponding to these cases (prepared from the mirror-image of the portion of tumor submitted for the mRNA microarray analysis) were retrieved from the Moffitt Cancer Center Anatomical Pathology Division's repository. All of the specimens were preserved in 10% buffered formalin before paraffin embedding. The slides were reviewed to assess the presence of microscopically evident host immune response. The final pathology report for each case was also reviewed, and the pathological data were collected.
The tumors were staged according to both Dukes and tumor–node–metastasis (TNM) systems. All tumors occurred in the absence of genetic cancer syndromes such as human nonpolyposis colon cancer syndrome (HNPCC), familial adenomatous polyposis syndrome (FAP), among others. Cancers arising in the background of ulcerative colitis or Crohn's disease were excluded. Linked, annotated clinical follow-up data (including survival) and treatments received were also available in the database.
Microsatellite Instability or Stability Analysis
Prediction of microsatellite instability or stability (MSI/MSS) status was performed by linear discriminant modeling using four independently derived signatures predictive of MSI/MSS status,14–17 trained on samples with known MSI/MSS status (100 MSS and 7 MSI samples).17 Scores for these four MSI signatures were found to be highly concordant and correctly predicted status of 7 of the 7 MSI samples and 94 of the 100 MSS samples.17
IHC and Analysis
The tissues were stained using the avidin-biotin complex method with retrieval under high pH. Prediluted monoclonal antibodies (mAb) to CD3 (rabbit mAb, Ventana Medical Systems, Tucson, AZ), CD20 (mouse mAb, Ventana), CD79a (mouse mAb, Ventana), Ki-67 (rabbit mAb, Ventana), and CD21 (mouse mAb, Novocastra Laboratories Ltd., Newcastle on Tyne, UK) were used for the analysis of lymphoid infiltrates. The slides were deparaffinized by heating at 56°C for 30 minutes and by three washes, 5 minutes each, with xylene. Tissues were rehydrated by a series of 5-minute washes twice in 100% alcohol (95% ethanol and 5% methanol), twice in 95% alcohol, and in distilled water. After blocking with universal blocking serum (Ventana) for 30 minutes, the samples were incubated with each primary mAb at 37°C for 32 minutes. The samples were then incubated with biotin-labeled secondary mAb and streptavidin-horseradish peroxidase for 30 minutes each. The slides were developed with 3,3′-diaminobenzidine tetrahydrochloride substrate (Ventana) and counterstained with hematoxylin and bluing (Ventana). The tissue samples were dehydrated and coverslipped. Appropriate cell conditioning (according to Ventana recommendations) was used for antigen retrieval for all antibodies. A negative control was included of nonimmune mouse sera and omitting the primary antibody during the primary antibody incubation step. The positive controls were selected according to Ventana recommendations for CD3, CD20, CD79a, and Ki-67 and Novocastra recommendations for CD21.
Blinded mAb-stained tissue slides were examined simultaneously by two independent pathologists (F.K. and D.C.). In case of disagreement, consensus was reached by re-evaluation of the slides. The positivity of the stains was calculated semiquantitatively by estimating the percentage of nuclear positivity in the lymphoid cells.
Statistical Analysis
For each gene, a single probe set with the highest SD across all samples was selected among multiple probe sets available on the array that mapped to the same gene symbol. Significance of linkages of gene profiles to patient survival was analyzed statistically by both analysis of variance and Wilcoxon rank-sum tests. For data presented in illustrations, significance was analyzed by Fisher's exact test (P values).
Results
Immune Gene Profiling
We identified several tightly correlated sets of genes (metagenes) biologically related to inflammation and immune response. Metagene analysis was performed on samples from the MCC CRC500 tumor bank and CRCs were sorted by low versus high gene scores. In all, 326 gene-chipped CRCs were evaluated from this tumor bank, using gene chip technology. The chip contained 20,155 unique genes. Approximately 50 separate metagene groupings were derived. Among these, one metagene grouping (metagene 1) was identified with overwhelming enrichment for immune-related and inflammation-related genes; it was also the largest metagene in terms of number of genes (320 unique immune gene symbols). Of the 326 CRCs, 21 tumors from 20 patients were selected as reflecting the 10 highest and 11 lowest values of the mean score of metagene 1 (Figure 1A).
Figure 1.

A: The observed range of the immune response as represented by the metagene 1 score. Shown are the CRCs that have the 10 highest and 11 lowest values of the mean score of selected immune metagenes, sorted by the mean metagene score. B: The relationship between patient overall survival (OS) and the immune response as quantified by the metagene 1 score on selected CRCs with known status of ectopic lymph node-like structures confirmed by IHC. CRCs with and without lymphoid structures (high and low metagene 1 scores, respectively) segregated into two groups: overall survival time of <2 years versus >2 years. Score for metagene 1 is plotted on the y axis.
Pathological and Clinical Findings
The patients with 21 CRCs selected by the 10 highest and 11 lowest values of the mean score of metagene 1 had a median age of 69 years (range, 51 to 83 years); 13 were male and 7 were female. Most of the primary CRCs were moderately differentiated (n = 16); of these, eight were metagene 1 high scoring and eight were metagene 1 low scoring. Three tumors were well differentiated; of these one was metagene 1 high and two were metagene 1 low. The one poorly differentiated CRC was metagene 1 high. Thus, there was no definable correlation between CRCs selected by metagene 1 score and their grade of differentiation.
We also examined the relationship between overall survival of the patients and the immune response as quantified by the score of metagene 1 for the 21 selected CRCs. These metagene 1 selected CRCs segregated as overall survival time of <2 years versus overall survival time of >2 years. There was a significant trend of increased overall survival (>2 years) of patients with CRCs with the highest values of the mean score of metagene 1.
Histopathological and IHC Findings
Microscopically, all 11 of the lowest metagene 1-scored CRCs revealed a minimally dispersed or absent lymphocytic peritumoral host response, and low to no appreciable expression for lymphocytic markers (Figure 2, A and B). Conversely, all 10 of the highest metagene 1-scoring CRCs samples revealed a marked peritumoral lymphocytic host response that was organized, remarkably, as ectopic lymph node-like structures evident by H&E staining (Figure 2C) and by IHC (Figure 2, D–I), particularly at the invasive edge of the tumors. Of note, there was no statistically significant difference (P > 0.05) between the presence of ectopic lymph node-like structures and sex, tumor grade, tumor site location, high microsatellite instability (MSI-H)/microsatellite stability (MSS) status, and tumor stage (Table 1).
Figure 2.
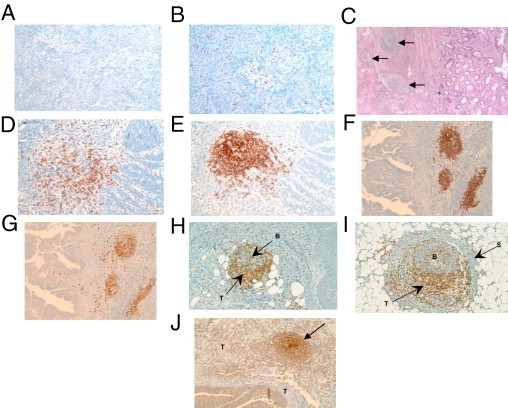
Analysis of primary CRCs with H&E staining and IHC. All 11 of the lowest gene signature-scored CRCs revealed a lightly dispersed or absent lymphocytic peritumoral host response, and low to no appreciable expression of the B cell marker CD20 (A) and the T cell marker CD3 (B). All 10 of the highest gene signature-scored CRCs revealed a marked peritumoral lymphocytic host response, organized as ectopic lymph node-like structures (arrows), by H&E staining (C) and by IHC. (D–I). CD20+ B cells (E and F), CD79a+ B cells (G), and CD21+ follicular dendritic cells (J) are concentrated in the center of follicles, with CD3+ T cells (D, H, and I) appearing in the parafollicular cortex or marginal zones and with some dispersion into the follicles. In some cases, a fibrous stroma was observed to encapsulate a follicle (I). J: The arrow indicates a follicle at the front edge of the invading colonic adenocarcinoma. B, B cells; S, stroma; T, T cells (H and I) or tumor (J). Magnification: A, ×100; B, ×100; C, ×40; D, ×200; E, ×200; F, ×100; G, ×100; H, ×100; I, ×200; J, ×100.
Table 1.
Molecular Signatures That Identify the Presence of Ectopic Lymph Node Structures Are Independent of Tumor Site Location, MSI-H/MSS Status, Stage, and Patient Treatment
| Signatures⁎ | Tumor† | Ectopic lymph nodes | Tumor site | MSI-H/status | Dukes/TNM stage | Treatment |
|---|---|---|---|---|---|---|
| + | T2151 | + | rectum | MSS | D/IVA | 5FU |
| + | T4555 | + | left | MSS | B/IIA | none |
| + | T252 | + | right | MSS | C/IIIC | 5FU + radiation |
| + | T2638 | + | rectum | MSS | C/IIIB | 5FU/irinotecan |
| + | T4948 | + | sigmoid | MSS | C/IIIB | 5FU + radiation |
| + | T1923 | + | left | MSI-H | B/IIA | 5FU |
| + | T462 | + | rectum | MSS | B/IIA | none |
| + | T568 | + | left | MSS | NA | 5FU/mitomycin/irinotecan + radiation |
| + | T3701 | + | right | MSI-H | C/IIIB | 5FU |
| + | T3395 | + | sigmoid | MSI-H | B/IIB | none |
| − | T5108 | − | right | MSS | NA | 5FU |
| − | T2648 | − | rectum | MSS | −/0 | none |
| − | T5029 | − | sigmoid | MSI-H | C/IIIB | NA |
| − | T3138 | − | left | MSI-H | NA | 5FU/irinotecan |
| − | T6190 | − | sigmoid | MSS | D/IVA | 5FU/irinotecan/cetuximab/irinotecan |
| − | T2588 | − | left | MSS | B/IIC | 5FU/irinotecan/5-FUDR + mitomycin/irinotecan + radiation |
| − | T2157A1/A3 | − | right | MSS/MSS | D/IVA | none |
| − | T4376 | − | left | MSS | B/IIC | 5FU/irinotecan |
| − | T5162 | − | left | MSS | B/IIC | 5FU + radiation |
| − | T2412 | − | left | MSS | C/IIIB | 5FU/irinotecan/cetuximab |
MSI-H, CRCs with high levels of microsatellite instability; MSS, CRCs with microsatellite stability; NA, not available.
Metagene 1 and 12-chemokine signature.
CRCs that have the 10 highest and 10 lowest metagene 1 and 12-chemokine signature scores.
Ectopic lymph node-like structures were observed intratumorally as well, occasionally accompanied by a lightly diffuse pattern of lymphocytes within the tumor parenchyma. The lymphoid structures were found to contain follicles. The majority of the CD3+ T cells were located in parafollicular cortex-like zones (Figure 2, D, H, and I); scattered CD3+ T cells were occasionally seen within these tumors as well. CD20+ B cells were present almost exclusively within the follicular structures (Figure 2, E and F). In every case, CD79a+ B-cell precursors were identified within the lymphoid follicles (Figure 2G). CD21+ dendritic cells were present within the follicular germinal centers, establishing the true follicular nature of the lymphoid aggregates (Figure 2J). Ki-67 expression was found only in the highest metagene 1-scoring CRC samples, suggesting that these germinal centers are in a different stage of maturation. Lymphocytic proliferation was found to contain both B and T lymphocytes, which suggests newly formed and/or activated ectopic lymph node-like structures. Together, these findings support the hypothesis that these follicles represent secondary and/or tertiary ectopic lymph node-like structures.
Identification of a Chemokine Gene Signature
Heat mapping revealed a strong correlation of association between the chemokine gene profile and the presence of ectopic lymph node-like structures in CRCs (Figure 3A). Hierarchical clustering of tumors with and without lymphoid structures was performed on a selected set of known chemokine genes (Figure 3B). There was a strong correspondence between score mean cutoffs for metagene 1 and the chemokine gene set. For each gene, a single representative probe set with the highest dynamic range across all profiled samples was picked up from all probe sets that mapped to a given gene symbol. Genes were clustered using Pearson's correlation distance metric and tumors were sorted by gene scores (Figure 3B). Figure 4A shows a heat map of 326 colorectal tumors and 12 genes comprising metagene 1, sorted by the metagene score (mean of probe sets that map to a given 12-gene set of genes). Table 2 shows the hierarchical clustering of 326 CRC tumors and the selected 12 chemokines (ie, CCL2, CCL3, CCL4, CCL5, CCL8, CCL18, CCL19, CCL21, CXCL9, CXCL10, CXCL11, and CXCL13) that were most correlated with the metagene 1 score. For each chemokine, the gene symbol, the numerical order on the corresponding probe set when processed with the Affymetrix Power Tools software package, and probe-set identification are shown. Collectively, these data demonstrate that the chemokines (because of their potent, biological attraction of immune cell subtypes) track strongly with the formation or presence of ectopic lymph node-like structures in CRC tumor masses.
Figure 3.
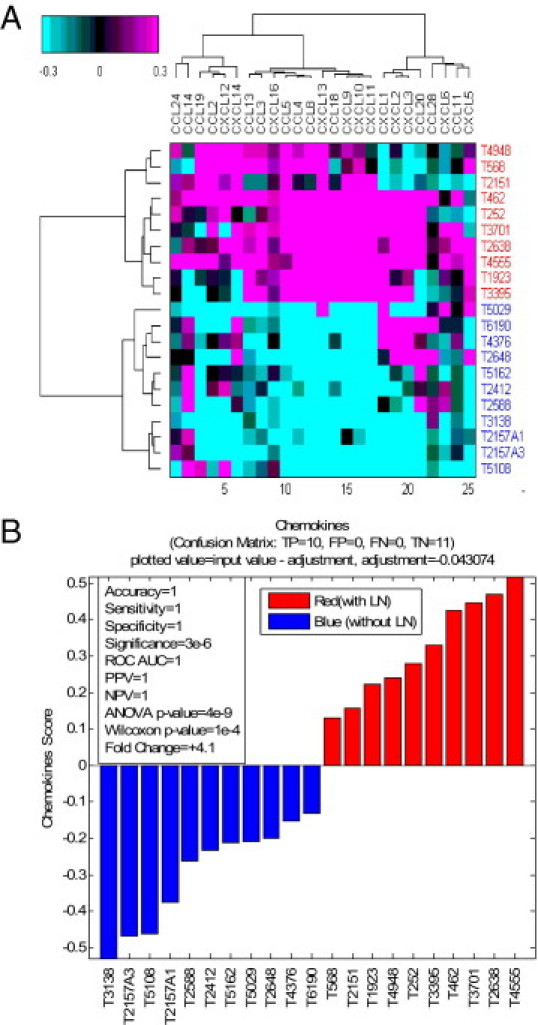
Chemokines are up-regulated in tumors with ectopic lymph node structures. A: Heat map of mean-centered intensities, averaged within each probe set across all tumors shown. For each gene, a single representative probe set with the highest dynamic range across all profiled samples was picked up from all probe sets that mapped to a given gene symbol. Genes are clustered using Pearson's correlation distance metric; tumors are clustered using Euclidean distance metric. Ward's linkage criterion was applied for both tumors and genes. Along the y axis, red versus blue identifiers indicate CRCs with versus without lymphoid structures. B: Hierarchical clustering of tumors with and without lymphoid structures was done on a selected set of known chemokines. The chemokine score is the mean value of chemokines as averaged across all probe sets shown for the heat map.
Figure 4.

The 12 selected chemokines that correlate with metagene 1. A: Heat map of 326 colorectal tumors and 12 genes comprising metagene 1 sorted by the metagene score (mean of probe sets that map to a given 12-gene set of genes). The profile below the heat map demarcates the 10 samples with the highest metagene score and the 11 samples with the lowest metagene score. B: The relationship between patient overall survival and the immune response as quantified by the score of chemokine genes on selected CRCs with known status of ectopic lymph node-like structures confirmed by IHC. CRCs with and without lymphoid structures (high and low metagene 1 scores, respectively) segregated into two groups: overall survival time of <2 years versus >2 years. Scores for the chemokine genes are plotted on the y axis.
Table 2.
Chemokine Gene Expression in Human Colon Tumors: A 12-Gene Signature Predicts Presence of Ectopic Lymph Nodes
| MCC CRC500: Chemokine correlation to metagene 1 | ||||
|---|---|---|---|---|
| Probe | Probe set | Symbol | ρ (%) | P value |
| 65 | 1405_i_at | CCL5 | 83 | 0E + 00 |
| 17867 | 204655_at | CCL5 | 83 | 0E + 00 |
| 52045 | 1555759_a_at | CCL5 | 81 | 0E + 00 |
| 17288 | 205242_at | CXCL13 | 72 | 0E + 00 |
| 18402 | 204103_at | CCL4 | 72 | 0E + 00 |
| 18665 | 203915_at | CXCL9 | 72 | 0E + 00 |
| 18007 | 204533_at | CXCL10 | 66 | 7E − 42 |
| 12512 | 210072_at | CCL19 | 61 | 4E − 34 |
| 235 | 32128_at | CCL18 | 58 | 2E − 30 |
| 8658 | 214038_at | CCL8 | 58 | 1E − 30 |
| 12636 | 209924_at | CCL18 | 58 | 8E − 31 |
| 6122 | 216598_s_at | CCL2 | 57 | 4E − 30 |
| 17425 | 205114_s_at | CCL3 | 56 | 2E − 28 |
| 11482 | 211122_s_at | CXCL11 | 55 | 1E − 27 |
| 12419 | 210163_at | CXCL11 | 55 | 1E − 27 |
| 17905 | 204606_at | CCL21 | 53 | 5E − 25 |
Hierarchical clustering of 326 CRCs and the 12 chemokines selected (CCL2, CCL3, CCL4, CCL5, CCL8, CCL18, CCL19, CCL21, CXCL9, CXCL10, CXCL11, CXCL13) that most correlated with metagene 1 score. For analysis, tumors were sorted by the metagene score, and chemokines were clustered using Pearson's correlation distance metric and Ward's linkage criterion. For each chemokine, the gene symbol, numerical order on the corresponding probe set when processed with the Affymetrix Power Tools software package, and the probe set identifier are shown.
Molecular Signatures and Clinical Parameters
Both metagene 1 and the 12-chemokine gene signature that identifies the presence of ectopic lymph node-like structures in CRCs are independent of tumor staging (both TNM and Dukes), tumor site location, MSI-H/MSS status, and treatment received (ie, surgery alone, surgery plus chemotherapy with or without external beam radiation) (Table 1).
We also examined the relationship between overall survival of the patients and metagene 1 and the 12-chemokine gene signature for the 21 selected CRCs. These groups of signature-selected CRCs were plotted as those with overall survival time of <2 years and >2 years (Figure 4B). There was a significant trend of increased overall survival (>2 years) of patients with CRCs with the highest values of the mean score of the 12-chemokine gene signature.
Identification of T Cell Activation-Related Gene Signatures
Heat maps revealed strong correlations of association between gene profiles for cytotoxic cells (ie, lysosomal/proteolytic enzymes, granzymes, and FcγR2s) and dendritic cells (S100 family and CD209) and the presence of ectopic lymph node-like structures in CRCs (see Supplemental Figures S1A and S2A at http://ajp.amjpathol.org). Hierarchical clustering of tumors with and without ectopic lymph node-like structures were then performed on a selected set of known cytotoxic and dendritic cell-related genes (see Supplemental Figures S1B and S2B at http://ajp.amjpathol.org). There was a strong correspondence between score mean cutoffs for metagene 1 and cytotoxic and dendritic cell-related gene sets. For each gene, a single representative probe set with the highest dynamic range across all profiled samples was picked up from all probe sets that mapped to a given gene symbol. Genes were clustered using Pearson correlation distance metric; tumors were sorted by the gene score (see Supplemental Figures S1B and S2B at http://ajp.amjpathol.org) and were computed as the mean value for each tumor across all genes shown. Collectively, the cytotoxic and dendritic cell-related genes reflect an important immune cell composition of ectopic lymph node-like structures in CRC.
There was a significant trend of increased overall survival (>2 years) of patients with CRCs with the highest values of the mean score of the cytotoxic and dendritic cell-related gene signatures (see Supplemental Figure S3 at http://ajp.amjpathol.org).
Discussion
It has been shown that growing, human solid tumors are infiltrated by immune cells. Data characterizing the nature of this host immune response in a wide variety of distinct tumor types have been reported recently,2–9 including primary CRCs.18 Many of these studies described the subset composition of the lymphocytic infiltrates that were either distributed diffusely within tumor parenchyma or localized diffusely at the peripheral rim of the mass. In contrast, we have now identified, through the use of immune-related gene signatures, a subset of primary CRCs that contain distinct, ectopic lymph node-like structures, with some showing frank germinal center formation and germinal cell maturation. These structures were particularly localized at the invasive front edge of the tumor. For this analysis, we selected 21 CRCs as extreme cases (ie, 10 with the highest gene scores and 11 with the lowest gene scores). In this regard, it is acknowledged that the present study should be viewed within the realm of biomarker discovery, because we used relatively small numbers of well chosen cases. For final validation, a follow-up study will be necessary on a much larger cohort of unselected patients. We are evaluating additional samples of CRCs with intermediate scores and, to date, have found these CRCs to show a sparse and/or diffuse, uniformly distributed pattern of lymphoid infiltrate, similar to that described by others,18 and lacking definable ectopic lymph node-like structures.
There is a known association of a Crohn's-like lymphocytic infiltrate with typically forming right-sided, familial or sporadic CRCs with microsatellite instability (MSI-H) and better prognosis (ie, survival) compared with microsatellite-stable mucinous carcinoma.19–21 In contrast, there was no definable correlation in the present study between tumor site location (ie, right side versus other locations) in the colon or MSI-H/MSS status (Table 1) and the CRCs selected by the immune-related gene signatures showing the presence of ectopic lymph node-like structures and correlating with better patient survival (Table 1).
The cellular composition of the ectopic lymphoid follicles, shown by IHC, is similar to that of fully mature, encapsulated lymph nodal structures. Germinal center formation is particularly evident in infants and children, but less so in young adults and often absent in older individuals.22 The most impressive germinal center formation is seen in lymph nodes normally exposed to antigenic stimulation, the mesenteric lymph nodes being a good example of this process. It is possible, therefore, that functional tertiary lymphoid structures within certain CRCs may be a site of recognizing tumor-associated antigens and building up an antitumor immune response, which could beneficially affect clinical outcome.
Similar lymphoid structures have been reported in solid tumors. For example, Coronella-Wood et al2,3 described breast tumor-infiltrating lymphocytes composed of B-cell aggregates containing interdigitating CD21+ follicular dendritic cells. The presence of ectopic, organized lymphoid tissue has also been reported in tumors of ovary,8,9,23 colon,24,25 and lung.6,7 Such studies have mostly focused on the presence of dendritic cell subpopulations, the level of which predicted better prognosis in some tumor types.7,8,26 A similar correlation was recently reported for patients with CRC.10 The formation of ectopic tertiary lymphoid follicles and lymphoid cell aggregates had been earlier noted in nonmalignant conditions as well,10,11 particularly in the settings of autoimmune disease (eg, rheumatoid arthritis) and chronic inflammation.27,28 The development of these ectopic lymphoid structures in a background of chronic inflammation has been investigated in detail in studies taking advantage of transgenic models of secondary and tertiary lymphoid organogenesis. The use of such models has established that these lymphoid areas are composed of B and T lymphocytes, as well as specialized stromal cells and high endothelial venules.
In one of the possible mechanisms for the generation of the ectopic lymph node-like structures in adults, it can occur independently of Id2-dependent lymphoid tissue-inducer (LTi) cells, and depends on a program initiated by mature CD3+CD4+ T cells, which interact with local dendritic cells.29,30 Another mechanism suggests the direct involvement of chemokines and LTi cells. In this regard, CXCL13 and CCL21 have been shown to attract LTi cells, and CXCL13 is exclusively essential for lymph node development by early clustering of LTi cells.31 Moreover, we have shown in murine tumor models that dendritic cells genetically modified to secrete CCL21 can produce lymphoid cell aggregates in vivo and, importantly, can prime naïve T cells extranodally within tumor masses, resulting in the generation of tumor-specific T cells and subsequent tumor regression.32 Of note, CXCL13 and CCL21 are indeed components of our identified 12 chemokine gene classifier (ie, CCL2, CCL3, CCL4, CCL5, CCL8, CCL18, CCL19, CCL21, CXCL9, CXCL10, CXCL11, and CXCL13) that segregates CRCs with ectopic lymph node-like structures.
The 12 chemokines comprising our identified gene signature track with the formation of the ectopic lymph nodes within the CRCs; we believe that this tracking is due to their known potent, biological attraction of immune cell subtypes33 For example, as already noted, CXCL13 and CCL21 (and CCL19) have coordinated involvement in LTi cell homing and lymph node development. CXCL13 has also been reported within B-cell follicles, and it is known to be highly selective for B cell attraction. CCL19 and CCL21 are known to be critical in normal lymphocyte homing of T cells (and dendritic cells) in secondary lymph nodes. As a group, CXCL9, CXCL10, and CXCL11 are all related T-cell attractants and, as a group, CCL2, CCL3, CCL4, CCL5, CCL8, and CCL18 are powerful chemoattractants (with some individual degrees of differences) for monocytes/dendritic cells, T cells, B cells, and NK cells (including those at either naïve or activated states). Notably absent from our identified 12-chemokine gene signature are CCL1, CCL20, and CCL22, which have been shown to selectively recruit and/or maintain T regulatory cells.9,34–37 Recently, Harlin et al38 described a subset of six chemokines (namely, CCL2, CCL3, CCL4, CCL5, CXCL9, and CXCL10) preferentially expressed in melanoma metastases that contained a diffuse pattern of T cells. Notably, these 6 chemokines are included in the 12-chemokine gene signature identified in the present study. It is also of interest that chemokines may be present in inflamed tissues that do not yet have defined lymphoid infiltrates,39 suggesting that these molecules are induced by either the inflammatory response or by tumor cells themselves, before the formation of the ectopic lymph node-like structures.
In situ and molecular analyses of tumor-infiltrating cytotoxic and memory CD3+ T cells may be a valuable prognostic and/or subcategorization tool in CRCs40 and in melanoma.41 In addition, dendritic cells are critical for the maintenance of tertiary lymphoid structures,42 and S100+ dendritic cells are an important component of non-neoplastic and neoplastic lymphoid follicles.43 Of particular interest to the present study, dendritic cells isolated by others from inducible bronchus-associated lymphoid tissue have been found to be a source of CXCL12, CCL19, and CCL21 (which, notably, again appear in our 12-chemokine gene signature). We also found that gene profiles of cytotoxic cells (ie, lysosomal/proteolytic enzymes, granzymes, and FcγR2s) and dendritic cells [ie, S100 family (24 different types) and CD209] correlated with the presence of ectopic lymph node-like structures (see Supplemental Figures S1–S3 at http://ajp.amjpathol.org). Of importance, these cytotoxic and dendritic cell markers accurately reflected components of immune cells comprising these structures, as demonstrated by IHC. As with the chemokine gene classifier, there was a significant trend of increased overall survival (>2 years) of patients with CRCs with the highest values of the mean score of the cytotoxic and dendritic cell-related gene signatures (see Supplemental Figure S3 at http://ajp.amjpathol.org). These two signatures, similar to the chemokine gene classifier, were also found to be independent of tumor staging (ie, Dukes) and treatment received (ie, surgery alone, surgery plus chemotherapy with or without external beam radiation).
In sum, we have identified a 12-chemokine gene signature that strongly predicts the presence of ectopic lymph node-like structures in primary CRCs. This molecular classifier and the presence of these lymphoid structures correlate with better patient prognosis, irrespective of other defined variables. Based on their known selective capacity to potently recruit and concentrate immune cell subsets in vivo and also their known association with peripheral lymph node formation and function,44,45,46 we hypothesize that the chemokines locally produced within the microenvironment of the CRC mass are directly responsible for the formation of the ectopic lymph node-like structures. We also hypothesize that these lymphoid structures are active and are playing an important, positive role in eliciting an endogenous anti-tumor immune response (initially local but becoming systemic) that results in better overall survival of patients. This hypothesis is strengthened by a further association with the T-cell activation-related gene signatures likewise identified in the present study, which we believe correctly reflect the cellular immune composition of the ectopic lymph node-like structures. Based on the knowledge that tumor infiltrating lymphocytes can have profound anti-tumor activity in patients,46 we are in the process of determining the functional nature of the ectopic lymph node-like structures in the laboratory. Last, we believe that our findings raise the intriguing possibility of preselecting CRC patients (and conceivably those with other solid tumor types) for immunotherapy interventions based on molecular signatures that can identify the presence of tumor-localized, ectopic lymph node-like structures. We believe this form of patient trial matching is now feasible. Whether it will lead to improvement in therapeutic responses awaits testing.47
Acknowledgments
We thank staff of the Histology Section of the Tissue Core at the Moffitt Cancer Center for support in performing the IHC staining and Dr. Mike Gruidl for interrogating clinical staging and treatment data.
Footnotes
This work was supported in part by the NCI-NIH (1 R01 CA148995-01 to J.J.M.), the Jimmy V Foundation, and the Dr. Miriam and Sheldon G. Adelson Medical Research Foundation.
D.C. and M.N. contributed equally to the present work.
Supplemental material for this article can be found at http://ajp.amjpathol.org or at doi: 10.1016/j.ajpath.2011.03.007.
Supplementary data
Cytotoxic cell marker genes are up-regulated in tumors with ectopic lymph node-like structures. Hierarchical clustering of tumors with and without lymphoid structures was performed on a selected set of known cytotoxic genes. For each gene, a single representative probe set with the highest dynamic range across all profiled samples was picked up from all probe sets that mapped to a given gene symbol. Genes are clustered using Pearson's correlation distance metric; tumors are clustered using Euclidean distance metric. Ward's linkage criterion was applied for both tumors and genes. A: Heat map shows mean-centered intensities (averaged within each probe set across all tumors shown). B: Mean value of cytotoxic genes as averaged across all probe sets shown in A.
Dendritic cell marker genes are up-regulated in tumors with ectopic lymph node-like structures. A: Hierarchical clustering of tumors with and without lymphoid structures was done on a selected set of known dendritic cell marker genes. For each gene, a single representative probe set with the highest dynamic range across all profiled samples was picked up from all probe sets that mapped to a given gene symbol. Genes are clustered using Pearson's correlation distance metric; tumors are clustered using Euclidean distance metric. Ward's linkage criterion was applied for both tumors and genes. Heat map shows mean-centered intensities (averaged within each probe set across all tumors shown). B: Mean value of dendritic cell marker genes as averaged across all probe sets shown in A.
Relationship between patient overall survival and the immune response as quantified by the score of genes related to cytotoxic cells (A) and dendritic cells (B) on selected CRCs with known status of ectopic lymph node-like structures confirmed by immunohistochemistry. CRCs with and without lymphoid structures (high and low metagene 1 scores, respectively) segregated into two groups:overall survival time of <2 years versus >2 years. Scores for cytotoxic cell-related and dendritic cell-related genes are plotted on the y axis.
References
- 1.Jemal A., Siegel R., Ward E., Hao Y., Xu J., Murray T., Thun M.J. Cancer Statistics. CA Cancer J Clin. 2008;58:71–96. doi: 10.3322/CA.2007.0010. [DOI] [PubMed] [Google Scholar]
- 2.Coronella J.A., Spier C., Welch M., Trevor K.T., Stopeck A.T., Villar H., Hersh E.M. Antigen-driven oligoclonal expansion of tumor-infiltrating B cells in infiltrating ductal carcinoma of the breast. J Immunol. 2002;169:1829–1836. doi: 10.4049/jimmunol.169.4.1829. [DOI] [PubMed] [Google Scholar]
- 3.Coronella-Wood J.A., Hersh E.M. Naturally occurring B-cell responses to breast cancer. Cancer Immunol Immunother. 2003;52:715–738. doi: 10.1007/s00262-003-0409-4. [DOI] [PMC free article] [PubMed] [Google Scholar]
- 4.Bell D., Chomarat P., Broyles D., Netto G., Harb G.M., Lebecque S., Valladeau J., Davoust J., Palucka K.A., Banchereau J. In breast carcinoma tissue, immature dendritic cells reside within the tumor, whereas mature dendritic cells are located in peritumoral areas. J Exp Med. 1999;190:1417–1426. doi: 10.1084/jem.190.10.1417. [DOI] [PMC free article] [PubMed] [Google Scholar]
- 5.Aspord C., Pedroza-Gonzalez A., Gallegos M., Tindle S., Burton E.C., Su D., Marches F., Banchereau J., Palucka A.K. Breast cancer instructs dendritic cells to prime interleukin 13-secreting CD4+ T cells that facilitate tumor development. J Exp Med. 2007;204:1037–1047. doi: 10.1084/jem.20061120. [DOI] [PMC free article] [PubMed] [Google Scholar]
- 6.Kurabayashi A., Furihata M., Matsumoto M., Hayashi H., Ohtsuki Y. Distribution of tumor-infiltrating dendritic cells in human non-small cell lung carcinoma in relation to apoptosis. Pathol Int. 2004;54:302–310. doi: 10.1111/j.1440-1827.2004.01624.x. [DOI] [PubMed] [Google Scholar]
- 7.Dieu-Nosjean M.C., Antoine M., Danel C., Heudes D., Wislez M., Poulot V., Rabbe N., Laurans L., Tartour E., de Chaisemartin L., Lebecque S., Fridman W.H., Cadranel J. Long-term survival for patients with non–small-cell lung cancer with intratumoral lymphoid structures. J Clin Oncol. 2008;26:4410–4417. doi: 10.1200/JCO.2007.15.0284. [DOI] [PubMed] [Google Scholar]
- 8.Eisenthal A., Polyvkin N., Bramante-Schreiber L., Misonznik F., Hassner A., Lifschitz-Mercer B. Expression of dendritic cells in ovarian tumors correlates with clinical outcome in patients with ovarian cancer. Hum Pathol. 2001;32:803–807. doi: 10.1053/hupa.2001.26455. [DOI] [PubMed] [Google Scholar]
- 9.Curiel T.J., Coukos G., Zou L., Alvarez X., Cheng P., Mottram P., Evdemon-Hogan M., Conejo-Garcia J.R., Zhang L., Burow M., Zhu Y., Wei S., Kryczek I., Daniel B., Gordon A., Myers L., Lackner A., Disis M.L., Knutson K.L., Chen L., Zou W. Specific recruitment of regulatory T cells in ovarian carcinoma fosters immune privilege and predicts reduced survival. Nat Med. 2004;10:942–949. doi: 10.1038/nm1093. [DOI] [PubMed] [Google Scholar]
- 10.Singh P., Coskun Z.Z., Goode C., Dean A., Thompson-Snipes L., Darlington G. Lymphoid neogenesis and immune infiltration in aged liver. Hepatology. 2008;47:1680–1690. doi: 10.1002/hep.22224. [DOI] [PMC free article] [PubMed] [Google Scholar]
- 11.Carragher D.M., Rangel-Moreno J., Randall T.D. Ectopic lymphoid tissues and local immunity. Semin Immunol. 2008;20:26–42. doi: 10.1016/j.smim.2007.12.004. [DOI] [PMC free article] [PubMed] [Google Scholar]
- 12.Chiba T., Ohtani H., Mizoi T., Naito Y., Sato E., Nagura H., Ohuchi A., Ohuchi K., Shiiba K., Kurokawa Y., Satomi S. Intraepithelial CD8+ T-cell-count becomes a prognostic factor after a longer follow up period in human colorectal carcinoma: possible association with suppression of micrometastasis. Br J Cancer. 2004;91:1711–1717. doi: 10.1038/sj.bjc.6602201. [DOI] [PMC free article] [PubMed] [Google Scholar]
- 13.Nagorsen D., Keilholz U., Rivoltini L., Schmittel A., Letsch A., Asemissen A.M., Berger G., Buhr H.J., Thiel E., Scheibenbogen C. Natural T-cell response against MHC class I epitopes of epithelial cell adhesion molecule, her-2/neu, and carcinoembryonic antigen in patients with colorectal cancer. Cancer Res. 2000;60:4850–4854. [PubMed] [Google Scholar]
- 14.Watanabe T., Kobunai T., Toda E., Yamamoto Y., Kanazawa T., Kazama Y., Tanaka J., Tanaka T., Konishi T., Okayama Y., Sugimoto Y., Oka T., Sasaki S., Muto T., Nagawa H. Distal colorectal cancers with microsatellite instability (MSI) display distinct gene expression profiles that are different from proximal MSI cancers. Cancer Res. 2006;66:9804–9808. doi: 10.1158/0008-5472.CAN-06-1163. [DOI] [PubMed] [Google Scholar]
- 15.Giacomini C.P., Leung S.Y., Chen X., Yuen S.T., Kim Y.H., Bair E., Pollack J.R. A gene expression signature of genetic instability in colon cancer. Cancer Res. 2005;65:9200–9205. doi: 10.1158/0008-5472.CAN-04-4163. [DOI] [PubMed] [Google Scholar]
- 16.Kruhøffer M., Jensen J.L., Laiho P., Dyrskjøt L., Salovaara R., Arango D., Birkenkamp-Demtroder K., Sørensen F.B., Christensen L.L., Buhl L., Mecklin J.P., Järvinen H., Thykjaer T., Wikman F.P., Bech-Knudsen F., Juhola M., Nupponen N.N., Laurberg S., Andersen C.L., Aaltonen L.A., Ørntoft T.F. Gene expression signatures for colorectal cancer microsatellite status and HNPCC. Br J Cancer. 2005;92:2240–2248. doi: 10.1038/sj.bjc.6602621. [DOI] [PMC free article] [PubMed] [Google Scholar]
- 17.Loboda A., Nebozhyn M.V., Watters J.W., Buser C.A., Shaw P.M., Huang P.S., Van't Veer L., Tollenaar R.A., Jackson D.B., Agrawal D., Dai H., Yeatman T.J. EMT is the dominant program in human colon cancer. BMC Med Genomics. 2011;4:9. doi: 10.1186/1755-8794-4-9. [DOI] [PMC free article] [PubMed] [Google Scholar]
- 18.Ropponen K.M., Eskelinen M.J., Lipponen P.K., Alhava E., Veli-Matti K. Prognostic value of tumour-infiltrating lymphocytes (TILs) in colorectal cancer. J Pathol. 1997;182:318–324. doi: 10.1002/(SICI)1096-9896(199707)182:3<318::AID-PATH862>3.0.CO;2-6. [DOI] [PubMed] [Google Scholar]
- 19.Chaves P., Cruz C., Lage P., Claro I., Cravo M., Leitao C.N., Soares J. Immunohistochemical detection of mismatch repair gene proteins as a useful tool for the identification of colorectal carcinoma with the mutator phenotype. J Pathol. 2000;191:355–360. doi: 10.1002/1096-9896(2000)9999:9999<::AID-PATH644>3.0.CO;2-T. [Erratum appeared in J Pathol 2001;193:279] [DOI] [PubMed] [Google Scholar]
- 20.Kakar S., Aksoy S., Burgart L.J., Smyrk T.C. Muscinous carcinoma of the colon: correlation of loss of mismatch repair enzymes with clinicopathologic features and survival. Mod Pathol. 2004;17:696–700. doi: 10.1038/modpathol.3800093. [DOI] [PubMed] [Google Scholar]
- 21.Tougeron D., Fauquembergue E., Rouquette A., Le Pessot F., Sesboüé R., Laurent M., Berthet P., Mauillon J., Di Fiore F., Sabourin J.C., Michel P., Tosi M., Frébourg T., Latouche J.B. Tumor-infiltrating lymphocytes in colorectal cancers with microsatellite instability are correlated with the number and spectrum of frameshift mutations. Mod Pathol. 2009;22:1186–1195. doi: 10.1038/modpathol.2009.80. [DOI] [PubMed] [Google Scholar]
- 22.Luscieti P., Hubschmid T., Cottier H., Hess M.W., Sobin L.H. Human lymph node morphology as a function of age and site. J Clin Pathol. 1980;33:454–461. doi: 10.1136/jcp.33.5.454. [DOI] [PMC free article] [PubMed] [Google Scholar]
- 23.Zeid N.A., Muller H.K. S100 positive dendritic cells in human lung tumors associated with cell differentiation and enhanced survival. Pathology. 1993;25:338–343. doi: 10.3109/00313029309090853. [DOI] [PubMed] [Google Scholar]
- 24.Nagorsen D., Voigt S., Berg E., Stein H., Thiel E., Loddenkemper C. Tumor-infiltrating macrophages and dendritic cells in human colorectal cancer: relation to local regulatory T cells, systemic T-cell response against tumor-associated antigens and survival. J Transl Med. 2007;5:62. doi: 10.1186/1479-5876-5-62. [DOI] [PMC free article] [PubMed] [Google Scholar]
- 25.Michael-Robinson J.M., Biemer-Hüttmann A., Purdie D.M., Walsh M.D., Simms L.A., Biden K.G., Young J.P., Leggett B.A., Jass J.R., Radford-Smith G.L. Tumour infiltrating lymphocytes and apoptosis are independent features in colorectal cancer stratified according to microsatellite instability status. Gut. 2001;48:360–366. doi: 10.1136/gut.48.3.360. [DOI] [PMC free article] [PubMed] [Google Scholar]
- 26.Coppola D., Mulé J.J. Ectopic lymph nodes within human solid tumors. J Clin Oncol. 2008;26:4369–4370. doi: 10.1200/JCO.2008.17.6149. [DOI] [PubMed] [Google Scholar]
- 27.Timmer T.C., Baltus B., Vondenhoff M., Huizinga T.W., Tak P.P., Verweij C.L., Mebius R.E., van der Pouw Kraan T.C. Inflammation and ectopic lymphoid structures in rheumatoid arthritis synovial tissues dissected by genomics technology: identification of the interleukin-7 signaling pathway in tissues with lymphoid neogenesis. Arthritis Rheum. 2007;56:2492–2502. doi: 10.1002/art.22748. [DOI] [PubMed] [Google Scholar]
- 28.Olszewski W.L. De novo lymph node formation in chronic inflammation of the human leg. Ann N Y Acad Sci. 2002;979:166–177. doi: 10.1111/j.1749-6632.2002.tb04877.x. [DOI] [PubMed] [Google Scholar]
- 29.Marinkovic T., Garin A., Yokota Y., Fu Y.X., Ruddle N.H., Furtado G.C., Lira S.A. Interaction of mature CD3+CD4+ T cells with dendritic cells triggers the development of tertiary lymphoid structures in the thyroid. J Clin Invest. 2006;116:2622–2632. doi: 10.1172/JCI28993. [DOI] [PMC free article] [PubMed] [Google Scholar]
- 30.Kim M.Y., Gaspal F.M., Wiggett H.E., McConnell F.M., Gulbranson-Judge A., Raykundalia C., Walker L.S., Goodall M.D., Lane P.J. CD4+CD3− accessory cells costimulate primed CD4 T cells through OX40 and CD30 at sites where T cells collaborate with B cells. Immunity. 2003;18:643–654. doi: 10.1016/s1074-7613(03)00110-9. [DOI] [PubMed] [Google Scholar]
- 31.van de Pavert S.A., Olivier B.J., Goverse G., Vondenhoff M.F., Greuter M., Beke P., Kusser K., Höpken U.E., Lipp M., Niederreither K., Blomhoff R., Sitnik K., Agace W.W., Randall T.D., de Jonge W.J., Mebius R.E. Chemokine CXCL13 is essential for lymph node initiation and is induced by retinoic acid and neuronal stimulation. Nat Immunol. 2009;10:1193–1199. doi: 10.1038/ni.1789. [DOI] [PMC free article] [PubMed] [Google Scholar]
- 32.Kirk C.J., Hartigan-O'Connor D., Mulé J.J. The dynamics of the T-cell antitumor response: chemokine-secreting dendritic cells can prime tumor-reactive T cells extranodally. Cancer Res. 2001;61:8794–8802. [PubMed] [Google Scholar]
- 33.Dubinett S.M., Lee J.M., Sharma S., Mulé J.J. Chemokines: can effector cells be re-directed to the site of tumor. Cancer J. 2010;167:325–335. doi: 10.1097/PPO.0b013e3181eb33bc. [DOI] [PMC free article] [PubMed] [Google Scholar]
- 34.Hoelzinger D.B., Smith S.E., Mirza N., Dominguez A.L., Manrique S.Z., Lustgarten J. Blockade of CCL1 inhibits T regulatory cell suppressive function enhancing tumor immunity without affecting T effector responses. J Immunol. 2010;184:6833–6842. doi: 10.4049/jimmunol.0904084. [DOI] [PubMed] [Google Scholar]
- 35.Mira E., León B., Barber D.F., Jiménez-Baranda S., Goya I., Almonacid L., Márquez G., Zaballos A., Martínez-A C., Stein J.V., Ardavín C., Mañes S. Statins induce regulatory T cell recruitment via a CCL1 dependent pathway. J Immunol. 2008;181:3524–3534. doi: 10.4049/jimmunol.181.5.3524. [DOI] [PubMed] [Google Scholar]
- 36.Yamazaki T., Yang X.O., Chung Y., Fukunaga A., Nurieva R., Pappu B., Martin-Orozco N., Kang H.S., Ma L., Panopoulos A.D., Craig S., Watowich S.S., Jetten A.M., Tian Q., Dong C. CCR6 regulates the migration of inflammatory and regulatory T cells. J Immunol. 2008;181:8391–8401. doi: 10.4049/jimmunol.181.12.8391. [DOI] [PMC free article] [PubMed] [Google Scholar]
- 37.Toulza F., Nosaka K., Tanaka Y., Schioppa T., Balkwill F., Taylor G.P., Bangham C.R. Human T-lymphotropic virus type 1-induced CC chemokine ligand 22 maintains a high frequency of functional FoxP3+ regulatory T cells. J Immunol. 2010;185:183–189. doi: 10.4049/jimmunol.0903846. [DOI] [PMC free article] [PubMed] [Google Scholar]
- 38.Harlin H., Meng Y., Peterson A.C., Zha Y., Tretiakova M., Slingluff C., McKee M., Gajewski T.F. Chemokine expression in melanoma metastases associated with CD8+ T-cell recruitment. Cancer Res. 2009;69:3077–3085. doi: 10.1158/0008-5472.CAN-08-2281. [DOI] [PMC free article] [PubMed] [Google Scholar]
- 39.Manzo A., Paoletti S., Carulli M., Blades M.C., Barone F., Yanni G., Fitzgerald O., Bresnihan B., Caporali R., Montecucco C., Uguccioni M., Pitzalis C. Systematic microanatomical analysis of CXCL13 and CCL21 in situ production and progressive lymphoid organization in rheumatoid synovitis. Eur J Immunol. 2005;35:1347–1359. doi: 10.1002/eji.200425830. [DOI] [PubMed] [Google Scholar]
- 40.Galon J., Costes A., Sanchez-Cabo F., Kirilovsky A., Mlecnik B., Lagorce-Pagès C., Tosolini M., Camus M., Berger A., Wind P., Zinzindohoué F., Bruneval P., Cugnenc P.H., Trajanoski Z., Fridman W.H., Pagès F. Type, density, and location of immune cells within human colorectal tumors predict clinical outcome. Science. 2006;313:1960–1964. doi: 10.1126/science.1129139. [DOI] [PubMed] [Google Scholar]
- 41.Bogunovic D., O'Neill D.W., Belitskaya-Levy I., Vacic V., Yu Y.L., Adams S., Darvishian F., Berman R., Shapiro R., Pavlick A.C., Lonardi S., Zavadil J., Osman I., Bhardwaj N. Immune profile and mitotic index of metastatic melanoma lesions enhance clinical staging in predicting patient survival. Proc Natl Acad Sci USA. 2009;106:20429–20434. doi: 10.1073/pnas.0905139106. [DOI] [PMC free article] [PubMed] [Google Scholar]
- 42.Geurts van Kessel C.H., Willart M.A., Bergen I.M., van Rijt L.S., Muskens F., Elewaut D., Osterhaus A.D., Hendriks R., Rimmelzwaan G.F., Lambrecht B.N. Dendritic cells are crucial for maintenance of tertiary lymphoid structures in the lung of influenza virus-infected mice. J Exp Med. 2009;206:2339–2349. doi: 10.1084/jem.20090410. [DOI] [PMC free article] [PubMed] [Google Scholar]
- 43.Tsunoda T., Yamakawa M., Takahashi T. Differential expression of Ca(2+)-binding proteins on follicular dendritic cells in non-neoplastic and neoplastic lymphoid follicles. Am J Pathol. 1999;155:805–814. doi: 10.1016/S0002-9440(10)65179-6. [DOI] [PMC free article] [PubMed] [Google Scholar]
- 44.Balkwill F. Cancer and the chemokine network. Nat Rev Cancer. 2004;4:540–550. doi: 10.1038/nrc1388. [DOI] [PubMed] [Google Scholar]
- 45.Charo I.F., Ransohoff R.M. The many roles of chemokines and chemokine receptors in inflammation. N Engl J Med. 2006;354:610–621. doi: 10.1056/NEJMra052723. [DOI] [PubMed] [Google Scholar]
- 46.Rosenberg S.A., Dudley M.E. Adoptive cell therapy for the treatment of patients with metastatic melanoma. Curr Opin Immunol. 2009;21:233–240. doi: 10.1016/j.coi.2009.03.002. [DOI] [PMC free article] [PubMed] [Google Scholar]
- 47.Yeatman T., Mulé J.J., Dalton W.S., Sullivan D. On the eve of personalized medicine in oncology. Cancer Res. 2008;68:7250–7252. doi: 10.1158/0008-5472.CAN-08-1374. [DOI] [PMC free article] [PubMed] [Google Scholar]
Associated Data
This section collects any data citations, data availability statements, or supplementary materials included in this article.
Supplementary Materials
Cytotoxic cell marker genes are up-regulated in tumors with ectopic lymph node-like structures. Hierarchical clustering of tumors with and without lymphoid structures was performed on a selected set of known cytotoxic genes. For each gene, a single representative probe set with the highest dynamic range across all profiled samples was picked up from all probe sets that mapped to a given gene symbol. Genes are clustered using Pearson's correlation distance metric; tumors are clustered using Euclidean distance metric. Ward's linkage criterion was applied for both tumors and genes. A: Heat map shows mean-centered intensities (averaged within each probe set across all tumors shown). B: Mean value of cytotoxic genes as averaged across all probe sets shown in A.
Dendritic cell marker genes are up-regulated in tumors with ectopic lymph node-like structures. A: Hierarchical clustering of tumors with and without lymphoid structures was done on a selected set of known dendritic cell marker genes. For each gene, a single representative probe set with the highest dynamic range across all profiled samples was picked up from all probe sets that mapped to a given gene symbol. Genes are clustered using Pearson's correlation distance metric; tumors are clustered using Euclidean distance metric. Ward's linkage criterion was applied for both tumors and genes. Heat map shows mean-centered intensities (averaged within each probe set across all tumors shown). B: Mean value of dendritic cell marker genes as averaged across all probe sets shown in A.
Relationship between patient overall survival and the immune response as quantified by the score of genes related to cytotoxic cells (A) and dendritic cells (B) on selected CRCs with known status of ectopic lymph node-like structures confirmed by immunohistochemistry. CRCs with and without lymphoid structures (high and low metagene 1 scores, respectively) segregated into two groups:overall survival time of <2 years versus >2 years. Scores for cytotoxic cell-related and dendritic cell-related genes are plotted on the y axis.