

Abstract
Activated tumor stroma participates in tumor cell growth, invasion, and metastasis. Normal fibroblasts and cancer-associated fibroblasts (CAFs) have been shown to display distinct gene expression signatures. This molecular heterogeneity may influence the way tumor cells migrate, proliferate, and survive during tumor progression. To test this hypothesis and to better understand the molecular mechanisms that control these interactions, we established a three-dimensional (3D) human cell culture system that recapitulates the tumor heterogeneity observed in vivo. Human colon tumor cells were grown as multicellular spheroids and subsequently co-cultured with normal fibroblasts or CAFs in collagen I gels. This in vitro model system closely mirrors the architecture of human epithelial cancers and allows the characterization of the tumor cell–stroma interactions phenotypically and at the molecular level. Using GeneChip analysis, antibody arrays, and enzyme-linked immunosorbent assays, we demonstrate that the interaction of colon cancer cells with stromal fibroblasts induced different highly relevant cancer expression profiles. Genes involved in invasion, extracellular matrix remodeling, inflammation, and angiogenesis were differentially regulated in our 3D carcinoma model. The modular setup, reproducibility, and robustness of the model make it a powerful tool to identify target molecules involved in signaling pathways that mediate paracrine interactions in the tumor microenvironment and to validate the influence of these molecular targets during tumor growth and invasion in the supporting stroma.
Carcinomas comprise approximately 90% of all human cancers, including lung, colon, breast, and prostate carcinomas, which together cause approximately 50% of all cancer deaths.1 Carcinomas consistently develop as highly complex structures composed of genetically altered tumor cells, together with fibroblasts, endothelial cells, pericytes, and inflammatory cells embedded in an extracellular matrix (ECM) of proteins. The tumor stroma influences the development of malignant tumors2–4; for example, the recruitment of blood vessels is ultimately required for tumor growth.3,5 Fibroblasts comprise the major cellular component of the stroma of carcinomas. These cancer-associated fibroblasts (CAFs) have been shown to stimulate tumor progression of initiated nontumorigenic prostate epithelial cells6 and to promote the growth of breast and colon cancer in animal models.7,8 Recently, it was demonstrated that the interaction of colon cancer cells with stromal cells activates the β-catenin pathway in the cancer cells and leads to an increase in colon cancer stem cells.9 Therefore, understanding the molecular mechanisms involved in the paracrine interactions between the tumor and the surrounding stroma will help to identify new molecules that may serve as potential drug targets.
The culture of cells on two-dimensional (2D) surfaces has provided groundbreaking insights into basic cell biology and tumorigenesis.10–12 However, most physiologic parameters of organs or tumors, such as tissue architecture, cell-to-cell and cell-to-matrix interaction, mechanical properties, and biochemical networks are lost under these simplified conditions. Cells grown in three-dimensional (3D) scaffolds or as 3D aggregates (multicellular spheroids) much better recapitulate the in vivo structure of tissues13–15 and tumors.16–21 The 3D culture systems have been used to address the functional interaction between human tumor and stromal cells embedded in the ECM in different cancer models.22–26
We have combined well-established 3D cellular assays, namely, multicellular spheroids, 3D collagen gel cultures, and co-cultures, into one experimental setup, which we call the “in vitro carcinoma assay.” We have focused on colorectal cancer and shown that this model system is physiologically relevant and allows live imaging, histologic examination, biochemical assays, and functional experiments to be performed in parallel. In addition, expression profiling analysis identified genes differentially regulated on tumor stroma interaction, which are relevant for carcinogenesis. Finally, we demonstrated that the assay format is suitable for in vitro drug testing.
Materials and Methods
Cells and Conventional Cell Culture
LS 174T (CL-188), HCT 116 (CCL-147), Colo205 (CCL-222), MCF7 (HTB-22), SW480 (CCL-227), SW620 (CCL-228) CCD-18Co (CTL1459), Caco-2 (HTB-37), HT-29 (HTB-38), and H446 (HTB-171) were from ATCC. Telomerase immortalized normal human fibroblasts (BJ-1) were purchased from Clontech (Mountain View, CA). Tumor cell lines were cultured in Dulbecco's modified Eagle's medium (DMEM) supplemented with 10% fetal calf serum (Invitrogen, Gibco, Carlsbad, CA) and penicillin/streptomycin (Invitrogen, Gibco) in conventional plastic culture flasks (Iwaki, Fukushima, Japan).
Fibroblast Isolation
The CAFs were isolated from fresh samples of colon adenocarcinomas received at the Institute of Pathology at the Medical University of Vienna, Vienna, Italy, in accordance with the institutional ethical guidelines. Pieces of approximately 0.5 cm3 were minced in the MediMachine (No. 340588, Becton Dickinson, Franklin Lakes, NJ) and seeded in DMEM/10% fetal calf serum, penicillin/streptomycin, and ciprofloxacin (50 μg/mL) onto 5-cm tissue culture plates (No. 150288, Thermo Fisher Scientific, Rochester, NY). After 3 days the remnants of the tissue were carefully washed away with PBS and the attached fibroblasts were further incubated in serum free fibroblast growth medium (FGM; No. C-23010, PromoCell, Heidelberg, Germany) containing 1 ng/mL of basic fibroblast growth factor and 5 ng/mL of insulin for four population doublings, and aliquots were frozen in CryoSFM (No. C-29912, PromoCell).
In Gel Immunofluorescence
Immunofluorescence staining of whole gels was adapted from an established protocol.27 Collagen gels were washed once in cold PBS, fixed in 4% paraformaldehyde/250 mmol/L HEPES for 15 minutes at room temperature incubated in Tris-buffered saline 0.1% Tween 20 (TBS-T) for 10 minutes, followed by three washes in PBS/0.1% Tween 20 (PBS-T). After blocking for 30 minutes in PBS-T/0.2% gelatin/0.1 μg/mL of mouse IgG, the collagen gels were incubated overnight at 4°C in 250 μL of PBS-T/0.2% gelatin (blocking solution) containing the appropriate dilution of the first antibody. Then the gels were washed 3 times in PBS-T, and 250 μL of the second antibody in blocking solution was added and incubated for another 2 hours at room temperature. After washing, the procedure was repeated for staining with a second primary antibody of a different source. Thereafter, the gels were incubated for 1 hour in PBS-T and DAPI (0.2 μg/mL), washed, placed on glass slides with Vectashield mounting medium (H-1000, Vector Laboratories, Burlingame, VT), coverslipped, and analyzed on a Zeiss LSM5-Exciter confocal microscope.
Immunohistochemistry and Histochemistry
Immunohistochemical analysis was performed either on 2-μm sections from FFPE samples or on acetone/methanol fixed 5-μm sections from frozen samples embedded in O.C.T. compound (Tissue Tek, No. 4583, Sakura Finetek Europe, Zoeterwoude, the Netherlands). The Envision+R System PolymerHRP method (No. K4000, DakoCytomation, Carpinteria, CA) was used followed by diaminobenzidine and hematoxylin counterstaining. Cason's trichrome and PAS staining were performed following standard procedures.
Real-Time (Video)microscopy
Live imaging was performed on an AxioVert 200M (Zeiss, Oberkochen, Germany) microscope using AxioVision 4.5 software. For long-time in vivo imaging, we used a Pecon incubation chamber (37°C, 5% carbon dioxide) for 24-well plates equipped with a humidifier system.
RNA Isolation, Affymetrix GeneChip Hybridization, Normalization, and Statistical Evaluation
Spheroids and fibroblasts containing collagen gels were lysed in toto in guanidinium isothiocyanate RNA lysis buffer. Total RNA was extracted using the Arcturus Pico Pure RNA Isolation Kit (Arcturus Engineering, Mountain View, CA) following the manufacturer's instructions, including DNase I treatment. RNA quality was assessed with the Agilent Nano LabChip Assay (Agilent, Palo Alto, CA). The obtained RNA was linear amplified and biotinylated with the MessageAmp Premier RNA Amplification Kit (Ambion, Austin, TX) and used for hybridization to the Human Genome U133 Plus 2.0 GeneChip arrays using standard Affymetrix protocols. Microarray data were normalized with the Robust Multi-Array Analysis as implemented in Bioconductor.28,29 All analyses were performed with log2-transformed data. Hypothesis tests were performed using a modified t statistic with an empirical Bayes approach as implemented in the Bioconductor LIMMA package.30 P values were adjusted by the false discovery rate (FDR) method of Benjamini and Hochberg.31
Pathway Analysis
Gene Set Enrichment Analysis (GSEA) is a computational method that determines whether an a priori defined set of genes shows statistically significant, concordant differences between two groups of samples. We used two gene set collections from the Molecular Signature Database provided by the Broad Institute: c2, the curated gene set, and c5, the gene ontology (GO) gene set. The core genes of statistically significant genes sets were used to calculate principal component analysis (PCA) plots. Pathway analysis based on literature information extracted by experts (IPA; Ingenuity Systems, Inc., Redwood City, CA) was performed to corroborate GSEA results and to generate gene networks of significantly regulated groups of genes.
Western Blot Analysis
Collagen gel inserts were washed in PBS and incubated with 200 μL of prewarmed collagenase B (25 mg/mL, Hoffmann-La Roche, Nutley, NJ) at 37°C for 1 minute, 5 mL of ice cold PBS/5% fetal calf serum was added, the released spheroids and fibroblasts were harvested by centrifugation and washed in PBS, and the cell pellets were lysed in Laemmli buffer.
Antibodies and Reagents
Rat tail collagen I was from BD (Franklin Lakes, NJ), antibodies against phospho-H3, cleaved caspase 3, phosphorylated retinoblastoma protein (pRb), platelet-derived growth factor receptor β (PDGFRβ) were from Cell Signaling Technology (Danvers, MA), anti–E-cadherin (clone HECD1) was purchased from Abcam plc (Oxford, UK), and cytokeratin 18 and vimentin (clone V9) antibodies were from Sigma-Aldrich (St. Louis, MO). Fibroblast activation protein α antibody was clone F19.32
Transmission Electron Microscopy
Samples were fixed in 2% Karnovsky's paraformaldehyde. After washing and postfixing in 1% OsO4 (resolved in 3% potassium hexacyanoferrate), the material was dehydrated and embedded in EPON Resin 812. Ultrathin sections (approximately 70 nm) were prepared and stained with uranylacetate and lead citrate. Sections were examined under a Jeol JEM 1010 electron microscope.
Cytokine Arrays and Phospho–Tyrosine Kinase Arrays
Determination of 120 cytokine levels in cell culture supernatants was performed with the RayBio Cytokine Antibody Arrays as recommended by the supplier (RayBiotech, Norcross, GA). The phosphorylation status of 42 receptor tyrosine kinases was determined with the human Phospho-Receptor Tyrosine Kinase Array Kit according to the instructions (R&D Systems Inc, Minneapolis, MN).
Spheroid Formation
Multicellular spheroids were generated essentially as published for endothelial cell spheroids.33 In brief, tumor cells were grown on plastic, trypsinized, counted, and resuspended in DMEM/5% fetal calf serum containing 12 mg/mL of methylcellulose (Sigma-Aldrich, St. Louis, MO). The cells were seeded into nonadhesive, U-shaped, 96-well plates for suspension culture (Greiner bio-one, Kremsmuenster, Austria) at a concentration of 150 to 200 cells per well. Compact multicellular spheroids were harvested after 2 to 3 days and washed, and 96 tumor cell spheres each were transferred into 1.5 mL of microcentrifuge tubes. Fibroblasts for co-culture experiments were cultivated on plastic in serum free FGM (Promocell, Heidelberg, Germany). After trypsinization, cells were counted; 2 × 10⁵ cells were transferred into 1.5-mL tubes and centrifuged at 250 × g. In case of co-culture experiments, the cells were centrifuged onto the previously prepared spheroid pellets. The entire supernatant was carefully removed, and the cells/cell-spheroid pellets were kept on ice until further use.
Collagen Gel Culture
Gel casting devices were produced by cutting out 2 × 2-cm squares of a silicone foil (Gel dryer sealing gasket, 1-mm thickness, Biorad, Hercules, CA) into which holes of 1.4-cm diameter were cut with a puncher. Nylon filters were prepared from the nylon mesh inserts of Medicon syringe filters (100 μm, Becton Dickinson), of which a hole of 1-cm diameter was cut out in the center. The silicone casting devices and the nylon meshes were autoclaved and placed onto the inside surface of lids of 10-cm cell culture dishes, where they firmly attached. For the collagen gel preparation, all steps were performed on ice. Collagen solutions were prepared by mixing 0.2 mL of 10× PBS, 0.8 mL of FGM/20% methylcellulose, and 1 mL of collagen I (rat, 3.48 mg/mL, Becton Dickinson) and neutralized with 23 μL of 1 mol/L NaOH. The solution was mixed carefully; air bubbles were removed by centrifugation at 300 × g for 2 minutes. A total of 200 μL each of the collagen solution was transferred into the tubes containing the spheroid/cell pellets, which were gently resuspended. The spheroid/cell suspensions were transferred into the casting devices; a nylon filter was added and submerged. After polymerization of the collagen solution for 30 minutes at 37°C/5% CO2, the silicone foil was removed, leaving collagen gel cylinders. The gels were transferred into 24-well plates containing 1 mL of FGM supplemented with 2.5% serum. The culture medium was replaced every second day, and conditioned medium was kept, sterile filtered, and snap-frozen in liquid nitrogen. Celltracker Green CMFDA (Invitrogen) was used for long-term tracing of fibroblasts for live cell imaging as recommended by the supplier. The growth rate of the tumor spheroids was determined by calculating the mean volume of 8 to 10 spheroids, using the formula (length × width2 × π/6) as used to determine the size of subcutaneous xenograft tumors in mice.34,35
The TissueQuest software (TissueGnostics GmbH, Vienna, Austria) was used to quantify fluorescent photomicrographs. Cell detection is based on identification of nuclei by DAPI staining. Fluorescence intensity quantification was performed independently in different channels. All photomicrographs were taken with the same settings (exposure time, signal amplification, and objectives).
Results
Multicellular Tumor Spheroid–Fibroblast Co-Culture Experiments in a 3D Collagen Gel Matrix
Seventeen human tumor cell lines from different cancer types were tested for their ability to grow as multicellular spheroids. Eleven cell lines formed spheroids, whereas six cell lines only formed loose cell aggregates under any of the experimental conditions tested. Spheroids from different cell lines behaved differently when placed into collagen gels. Some remained as compact spheres and did not show signs of invasion; others displayed moderate invasion, and other cell types, such as SK-OV-3, showed extensive invasive structures characterized by multicellular astral outgrowth into the collagen gels (Figure 1A; see also Supplemental Table S1 and Supplemental Figure S1 at http://ajp.amjpathol.org).
Figure 1.
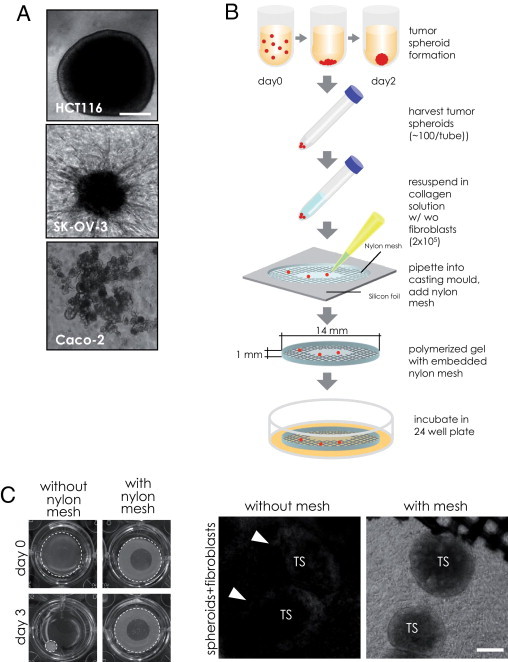
Experimental setup. A: Examples of cancer cell line spheroids embedded in collagen gels. HCT116 cells were noninvasive, whereas SK-OV-3 cells formed invasive structures within 24 hours of cultivation. Caco-2 cells did not form spheroids. B: Scheme of workflow. Spheroid formation was induced by seeding tumor cells in round bottom–shaped 96-well plates. After 2 to 3 days tumor spheroids were harvested and resuspended in collagen I solution in the presence or absence of 2 × 10⁵ normal colon fibroblasts. The suspension was transferred into a silicone casting mold, and a ring-shaped nylon mesh was submerged. After collagen gel polymerization, the mold was removed and the collagen gel was transferred into a 24-well plate and incubated with growth medium. C: Contractile force generated by fibroblasts shrunk collagen gels within 3 days. The embedded nylon mesh averted shrinking of the collagen gel. Dashed white circles highlight the outline of the gels (top). The contraction of the collagen gel hindered light microscopic morphologic examination in nonsupported gels at day 2. Embedded tumor spheroids (TS, arrowheads) could hardly be distinguished from the surrounding fibroblasts and ECM, whereas cells in nylon mesh–reinforced collagen gels could be easily evaluated. The nylon mesh is visible as dark netlike structure. Scale bar = 200 μm.
The colon cancer cell line LS174T, defined as noninvasive in our assay, was selected for further studies. LS174T spheroids were prepared, harvested, and mixed with freshly trypsinized fibroblasts. The mixture was centrifuged and the pellet resuspended in collagen I solution and poured into silicone molds (Figure 1B). This gave rise to flat collagen gel cylinders, which were mechanically stabilized by submerging nylon mesh rings before polymerization (Figure 1B, bottom). The gel cylinders harbored either 96 tumor cell spheroids surrounded by 2 × 10⁵ normal fibroblasts or CAFs. In addition, tumor cell spheroids without fibroblasts or fibroblasts alone were prepared in a similar way. The fibroblasts used were normal embryonic colon fibroblasts (NCFs; CCD18-Co), hTERT immortalized skin fibroblasts (SFs; BJ-1), and primary fibroblast cultures isolated from human colon carcinoma specimen (CAF1 and CAF2). For phenotypic characterization, the SFs and CAFs were analyzed for marker expression by immunofluorescence. The cells were positive for the mesenchymal marker vimentin, whereas the epithelial marker cytokeratin 8 was not detectable. In addition, approximately 10% of the cells were α-smooth muscle actin positive (see Supplemental Figure S2A at http://ajp.amjpathol.org). A detailed characterization of these various fibroblast types was performed by gene expression analysis. In addition, the proliferation rate of CAFs, NCFs, and SFs grown on 2D was determined and no differences were found among the various cell types (see Supplemental Figure S2B at http://ajp.amjpathol.org).
The ring-shaped nylon meshes facilitated the microscopic analysis by phase contrast of living cells (Figures 1C and 2A) and by fluorescence microscopy of labeled cells. When tumor spheroids and fibroblasts were cultured without the supporting nylon mesh, the free-floating collagen gel cylinders shrunk and appeared as dense, refractive structures within 2 to 3 days due to the contractile forces of the fibroblasts in the gels as described,36 which hindered microscopic evaluation (Figure 1C). In contrast, embedded nylon meshes resisted the contracting force of the fibroblasts and completely abolished shrinking (Figure 1C). The morphology of the co-cultures could thus be monitored easily by live microscopy.
Figure 2.
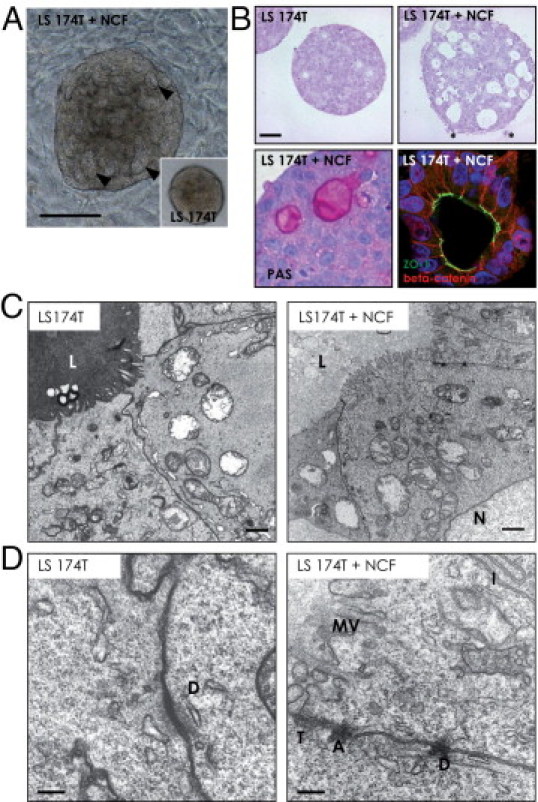
Microscopic evaluation of the tumor cell spheroids. A: Co-culture of LS174T spheroids with colon fibroblasts (LS174T+NCF) in collagen gels induced morphologic changes in the tumor cell aggregates compared with tumor spheroids cultured under the same conditions alone (inset: LS174T). At 2 days of co-cultivation, hollow structures were clearly visible within the tumor spheroid (arrowheads). Scale bar = 200 mm. B: H&E staining of collagen gel sections revealed more frequent and bigger acinous structures (white areas inside the spheroids) in LS174T spheroids co-cultured with fibroblasts (LS174T+NCF). Glandular structures were filled with mucin as determined by PAS staining (magenta areas) and displayed full polarization (ZO-1 staining in green, β-catenin in red, DAPI in blue). C: Transmission electron microscopy revealed that well-developed glandlike structures with microvilli at their luminal side (L) were present in LS174T spheroids and in tumor spheroid/fibroblast co-cultures (LS174T + FB) (top). Nuclei of tumor cells are labeled (N). Scale bar = 500 nm. D: Junctional complexes containing desmosomes (D), tight junctions (T), and adherens junctions (A) were formed between LS174T tumor cells in the presence of fibroblasts (bottom), whereas LS174T spheroids alone displayed more rudimentary desmosomal structures (top). Interdigitations (I) and microvilli (MV) were present on LS174T cells under both conditions. Scale bar = 200 nm.
Phenotypic Characterization and Morphology of the Tumor Cell Clusters
In the presence of fibroblasts, LS174T tumor spheroids (Figure 2A) displayed well-organized glandular structures during the early phases (24 to 48 hours) of the co-culture as revealed H&E staining (Figure 2B). The epithelial cells expressed the luminal tight junction protein ZO-1, predominantly membrane-associated β-catenin, and secreted mucin into the glandular structures (Figure 2B). Electron microscopy revealed the characteristic intestinal cell microvillus seam at the luminal side on LS174T cells when grown alone or in the LS174T-NCF co-cultures. Differences in the electron density of the mucus were observed when comparing LS174T spheroids cultured alone versus the co-cultures, most likely reflecting the presence of different type of mucins (Figure 2C). Differences were also noted in the cell-cell interactions, with well-established desmosomes, adherens junctions, and tight junctions observed in the LS174T cells co-cultured with fibroblasts, which were less developed in LS174T cells grown alone (Figure 2D).
Fibroblast–Tumor Cell Interaction
Fibroblasts, when added to the cultures, formed a well-organized network around the tumor cell spheroids within 2 to 3 days (Figure 3A, left), regardless of the source of fibroblasts. The fibroblasts expressed PDGFRβ, and some were closely attached to the tumor spheroid surface (Figure 3A). Electron microscopy revealed close cell-cell interactions between epithelial cells and fibroblasts in tumor spheroid/fibroblast co-cultures (Figure 3B). Fibroblasts in the collagen gels, like in tissues, displayed spindle-shaped morphologic features (Figure 3, A and C), which did not change on co-cultivation with tumor cell spheroids. They expressed the fibroblast markers fibroblast activation protein α, vimentin, Thy1, PDGFRα and β, and α-smooth muscle actin and were negative for endothelial, pericyte, and epithelial markers, closely resembling activated fibroblasts in tumor stroma in vivo (Figure 3C; see also Supplemental Figure S3 at http://ajp.amjpathol.org). In summary, the in vitro cultures closely mimic the cellular architecture of human colon carcinoma samples at the histologic level (Figure 3C) and the phenotype of activated tumor fibroblasts.32
Figure 3.
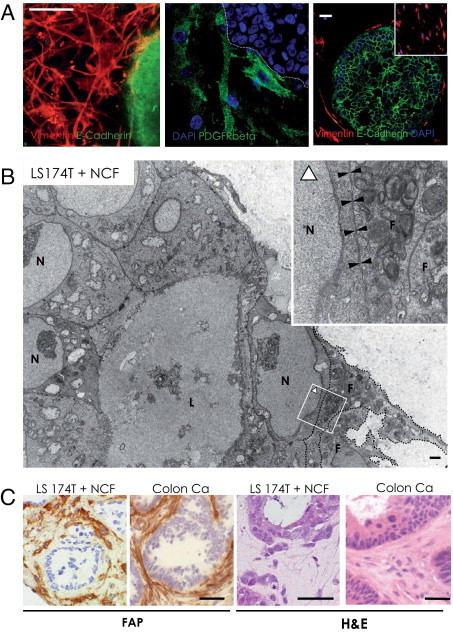
Tumor cell spheroid-fibroblast interaction. A: Confocal imaging of in gel immunofluorescence staining. The left panel shows a superimposed 28 micrometer Z-stack (vimentin in red, E-cadherin in green). The middle panel shows that PDGFRβ-positive normal colon fibroblasts (green) make close contacts to LS174T spheroids. The border of the spheroid is outlined (white dashed line). The right panel shows single-plane confocal image of vimentin-positive fibroblasts (red), which surrounded E-cadherin–positive tumor spheroids (green). Nuclei were stained with DAPI (blue). Scale bar = 50 μm. Small inset: fibroblasts cultured in collagen gels alone express similar levels of vimentin. B: Epithelial cells developed tight cell-cell contact with fibroblasts (F, encircled by dotted line) at the invasive structures (black arrowheads in insert, bottom) as revealed by electron microscopy. The inset is a higher magnification of the area indicated by the white lined rectangle. The orientation of the inset is indicated by a white triangle. Nuclei of tumor cells are labeled (N). Scale bar = 500 nm. C: Fibroblast activation protein α (FAP) stained the fibroblasts in the co-cultures (top) strikingly similar to activated fibroblasts in a human colon adenocarcinoma (bottom). Scale bar = 200 μm. H&E stains of LS174T spheroids plus NCFs in collagen gels after 3 days of culture display close cell-cell interaction and tumor cell heterogeneity. In the presence of NCFs, condensed and restructured collagen fibers were present and fibroblasts were nestled around tumor epithelial cell islands in similar density and morphologic features compared with a representative human colon carcinoma specimen. Scale bar = 50 μm.
Co-cultivation experiments of other human cancer cells, such as colon cancer (HCT116, HT-29) and mammary tumor cell spheroids (MCF7, BT474) with CAFs, displayed similar phenotypes with respect to their in vivo counterparts (data not shown), demonstrating the general feasibility of the assay to study heterotypic interactions in epithelial cancers.
The in Vitro System Recapitulates Major Features of Colon Carcinomas in Vivo
Tumor cells within the spheroids were highly proliferative as shown by staining for pRb37 similar to colon carcinomas in vivo.38 In contrast, co-cultured fibroblasts were predominantly quiescent, displaying rare retinoblastoma phosphorylation (Figure 4A). These immunofluorescence results were confirmed by Western blot analysis. The co-culture did not significantly change the pRb status of the cells (Figure 4A, right). When colon tumor spheroids grew beyond more than 450 μm in diameter, they showed a ring of proliferating cells surrounding apoptotic/necrotic central areas39 (see Supplemental Figure S4 at http://ajp.amjpathol.org), mimicking in vivo observations.40
Figure 4.
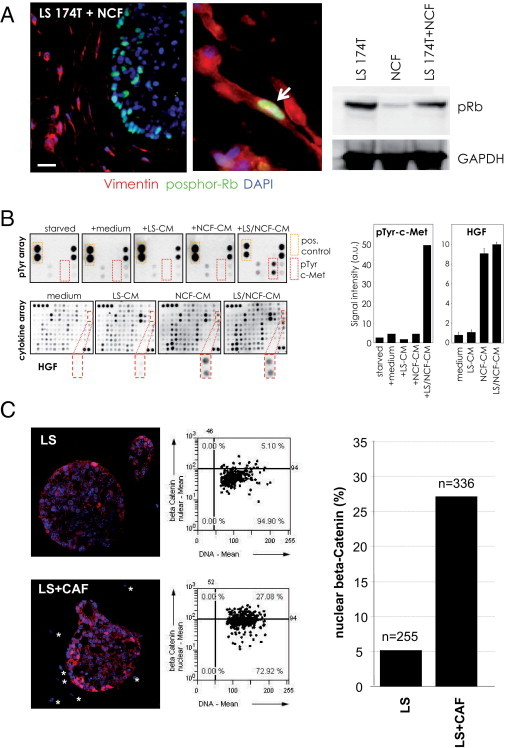
Molecular pathway analysis. A: pRb (green) was predominantly found in tumor cell nuclei, whereas vimentin-positive fibroblasts (red) were rarely positive for pRb. Nuclei were stained with DAPI (blue). Scale bar = 20 μm. Western blots of collagenase B released cells confirmed the pRb status from the immunofluorescence analysis. B: LS174T cells were starved for 6 hours and subsequently treated with conditioned media from LS174T spheroid collagen cultures (LS-CM), fibroblast collagen gel cultures (NCF-CM), or LS174T/fibroblast co-cultures (LS/NCF-CM) for 15 minutes. Further starvation (starved) and treatment with fresh culture medium (medium) served as controls. After lysing the cells phospho-receptor tyrosine kinase (pTyr) arrays demonstrated c-Met phosphorylation in LS174T cells, when treated with conditioned medium from LS174T-fibroblast co-cultures (LS/NCF-CM). c-Met was phosphorylated neither on tumor cells nor in fibroblasts when individually cultured in collagen gels (left, top). Cytokine arrays (left, bottom) revealed the presence of HGF in both tumor cell/fibroblast co-cultures and fibroblast monocultures. Quantitative evaluation of the phospho-c-Met and HGF levels by chemiluminescent imaging is shown in the right panel. C: Distribution of β-catenin protein (red) in LS174T cells grown in spheroids for 5 days either alone (LS) or as LS174T-CAF co-cultures (LS+CAF). The percentage of nuclear β-catenin–positive cells was determined using quantitative image analysis (scattergrams). Cell nuclei were stained with DAPI (blue). The numbers of cells analyzed (n) are indicated.
Subsequently, we analyzed the status of the hepatocyte growth factor (HGF)–Met axis, which is one of the best-characterized epithelial-stromal paracrine pathways. c-Met overexpression and paracrine activation by HGF, which is produced by stromal cells,41 has been implicated in colon cancer development, invasiveness, and clinical outcome.42,43 Using tyrosine kinase receptor arrays, we showed that c-Met was tyrosine phosphorylated in the LS174T tumor cells, when incubated with conditioned medium from LS174T spheroid/fibroblast co-cultures; however, c-Met was not phosphorylated when incubated with conditioned medium from tumor spheroid or fibroblast monocultures (Figure 4B). On the other hand, HGF was selectively produced by the fibroblasts as demonstrated by cytokine array analysis (Figure 4B). This indicated a selective proteolytic activation of the HGF precursor in the co-cultures, which is in line with the reported expression of an HGF activator protease by colon cancer cells.44
A recent report demonstrated that high Wnt pathway activity in colon adenocarcinoma cells was induced by the presence of stromal myofibroblasts both in vitro and in vivo. This paracrine stimulation of the Wnt pathway was accompanied by the induction of a cancer stem cell phenotype.9 A similar behavior was observed in our model. We observed a heterogeneous activation of the Wnt pathway on the LS174T spheroids as revealed by the staining of β-catenin, a marker protein for Wnt pathway activation. In LS174T spheroids, most cells displayed membrane bound β-catenin, with only a few cells showing nuclear β-catenin localization (Figure 4C). When LS174T cells were co-cultivated with colon-derived fibroblasts (NCF and CAFs), the percentage of nuclear β-catenin–positive cells increased more than fivefold (Figure 4C, bottom, right), indicative of Wnt pathway activation via the stromal fibroblasts. Thus, we demonstrate that the in vitro assay closely recapitulated physiologic aspects and activation of essential pathways described in vivo in colon cancer.
Fibroblasts Induce Invasive Spreading of LS174T Cells
LS174T cells were transfected with DsRed and stable clones were selected (LS174TdsR). LS174TdsR cell spheroids were embedded in collagen gels in the presence or absence of fibroblasts, incubated, and followed by light and fluorescence microscopy. After prolonged co-culture (from day 4 onward), the presence of fibroblasts in the cultures induced an invasive phenotype in the LS174T cells (Figure 5A). Collective and single-cell invasion was observed by confocal imaging (Figure 5, A and B) and time-lapse microscopy of fluorescently labeled tumor cells. Moving single cells displayed round morphologic features and seemed to travel along fibroblast networks within the collagen gel (see Supplemental Figure S5 at http://ajp.amjpathol.org). This movement resembled amoeboid invasion as already shown for mammalian lymphocytes and proposed for lymphomas,45 leukemias,46 and small cell lung cancers. In contrast, LS174T cell spheroids in the absence of fibroblasts displayed a noninvasive phenotype in collagen gels even after 11 days in culture (Figure 5, A and B).
Figure 5.
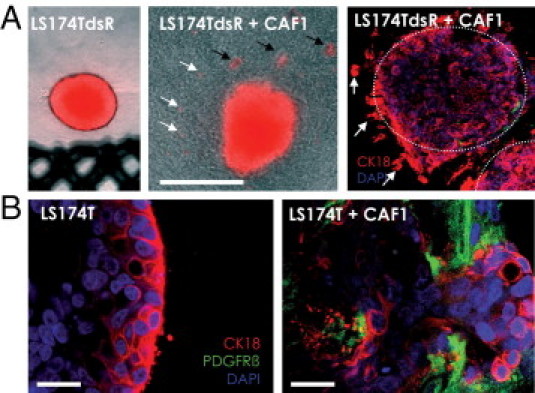
Invasion into the ECM. A: Spheroids were made from LS174T cells expressing DsRed and cultivated in collagen gels for 11 days in the absence (LS174TdsR) or presence of CAFs (LS174T-dsR+CAF1). Photomicrographs depict an overlay of DsRed fluorescence with phase-contrast microscopy. In the presence of fibroblasts, tumor cells invaded into the collagen gel as single cells (white arrows) and cell clusters (black arrows), whereas without fibroblasts the tumor spheroids remained with a perfectly distinct border and showed no sign of invasion, Scale bar = 100 mm. B: Confocal imaging revealed collective invasion of LS174T (CK18 positive, red) into collagen gel areas with high fibroblast density (PDGFRβ positive, green) (right). Control cultures without fibroblasts did not invade (left). Nuclei were stained with DAPI (blue). Scale bar = 50 μm.
Expression Profiling
To further substantiate the suitability of our model for molecular analysis, we determined changes in gene expression on co-cultivation of tumor cells with stromal fibroblasts by GeneChip arrays. Ninety-six LS174T tumor cell spheroids and 2 × 10⁵ fibroblasts were cultured in collagen gels either separately or as co-cultures for 3.5 days (see Supplemental Figure S6 at http://ajp.amjpathol.org). We used SFs, NCFs, and CAFs to reveal common and different responses induced by co-cultivation. Lysates from LS174T monocultures were mixed with fibroblast monoculture lysates and designated monoculture mixed, ensuring that the same amounts of tumor cells and fibroblasts were present as in the co-culture samples. All experiments were performed in biological triplicates. We used a direct lysis approach of the entire collagen gel cultures rather than isolating and sorting of cancer cells and fibroblasts to avoid changes in RNA expression during the isolation process (duration of >1.5 hours). RNA extracted from the mixed and co-culture experiments was processed for whole genome Affymetrix GeneChip analysis (see Supplemental Figure S6 at http://ajp.amjpathol.org). After normalization and bioinformatics analysis, we identified genes differentially regulated in co-cultures compared with cultures identical in the cellular composition but without physical contact during culture. In addition, co-cultivation of LS174T cells with fibroblasts of different origin allowed determining specific responses to the various fibroblast types. PCA detected four clusters dependent on the fibroblasts present in the experimental setup, with the SFs clustering apart from the colon fibroblast clouds (NCFs, CAF1, and CAF2). All co-culture clusters were shifted in the same direction close to the corresponding mix clusters (Figure 6A). A total of 535 genes were differentially expressed in colon fibroblast co-cultures compared with the mixed monocultures [FDR, P < 0.01, FC (fold change) >1.5; 396 up, 139 down]. A total of 176 genes were regulated in the co-cultures with CAFs (134 up and 42 down; FC >1.5, FDR, P < 0.01; see Supplemental Figure S7A at http://ajp.amjpathol.org). A total of 180 genes were differently expressed between colon-derived and SFs (FDR, P < 0.01, 96 up in SFs, 84 up in colon derived fibroblasts), when compared under the monoculture mix conditions.
Figure 6.
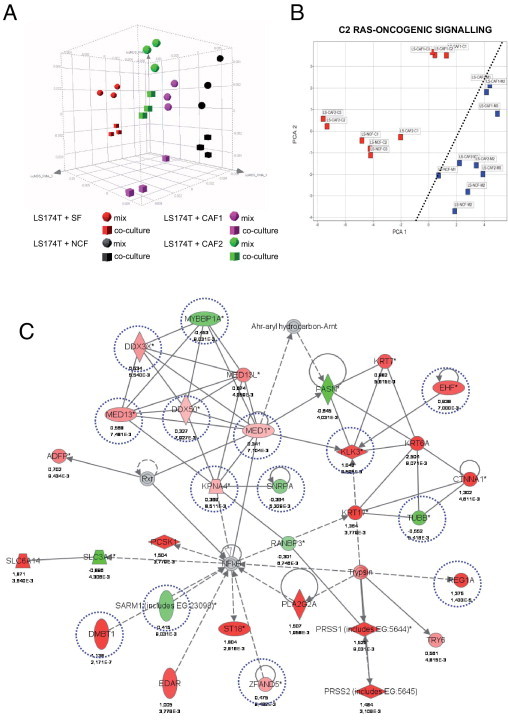
Profiling experiments and pathway analysis. A: 96 tumor cell spheroids (of defined cell numbers) and 2 × 10⁵ fibroblasts were cultured for 3.5 days in collagen gels either as co-cultures or as individual cultures. The whole lysates from LS174T monocultures were mixed with fibroblast monoculture lysates (mix), thereby ensuring the same amount of tumor and fibroblast components present as in the co-culture experiments. The SFs (BJ-1), NCFs (CCD18-Co), and CAFs (12051CAF, 13388CAF; CAF1 and CAF2, respectively) were used. All experiments were performed in biological triplicates. RNA extracted from the mixed and from the co-culture experiments was processed for Affymetrix GeneChip analysis (see Supplemental Figure S6 at http://ajp.amjpathol.org). A: Sammon blot. B: From GSEA the core genes of statistically significant gene sets were used to calculate PCA plots. A clear-cut segregation of the co-culture and the mixed monoculture experiments can be made (dotted line). Activation of ras oncogenic signaling detected in the c2-curated gene sets is shown. C: A 35-gene network clustering around NF-κB revealed by pathway analysis (Ingenuity). In this network, regulation (up: red; down: green) by distinct fibroblast origins is indicated. Dashed blue circles indicate gene expression changed by the presence of colon fibroblasts; genes altered by CAFs are boxed by dashed orange squares. Genes regulated by the presence of any fibroblast type are not encircled.
Pathway Analysis
GSEA47 was used to identify predefined gene sets regulated on co-cultivation. We used two gene set collections from the Molecular Signature Database (Broad Institute48): the c2 curated gene sets and the c5 GO gene sets. Among the data sets most significantly enriched in the co-cultures were gene sets involved in hypoxia, ras signaling, inflammation, ECM deposition, angiogenesis, tissue development, wound healing, and epithelial mesenchymal transition (EMT) (Table 149–61; see also Supplemental Table S2 at http://ajp.amjpathol.org). The core genes of statistically significant gene sets were used to calculate PCA plots. A clear-cut segregation of the individual co-culture and the mixed monoculture experiments was evident for all gene sets tested. Examples for activation of ras-oncogenic signaling (Figure 6B) and cell-cell signaling (see Supplemental Figure S7B at http://ajp.amjpathol.org) are shown.
Table 1.
List of the Most Significantly Enriched Pathways Sorted by the Normalized Enrichment Score Using the c2 Curated Gene Sets of Genes Upregulated in LS174T/Colon Fibroblast Co-Cultures
| Name | Size | FDR q-val | Description | Reference |
|---|---|---|---|---|
| MENSE_HYPOXIA_UP | 107 | 0000 | Hypoxia-induced genes in astrocytes and HeLa cells | 49 |
| RAS_ONCOGENIC_SIGNATURE | 265 | 0000 | Genes induced by activated H-Ras oncogene in HMECs | 50 |
| CHEN_HOXA5_TARGETS_UP | 229 | 0000 | Genes induced by HOXA5 in Hs578T breast cancer cells | 51 |
| HINATA_NFKB_UP | 106 | 0000 | Genes up-regulated by NF-κB in keratinocytes and fibroblasts | 52 |
| MANALO_HYPOXIA_UP | 94 | 0000 | Genes up-regulated in pulmonary endothelial cells under hypoxia or expressing constitutively active HIF-1α | 53 |
| LEE_DENA_UP | 59 | 0000 | Genes up-regulated in hepatoma induced by diethylnitrosamine | 54 |
| EMT_UP | 61 | 0000 | Genes upregulated during the TGF-β–induced EMT of Ras-transformed mouse mammary epithelial (EpH4) cells | 55 |
| CARIES_PULP_UP | 205 | 0000 | Genes up-regulated in pulpal tissue from extracted carious teeth compared with healthy teeth tissues | 56 |
| HYPOXIA_REVIEW | 81 | 0000 | Genes known to be induced by hypoxia | 57 |
| GERY_CEBP_TARGETS | 111 | 0000 | Genes up-regulated by inducible C/EBPs in NIH3T3 fibroblasts | 58 |
| DORSEY_DOXYCYCLINE_UP | 29 | 0000 | Genes up-regulated by Dox inducible Gab2 (Erk2/Elk1 pathway) in K562 cells | 59 |
| HYPOXIA_FIBRO_UP | 20 | 0004 | Genes up-regulated by hypoxia in normal fibroblasts from young and old donors | 60 |
| LEE_CIP_UP | 60 | 0004 | Genes up-regulated in hepatoma induced by ciprofibrate | 54 |
| IRS_KO_ADIP_UP | 28 | 0006 | Genes up-regulated in preadipocytes with defects in adipocyte differentiation (Irs4 KO, Irs2 KO, Irs3 KO, Irs1 KO) | 61 |
Size indicates the number of genes in the gene set.
FDR, false discovery rate; HIF-1α, hypoxia induced factor 1 alpha; HMEC, human microvascular endothelial cell; q-val, the FDR analogue of the P value; TGF-β, transforming growth factor β.
Pathway analysis (Ingenuity) revealed similar gene networks (eg, linked to cancer, embryonic and tissue development, cell growth and proliferation, cell-to-cell signaling, immune response, and being extensively regulated in tumor/stroma co-cultures) (Table 1; see also Supplemental Table S2 at http://ajp.amjpathol.org). A 35-gene network clustering around NF-κB displayed extensive regulation (Figure 6C). Eleven genes were regulated in the presence of all fibroblast types, expression of 10 genes changed by the presence of colon fibroblasts, whereas eight genes were solely altered by co-cultivation with CAFs. Expression profiles of selected genes are shown in Figure 7. CEACAM5 encoding the diagnostically relevant carcinoembryonic antigen (CEA) was most potently induced by colon CAFs, with intermediate induction by normal colon fibroblasts and no changes observed in the presence of SFs (Figure 7A, left panel). Elevated CEA protein levels in tumor spheroids co-cultured with CAFs validated the RNA expression data (Figure 7A, right panel). The induction of CXCL8 (interleukin 8) at the mRNA level on co-culture with colon-derived fibroblasts (Figure 7B, left) was verified by enzyme-linked immunosorbent assay in the respective culture supernatants. CXCL8 levels were low in LS174T cultures and were raised by a factor of two to 5 to 7 ng/mL in the co-cultures with colon-derived fibroblasts. LS174T spheroid/skin fibroblast co-cultures did not show a synergistic up-regulation in concordance with the RNA data (Figure 7B, right).
Figure 7.
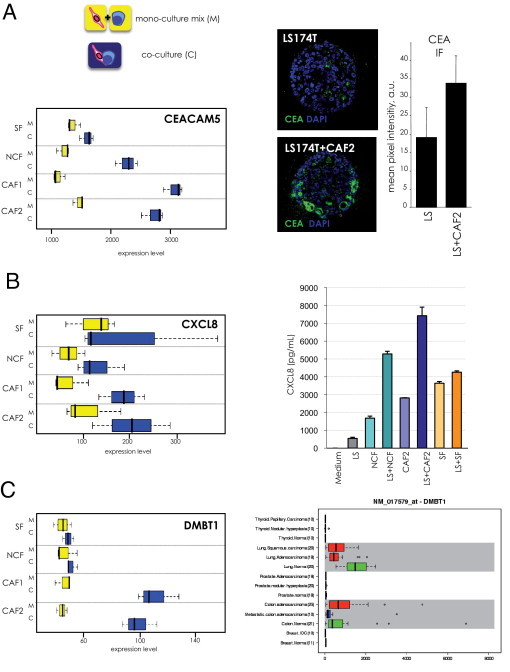
Selected genes induced by the co-cultivation of LS175T cells with stromal fibroblasts. A: Whisker box plots displaying the expression profile of CEACAM5 (yellow: mixed individual cultures; blue: co-cultures) (left) and confocal images and quantification of CEA immunofluorescence staining (green) of LS174T spheroids alone and LS174T spheroids co-cultured with 13388CAFs (CAF2) (right). Nuclei are counterstained with DAPI (blue). Determination of the mean pixel intensity/spheroid revealed a twofold increase in CEA protein expression on co-culture. Error bars are SD from four different spheroids. B: The expression profile of CXCL8 (interleukin 8, left) was validated by determining CXCL8 levels in conditioned medium of monocultures and co-cultures (right). Error bars are SD of three measurements. C:DMBT1 expression was selectively induced by the co-culture with CAFs (left). DMBT1 displayed a unique expression pattern in normal tissues versus major tumor types as determined by the GeneExpress database (GeneLogic). The bold centerline indicates the median; the box represents the interquartile range (IQR). Whiskers extend to 1.5 times the IQR. Outliers are depicted as black circles.
As indicated above, we observed changes in the mucous structure under co-cultivation conditions compared with monocultures (Figure 2C); therefore, we analyzed the expression of MUC genes in both systems. Indeed, expression of MUC5AC, MUC5B, MUC17, and MUC1 was induced in co-cultures, whereas MUC2 expression decreased on co-cultivation (see Supplemental Figure S8 at http://ajp.amjpathol.org). The expression of other MUC genes was unchanged. Importantly, MUC1 has been reported to be increased in colon carcinomas and is considered a marker for metastasis.62 MUC5AC is not expressed in normal colon and is induced in adenomas and carcinomas63; by contrast, MUC2 mRNA expression is lower in colon adenocarcinomas than in normal colon.64
One of the most significantly regulated genes from the NF-κB network was DMBT1 (deleted in malignant brain tumors 1). DMBT1 was selectively induced by LS174T/CAF co-culture (Figure 7C, left). Loss of DMBT1 in astrocytomas and in squamous carcinomas is well established and indicates that DMBT1 might be a tumor suppressor. However, in gastrointestinal carcinomas DMBT1 expression is transiently up-regulated during tumorigenesis and decreased only in dedifferentiated cancers65,66 and has been shown to be induced on proinflammatory stimuli via the NF-κB pathway.67 Using a large expression database (Affymetrix Exon Chip, BioExpress, GeneLogic, Gaithersburg, MD), we demonstrated that DMBT1 mRNA was present in normal colon and lung and absent or very weakly expressed in normal breast, prostate, and thyroid gland. DMBT1 expression was significantly reduced in lung carcinomas, whereas colon cancer samples displayed increased DMBT1 levels. In agreement with published data, DMBT1 levels decreased in metastatic colon cancers, whereas breast, prostate, and thyroid cancers showed low or no DMBT1 mRNA (Figure 7C, right). The data were confirmed in a different database using Affymetrix Plus GeneChip-based BioExpress databases (see Supplemental Figure S9A at http://ajp.amjpathol.org). Prominent up-regulation of DMBT1 was also observed in stomach, pancreatic, esophagus, and colon mucinous carcinomas when compared with the levels of the respective normal tissue counterparts (see Supplemental Figure S9B at http://ajp.amjpathol.org).
Monitoring Tumor Growth and Apoptosis on Inactivation of the PI3K Pathway
First, we determined the growth rate of the tumor spheroids by calculating the size of individual spheroids at different time points (Figure 8A). The mean size of 8 to 10 spheroids was calculated. The rate in tumor spheroid volume increase was similar whether fibroblasts were present in the cultures or not (Figure 8B). To demonstrate the applicability of the system for drug testing, we treated the LS174T/fibroblast co-cultures with the PI3K inhibitor LY294002. Tumor cell growth was measured daily as described. In the presence of LY294002, the size of the spheroids increased only 1.5 times during the observation period, in contrast to the untreated controls, which displayed a fivefold increase (Figure 8C). LS174T spheroid monocultures behaved similarly (Figure 8C). Fibroblast morphologic features or cell number did not change on LY294002 treatment, indicating no or minor effects on the stromal compartment. Staining of sections with activated caspase 3 antibody revealed 25% apoptosis in tumor cell spheroids on PI3K inhibition, whereas control cultures displayed an average apoptotic rate of <10% (Figure 8D). Activation of caspase 3 in the fibroblasts was detectable in 4% of the untreated and in 3% of the treated cultures, indicating that the low apoptosis rate in fibroblasts was not affected by the inhibitor (Figure 8D). The mitotic index of tumor cells was determined by phospho-histone H3 staining and found to be reduced more than threefold on treatment with LY294002 compared with controls (Figure 8E). Phospho-histone H3–positive fibroblasts were not detected, indicating absent or very low mitotic activity. Representative immunohistochemistry (IHC) stains for those markers are shown in Supplemental Figure S10 (available at http://ajp.amjpathol.org).
Figure 8.
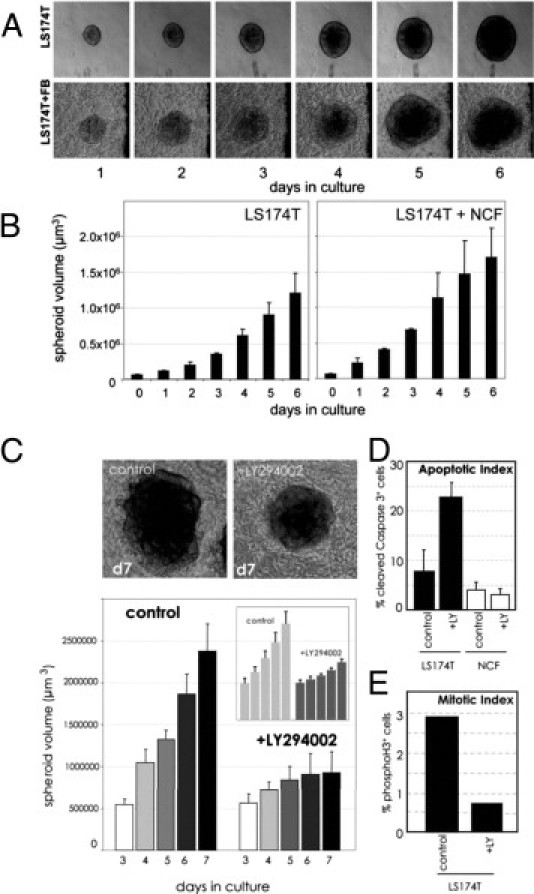
Reduced tumor growth by inhibition of the PI3K pathway. A: LS174T spheroids were cultured individually or together with fibroblasts in collagen gels and photographed daily. The top panel shows photomicrographs of a time-lapse experiment. B: The increase in the mean volume of six spheroids is shown graphically (error bars indicate SD) and can be defined to be equal to tumor growth. C: LS174T spheroids were cultured in fibroblast-containing collagen gels for 3 days and subsequently treated with 5 μmol/L of the PI3K inhibitor LY294002 for another 4 days. Untreated control cultures are shown for comparison. The bars indicate the mean volume of eight individual spheroids followed for 4 days under each condition. Error bars are SD. Treated versus untreated cultures at day 7 are depicted in micrographs above the diagram. The small inset depicts the same experimental setup except that LS174T spheroids were grown without fibroblasts. D: Sections of LY294002 treated and untreated cultures (as in A) were stained with anticleaved caspase 3. The percentage of positive tumor cells and fibroblasts were determined based on total cell number (present nuclei) and are displayed (total number of nuclei: n = 494 in control cultures, n = 335 in LY294002-treated gels, error bars are SD of 10 microscopic fields). E: Sections (as in D) were stained with anti–phospho-histone H3. The mitotic indices were determined by counting phospho-H3–positive tumor cells from different sections (control, n = 454, +LY, n = 397).
Discussion
There is strong evidence that demonstrates the active role of the tumor stroma in tumorigenesis; however, with only a few exceptions the molecular mechanisms involved in the paracrine interactions between the tumor and the surrounding stroma remain poorly understood.68 This is probably due to the limitations of available in vitro models to reflect the heterogeneous (cellular and molecular) composition of human cancers and the cellular complexity of animal models.
Cellular heterogeneity and interaction in a 3D environment is not reproduced by standard tissue culture techniques on 2D surfaces. The 3D in vitro models closely mimic features of the in vivo situation and provide unique possibilities to study the behavior of cancer.69 Organotypic 3D co-culture models have been used to study the functional interplay between tumor cells and fibroblasts in different models.18,23,26,70,71 Our approach was focused in a colon cancer model in which the in vivo cellular complexity was reduced to two cell types, the tumor cells and stromal fibroblasts, to better analyze the specific molecular interactions of these two cell types during their growth in vitro. However, we introduce other important features of the in vivo growth: the three-dimensionality that was achieved by using spheroid 3D cultures and by embedding the cellular components into a collagen I–rich ECM, a model that resembles the previously described breast cancer model.72 The system is modular and offers the possibility to compare results from single-component cultures with the co-cultures, thus allowing molecular screens to identify pathways that are not active in monocultures but induced on co-cultivation similar to a breast cancer study, which identified a stroma-induced gene by differential display.23
In addition, it is possible to exchange the modules in the co-cultivation experiments or to even extend the cellular components in the co-cultivation screens to three or four cellular components (eg, to add tumor-associated macrophages or endothelial cells).
In summary, we provide evidence that our colon cancer model mimics the cellular architecture of human cancer tissues both histologically and phenotypically. We also found a normalization of the epithelial structures in the co-culture assay at early time points. Later, the invasive potential of colon cancer cells is induced in the co-culture system. Therefore, we speculate that a normalization of the epithelial phenotype takes place at the beginning of the co-culture period, whereas a more aggressive colon cancer phenotype is visible at later stages. LS174T cells displayed invasive behavior with features of collective cell migration as frequently seen in human carcinomas,70,73 when in contact with stromal fibroblasts (Figure 5). Fibroblast-led cancer cell invasion was recently shown to operate in invasive head and neck squamous cell carcinoma.26 Molecular profiling of monocultures and co-cultures can be used to characterize known and to identify novel pathways in tumor-stroma interaction.23 The potential to study the role of drug targets in 3D74 was demonstrated. Additional advantages for therapeutic studies can be envisioned. It has been shown that cancer cells grown as spheroids display multicellular resistance (MCR), which makes them less susceptible to different therapies.75 Cancer cells in patients often display the same MCR; therefore, the impact of MCR can be closely investigated preclinically in this model. The effect of stromal cells on tumor cells on chemotherapy and radiotherapy can be addressed. Recent reports demonstrated decreased sensitivity of tumor cells to therapy when co-cultured with activated stromal fibroblasts,76,77 and finally the effects of novel agents targeting the tumor stroma can be investigated in detail.
The molecular analysis of the tumor-stroma interaction has revealed that the well-defined paracrine HGF/c-Met cross talk and the activation of the Wnt pathway were recapitulated in our model. Comparison of the gene expression profiling in monocultures versus co-cultures revealed a number of pathways, which were selectively activated on co-cultivation of tumor cells with CAFs. For example, the Ras signaling pathway or the NF-κB signaling pathway was altered on co-cultivation with colon-derived fibroblasts (33 of 36 genes regulated in the NF-κB network). The activation of NF-κB is associated with inflammation-associated colon carcinoma and tumor progression.78 We provide first evidence of NF-κB activation by interaction of tumor cells with stromal fibroblasts. The NF-κB target CXCL8 was specifically induced in co-cultures and may promote tumor growth, neutrophil activation, invasion, and tumor angiogenesis as proposed.79–81 Because only human cells are used in the system, concerns about species specificity of cytokines and growth factors and their respective receptors (as is the case in xenograft mouse models) can be neglected. At the moment, because of the technical setup of the screening procedure, we were not able to distinguish in which compartment certain pathways are regulated. A protocol to separate fibroblasts from tumor cells in the assay is currently under development (H. Dolznig, data not shown). The role of DMBT1, a NF-κB regulated gene, in tumorigenesis is not well defined. DMBT1 functions as a tumor suppressor in many squamous epithelial cancers and in brain tumors, but its role in gastrointestinal cancers is less clear.66,67,82 DMBT1 was selectively induced by co-culture of cancer cells with CAFs and is up-regulated in gastrointestinal cancers. The increase in DMBT1 expression in primary colon cancers and its down-regulation in metastatic colon carcinomas point to an early role in tumorigenesis as already discussed in the literature. Taken together, the involvement of many genes of the identified NF-κB network in cancer makes this tumor-stroma interaction–induced pathway highly relevant for colon cancer development.
Both RAS signaling and NF-κB activity are essential for EMT. The EMT-specific gene set was specifically enriched in the co-cultivation experiments, suggesting that epithelial-fibroblast interaction in colon carcinomas induces EMT by parallel activation of the RAS pathway and the inflammatory NF-κB response,83 which can easily be addressed in the system in the future.
Moreover, we demonstrated that many gene sets (including ECM remodeling and EMT), which were regulated exclusively on co-cultivation of LS174T tumor cells with CAFs, were also activated in an ex vivo screen, in which laser capture microdissected tumor stroma was compared with normal stroma from colon cancer patient samples (Rupp et al84 and Rupp et al, unpublished data). The complementarities of the two approaches emphasized the relevance of the 3D co-culture model to dissect and to identify specific pathways involved in tumorigenesis.
Novel molecular targets can be validated by genetically modifying the tumor cell compartment or the stromal cells in the system85 and the functional relevance demonstrated in in vivo animal models. The possibility to compare the in vitro data with the data obtained from human material, linked to the fact that it is robust and highly versatile, should allow the use of our model as an accurate tool for target identification and validation with the potential to reduce animal experiments during drug discovery.
Acknowledgments
We are grateful to Peter Steinlein and Pavel Pasierbek for help with confocal imaging and Markus Hengstschläger, Norbert Kraut, and Günther Adolf for critically reading the manuscript and helpful discussions.
Footnotes
Supported by Boehringer Ingelheim RCV GmbH & Co KG (H.D., C.R., C.P., C.H., N.S., and P.G.C.) and the Herzfelder Family Foundation(H.D.).
Supplemental material for this article can be found at http://ajp.amjpathol.org or doi: 10.1016/j.ajpath.2011.03.015.
Supplementary data
Collagen gel assays. Spheroids of different tumor cell lines were grown for 3 to 7 days in collagen I gels and photographed. Some cell lines showed strong invasive capacity (SK-OV3, Colo699, KNS5, H446), whereas others remained compact with sharp borders (A549, MCF7, BT474, HT29).
A: Phenotypic characterization of freshly isolated CAFs. CAFs from two different colon carcinoma specimens at low passage numbers (p2-p3) were analyzed for the presence of the mesenchymal marker vimentin, smooth muscle actin (SMA), and the absence of the epithelial cytokeratin 8 (CK8) by immunofluorescence staining. hTERT immortalized BJ-1 SFs are shown as control fibroblasts. B: DNA content and EdU incorporation as determined by flow cytometry revealed similar proliferation rates in the different fibroblasts.
Expression profiling characterization of fibroblasts. Affymetrix GeneChip analysis revealed that the expression of the fibroblast markers fibroblast activation protein α (FAP), vimentin (VIM), THY1, PDGFRα and β, and smooth muscle actin (SMA) (ACTA2) were high in CAF1 (passage number 3) and CCD18-Co NCFs. The fibroblasts were negative for epithelial markers as demonstrated by very low expression of cytokeratin 18 (KRT18) and E-cadherin (CDH1). The expression of blood endothelial markers CD31 (PECAM1), EndoGlyx (MMRN2), VE-cadherin (CDH5), the lymph endothelial marker PROX1, and the pericyte marker NG-2 (CSPG4) was also barely detectable. LS174T epithelial tumor cells and blood endothelial cells (EC) are shown as control. Results are from biological triplicates. The bold centerline indicates the median; the box represents the interquartile range (IQR). Whiskers extend to 1.5 times the IQR.
Cell death in the spheroid core. When HCT116 tumor cell spheroids reached a diameter of approximately 500 μm, cell death occurred in the center of the 3D structures as indicated by the uptake of propidium iodide (PI, red) in living cultures (left). Morphologic examination (H&E) revealed loss of cell-cell contacts in the center of the spheroids accompanied by reduction of phospho-Akt in that central area. Scale bar = 100 μm.
Tumor cell motility. DsRed-labeled LS174T spheroids were co-cultured with colonic fibroblasts and followed by time lapse videomicroscopy for 11 hours. White arrows indicate the track of a single tumor cell (red); the position of the cell was determined every hour (circles).
Illustration of the workflow to obtain a mixture of RNA from tumor cell spheroids (blue cell cluster) and fibroblast (elongated cells in magenta) monocultures and RNA from co-cultures. A defined number of tumor cell spheroids grown for 2 days (96 spheroids initially seeded with 150 LS174T cells) and exactly determined cell numbers of the different fibroblasts (2 × 10⁵) were used. The whole lysates from LS174T monocultures were mixed with fibroblast monoculture lysates (lysates, monoculture mix), thereby ensuring the same amount of tumor and fibroblast components present as in the co-culture experiments (lysates, co-culture). RNA extracted from the mixed monoculture and from the co-culture experiments was processed for Affymetrix GeneChip analysis.
A: Number of regulated genes in co-cultivation experiments compared with mixed monoculture experiments. Genes with a fold change >1.5 and adjusted FDR P values of <0.01 were defined as significantly regulated. Left: Co-cultivation of LS174T spheroids with colon fibroblasts (NF, CAF1, CAF2 + LS174T); numbers of up-regulated genes are shown in red, down-regulated genes are displayed in green. Right: Number of genes specifically regulated by the co-culture of CAFs with tumor cells (CAF1, CAF2 + LS174T). Red: Up-regulated, green: down-regulated. B: Co-culture of LS174T spheroids with CAFs changed cell-cell communication pathways. GSEA identified cell-cell signaling as defined in GO terms. In this set, PCA separated the individual mixed monocultures (blue) from the corresponding co-cultures (red).
Mucin expression in LS174T-fibroblast co-cultures (C) versus monoculture mix (M). Whisker box plots displaying the expression profile of MUC1, MUC2, MUC5AC, MUC5B, and MUC17 (yellow: mixed individual cultures; blue: co-cultures). Results are from biological triplicates after 3.5 days of co-co-cultures or mixed monocultures. The bold centerline indicates the median; the box represents the interquartile range (IQR). Whiskers extend to 1.5 times the IQR.
DMBT1 expression in major human tumors and their normal tissue counterparts in large expression databases (BioExpress, GeneLogic, Affymetrix Human Genome U133 Plus 2.0 GeneChip based database). A:DMBT1 mRNA was expressed in normal colon and increased in colon carcinomas, whereas normal lung was positive for DMBT1 and DMBT1 decreased in lung tumors. B:DMBT1 RNA was significantly increased in mucinous colon carcinomas, esophagus carcinomas, and stomach and pancreas carcinomas. Red: cancer samples; green: normal tissue samples. The bold centerline indicates the median; the box represents the interquartile range (IQR). Whiskers extend to 1.5 times the IQR. Outliers are shown as small circles.
PI3K inhibitor (LY294002) treatment of LS174T colon fibroblast 3D co-cultures. Sections from DMSO control and LY294002 treated co-cultures were stained for cleaved caspase 3 (top) as a marker for apoptotic cells. The number of cleaved caspase 3–positive tumor cells was increased compared with the control. Fibroblast were not affected. Cell proliferation was assessed by the mitosis marker phospho-histone H3 (bottom). LY294002-treated cultures showed reduced numbers of phospho-histone H3–positive tumor cells compared with the DMSO controls. Fibroblasts did not show phospho-histone H3 staining under both conditions.
References
- 1.Jemal A., Siegel R., Ward E., Murray T., Xu J., Thun M.J. Cancer statistics, 2007. CA Cancer J Clin. 2007;57:43–66. doi: 10.3322/canjclin.57.1.43. [DOI] [PubMed] [Google Scholar]
- 2.Bhowmick N.A., Neilson E.G., Moses H.L. Stromal fibroblasts in cancer initiation and progression. Nature. 2004;432:332–337. doi: 10.1038/nature03096. [DOI] [PMC free article] [PubMed] [Google Scholar]
- 3.Bissell M.J., Radisky D. Putting tumours in context. Nat Rev Cancer. 2001;1:46–54. doi: 10.1038/35094059. [DOI] [PMC free article] [PubMed] [Google Scholar]
- 4.Mueller M.M., Fusenig N.E. Friends or foes - bipolar effects of the tumour stroma in cancer. Nat Rev Cancer. 2004;4:839–849. doi: 10.1038/nrc1477. [DOI] [PubMed] [Google Scholar]
- 5.Folkman J., Hanahan D. Switch to the angiogenic phenotype during tumorigenesis. Princess Takamatsu Symp. 1991;22:339–347. [PubMed] [Google Scholar]
- 6.Olumi A.F., Grossfeld G.D., Hayward S.W., Carroll P.R., Tlsty T.D., Cunha G.R. Carcinoma-associated fibroblasts direct tumor progression of initiated human prostatic epithelium. Cancer Res. 1999;59:5002–5011. doi: 10.1186/bcr138. [DOI] [PMC free article] [PubMed] [Google Scholar]
- 7.Orimo A., Weinberg R.A. Stromal fibroblasts in cancer: a novel tumor-promoting cell type. Cell Cycle. 2006;5:1597–1601. doi: 10.4161/cc.5.15.3112. [DOI] [PubMed] [Google Scholar]
- 8.Yauch R.L., Gould S.E., Scales S.J., Tang T., Tian H., Ahn C.P., Marshall D., Fu L., Januario T., Kallop D., Nannini-Pepe M., Kotkow K., Marsters J.C., Rubin L.L., de Sauvage F.J. A paracrine requirement for hedgehog signalling in cancer. Nature. 2008;455:406–410. doi: 10.1038/nature07275. [DOI] [PubMed] [Google Scholar]
- 9.Vermeulen L., De Sousa E.M.F., van der Heijden M., Cameron K., de Jong J.H., Borovski T., Tuynman J.B., Todaro M., Merz C., Rodermond H., Sprick M.R., Kemper K., Richel D.J., Stassi G., Medema J.P. Wnt activity defines colon cancer stem cells and is regulated by the microenvironment. Nat Cell Biol. 2010;12:468–476. doi: 10.1038/ncb2048. [DOI] [PubMed] [Google Scholar]
- 10.Bodnar A.G., Ouellette M., Frolkis M., Holt S.E., Chiu C.P., Morin G.B., Harley C.B., Shay J.W., Lichtsteiner S., Wright W.E. Extension of life-span by introduction of telomerase into normal human cells. Science. 1998;279:349–352. doi: 10.1126/science.279.5349.349. [DOI] [PubMed] [Google Scholar]
- 11.Hahn W.C., Counter C.M., Lundberg A.S., Beijersbergen R.L., Brooks M.W., Weinberg R.A. Creation of human tumour cells with defined genetic elements. Nature. 1999;400:464–468. doi: 10.1038/22780. [DOI] [PubMed] [Google Scholar]
- 12.Iyer V.R., Eisen M.B., Ross D.T., Schuler G., Moore T., Lee J.C., Trent J.M., Staudt L.M., Hudson J., Jr., Boguski M.S., Lashkari D., Shalon D., Botstein D., Brown P.O. The transcriptional program in the response of human fibroblasts to serum. Science. 1999;283:83–87. doi: 10.1126/science.283.5398.83. [DOI] [PubMed] [Google Scholar]
- 13.Bell E., Ehrlich H.P., Buttle D.J., Nakatsuji T. Living tissue formed in vitro and accepted as skin-equivalent tissue of full thickness. Science. 1981;211:1052–1054. doi: 10.1126/science.7008197. [DOI] [PubMed] [Google Scholar]
- 14.Runswick S.K., O'Hare M.J., Jones L., Streuli C.H., Garrod D.R. Desmosomal adhesion regulates epithelial morphogenesis and cell positioning. Nat Cell Biol. 2001;3:823–830. doi: 10.1038/ncb0901-823. [DOI] [PubMed] [Google Scholar]
- 15.Gudjonsson T., Ronnov-Jessen L., Villadsen R., Rank F., Bissell M.J., Petersen O.W. Normal and tumor-derived myoepithelial cells differ in their ability to interact with luminal breast epithelial cells for polarity and basement membrane deposition. J Cell Sci. 2002;115:39–50. doi: 10.1242/jcs.115.1.39. [DOI] [PMC free article] [PubMed] [Google Scholar]
- 16.Kunz-Schughart L.A., Heyder P., Schroeder J., Knuechel R. A heterologous 3-D coculture model of breast tumor cells and fibroblasts to study tumor-associated fibroblast differentiation. Exp Cell Res. 2001;266:74–86. doi: 10.1006/excr.2001.5210. [DOI] [PubMed] [Google Scholar]
- 17.Fischbach C., Chen R., Matsumoto T., Schmelzle T., Brugge J.S., Polverini P.J., Mooney D.J. Engineering tumors with 3D scaffolds. Nat Methods. 2007;4:855–860. doi: 10.1038/nmeth1085. [DOI] [PubMed] [Google Scholar]
- 18.Okawa T., Michaylira C.Z., Kalabis J., Stairs D.B., Nakagawa H., Andl C.D., Johnstone C.N., Klein-Szanto A.J., El-Deiry W.S., Cukierman E., Herlyn M., Rustgi A.K. The functional interplay between EGFR overexpression, hTERT activation, and p53 mutation in esophageal epithelial cells with activation of stromal fibroblasts induces tumor development, invasion, and differentiation. Genes Dev. 2007;21:2788–2803. doi: 10.1101/gad.1544507. [DOI] [PMC free article] [PubMed] [Google Scholar]
- 19.Takagi A., Watanabe M., Ishii Y., Morita J., Hirokawa Y., Matsuzaki T., Shiraishi T. Three-dimensional cellular spheroid formation provides human prostate tumor cells with tissue-like features. Anticancer Res. 2007;27:45–53. [PubMed] [Google Scholar]
- 20.Wolf K., Wu Y.I., Liu Y., Geiger J., Tam E., Overall C., Stack M.S., Friedl P. Multi-step pericellular proteolysis controls the transition from individual to collective cancer cell invasion. Nat Cell Biol. 2007;9:893–904. doi: 10.1038/ncb1616. [DOI] [PubMed] [Google Scholar]
- 21.Pickl M., Ries C.H. Comparison of 3D and 2D tumor models reveals enhanced HER2 activation in 3D associated with an increased response to trastuzumab. Oncogene. 2009;28:461–468. doi: 10.1038/onc.2008.394. [DOI] [PubMed] [Google Scholar]
- 22.Ronnov-Jessen L., Van Deurs B., Nielsen M., Petersen O.W. Identification, paracrine generation, and possible function of human breast carcinoma myofibroblasts in culture. In Vitro Cell Dev Biol. 1992;28A:273–283. doi: 10.1007/BF02634244. [DOI] [PubMed] [Google Scholar]
- 23.Nielsen H.L., Ronnov-Jessen L., Villadsen R., Petersen O.W. Identification of EPSTI1, a novel gene induced by epithelial-stromal interaction in human breast cancer. Genomics. 2002;79:703–710. doi: 10.1006/geno.2002.6755. [DOI] [PubMed] [Google Scholar]
- 24.Kunz-Schughart L.A., Knuechel R. Tumor-associated fibroblasts (part I): active stromal participants in tumor development and progression. Histol Histopathol. 2002;17:599–621. doi: 10.14670/HH-17.599. [DOI] [PubMed] [Google Scholar]
- 25.Schmeichel K.L., Bissell M.J. Modeling tissue-specific signaling and organ function in three dimensions. J Cell Sci. 2003;116:2377–2388. doi: 10.1242/jcs.00503. [DOI] [PMC free article] [PubMed] [Google Scholar]
- 26.Gaggioli C., Hooper S., Hidalgo-Carcedo C., Grosse R., Marshall J.F., Harrington K., Sahai E. Fibroblast-led collective invasion of carcinoma cells with differing roles for RhoGTPases in leading and following cells. Nat Cell Biol. 2007;9:1392–1400. doi: 10.1038/ncb1658. [DOI] [PubMed] [Google Scholar]
- 27.Janda E., Lehmann K., Killisch I., Jechlinger M., Herzig M., Downward J., Beug H., Grunert S. Ras and TGF[beta] cooperatively regulate epithelial cell plasticity and metastasis: dissection of Ras signaling pathways. J Cell Biol. 2002;156:299–313. doi: 10.1083/jcb.200109037. [DOI] [PMC free article] [PubMed] [Google Scholar]
- 28.Irizarry R.A., Bolstad B.M., Collin F., Cope L.M., Hobbs B., Speed T.P. Summaries of Affymetrix GeneChip probe level data. Nucleic Acids Res. 2003;31:e15. doi: 10.1093/nar/gng015. [DOI] [PMC free article] [PubMed] [Google Scholar]
- 29.Gentleman R.C., Carey V.J., Bates D.M., Bolstad B., Dettling M., Dudoit S., Ellis B., Gautier L., Ge Y., Gentry J., Hornik K., Hothorn T., Huber W., Iacus S., Irizarry R., Leisch F., Li C., Maechler M., Rossini A.J., Sawitzki G., Smith C., Smyth G., Tierney L., Yang J.Y., Zhang J. Bioconductor: open software development for computational biology and bioinformatics. Genome Biol. 2004;5:R80. doi: 10.1186/gb-2004-5-10-r80. [DOI] [PMC free article] [PubMed] [Google Scholar]
- 30.Smyth G.K. Linear models and empirical Bayes methods for assessing differential expression in microarray experiments. Stat Appl Genet Mol Biol. 2004;3 doi: 10.2202/1544-6115.1027. Article3. [DOI] [PubMed] [Google Scholar]
- 31.Benjamini Y., Hochberg Y. Controlling the false discovery rate: a practical and powerful approach to multiple testing. J R Stat Soc Ser B. 2005;57:289–300. [Google Scholar]
- 32.Garin-Chesa P., Old L.J., Rettig W.J. Cell surface glycoprotein of reactive stromal fibroblasts as a potential antibody target in human epithelial cancers. Proc Natl Acad Sci U S A. 1990;87:7235–7239. doi: 10.1073/pnas.87.18.7235. [DOI] [PMC free article] [PubMed] [Google Scholar]
- 33.Korff T., Augustin H.G. Integration of endothelial cells in multicellular spheroids prevents apoptosis and induces differentiation. J Cell Biol. 1998;143:1341–1352. doi: 10.1083/jcb.143.5.1341. [DOI] [PMC free article] [PubMed] [Google Scholar]
- 34.Tomayko M.M., Reynolds C.P. Determination of subcutaneous tumor size in athymic (nude) mice. Cancer Chemother Pharmacol. 1989;24:148–154. doi: 10.1007/BF00300234. [DOI] [PubMed] [Google Scholar]
- 35.Euhus D.M., Hudd C., LaRegina M.C., Johnson F.E. Tumor measurement in the nude mouse. J Surg Oncol. 1986;31:229–234. doi: 10.1002/jso.2930310402. [DOI] [PubMed] [Google Scholar]
- 36.Elsdale T., Bard J. Collagen substrata for studies on cell behavior. J Cell Biol. 1972;54:626–637. doi: 10.1083/jcb.54.3.626. [DOI] [PMC free article] [PubMed] [Google Scholar]
- 37.Knudsen E.S., Wang J.Y. Dual mechanisms for the inhibition of E2F binding to RB by cyclin-dependent kinase-mediated RB phosphorylation. Mol Cell Biol. 1997;17:5771–5783. doi: 10.1128/mcb.17.10.5771. [DOI] [PMC free article] [PubMed] [Google Scholar]
- 38.Yamamoto H., Soh J.W., Monden T., Klein M.G., Zhang L.M., Shirin H., Arber N., Tomita N., Schieren I., Stein C.A., Weinstein I.B. Paradoxical increase in retinoblastoma protein in colorectal carcinomas may protect cells from apoptosis. Clin Cancer Res. 1999;5:1805–1815. [PubMed] [Google Scholar]
- 39.Sutherland R.M., Sordat B., Bamat J., Gabbert H., Bourrat B., Mueller-Klieser W. Oxygenation and differentiation in multicellular spheroids of human colon carcinoma. Cancer Res. 1986;46:5320–5329. [PubMed] [Google Scholar]
- 40.Hlatky L., Hahnfeldt P., Folkman J. Clinical application of antiangiogenic therapy: microvessel density, what it does and doesn't tell us. J Natl Cancer Inst. 2002;94:883–893. doi: 10.1093/jnci/94.12.883. [DOI] [PubMed] [Google Scholar]
- 41.De Wever O., Nguyen Q.D., Van Hoorde L., Bracke M., Bruyneel E., Gespach C., Mareel M. Tenascin-C and SF/HGF produced by myofibroblasts in vitro provide convergent pro-invasive signals to human colon cancer cells through RhoA and Rac. FASEB J. 2004;18:1016–1018. doi: 10.1096/fj.03-1110fje. [DOI] [PubMed] [Google Scholar]
- 42.Kammula U.S., Kuntz E.J., Francone T.D., Zeng Z., Shia J., Landmann R.G., Paty P.B., Weiser M.R. Molecular co-expression of the c-Met oncogene and hepatocyte growth factor in primary colon cancer predicts tumor stage and clinical outcome. Cancer Lett. 2007;248:219–228. doi: 10.1016/j.canlet.2006.07.007. [DOI] [PubMed] [Google Scholar]
- 43.Peschard P., Park M. From Tpr-Met to Met, tumorigenesis and tubes. Oncogene. 2007;26:1276–1285. doi: 10.1038/sj.onc.1210201. [DOI] [PubMed] [Google Scholar]
- 44.Kataoka H., Hamasuna R., Itoh H., Kitamura N., Koono M. Activation of hepatocyte growth factor/scatter factor in colorectal carcinoma. Cancer Res. 2000;60:6148–6159. [PubMed] [Google Scholar]
- 45.Verschueren H., De Baetselier P., Bereiter-Hahn J. Dynamic morphology of metastatic mouse T-lymphoma cells invading through monolayers of 10T1/2 cells. Cell Motil Cytoskeleton. 1991;20:203–214. doi: 10.1002/cm.970200304. [DOI] [PubMed] [Google Scholar]
- 46.Wolf K., Muller R., Borgmann S., Brocker E.B., Friedl P. Amoeboid shape change and contact guidance: t-lymphocyte crawling through fibrillar collagen is independent of matrix remodeling by MMPs and other proteases. Blood. 2003;102:3262–3269. doi: 10.1182/blood-2002-12-3791. [DOI] [PubMed] [Google Scholar]
- 47.Mootha V.K., Lindgren C.M., Eriksson K.F., Subramanian A., Sihag S., Lehar J., Puigserver P., Carlsson E., Ridderstrale M., Laurila E., Houstis N., Daly M.J., Patterson N., Mesirov J.P., Golub T.R., Tamayo P., Spiegelman B., Lander E.S., Hirschhorn J.N., Altshuler D., Groop L.C. PGC-1alpha-responsive genes involved in oxidative phosphorylation are coordinately downregulated in human diabetes. Nat Genet. 2003;34:267–273. doi: 10.1038/ng1180. [DOI] [PubMed] [Google Scholar]
- 48.Subramanian A., Tamayo P., Mootha V.K., Mukherjee S., Ebert B.L., Gillette M.A., Paulovich A., Pomeroy S.L., Golub T.R., Lander E.S., Mesirov J.P. Gene set enrichment analysis: a knowledge-based approach for interpreting genome-wide expression profiles. Proc Natl Acad Sci U S A. 2005;102:15545–15550. doi: 10.1073/pnas.0506580102. [DOI] [PMC free article] [PubMed] [Google Scholar]
- 49.Mense S.M., Sengupta A., Zhou M., Lan C., Bentsman G., Volsky D.J., Zhang L. Gene expression profiling reveals the profound upregulation of hypoxia-response genes in primary human astrocytes. Physiol Genomics. 2006;16:435–439. doi: 10.1152/physiolgenomics.00315.2005. [DOI] [PubMed] [Google Scholar]
- 50.Bild A.H., Yao G., Chang J.T., Wang Q., Potti A., Chasse D., Joshi M.B., Harpole D., Lancaster J.M., Berchuck A., Olsen J.A., Jr., Marks J.R., Dressman H.K., West M., Nevins J.R. Oncogenic pathway signatures in human cancers as a guide to targeted therapies. Nature. 2006;439:353–357. doi: 10.1038/nature04296. [DOI] [PubMed] [Google Scholar]
- 51.Chen H., Rubin E., Zhang H., Chung S., Jie C.C., Garrett E., Biswal S., Sukumar S. Identification of transcriptional targets of HOXA5. J Biol Chem. 2005;280:19373–19380. doi: 10.1074/jbc.M413528200. [DOI] [PubMed] [Google Scholar]
- 52.Hinta K., Gervin A.M., Jennifer Zhang Y., Khavari P.A. Divergent gene regulation and growth effects by NK-kappa B in epithelial and mesenchyman cells of human skin. Oncogene. 2003;22:1955–1964. doi: 10.1038/sj.onc.1206198. [DOI] [PubMed] [Google Scholar]
- 53.Manalo D.J., Rowan A., Lavoie T., Natarajan L., Kelly B.D., Ye S.Q., Garcia J.G., Semenza G.L. Transcriptional regulation of vascular endothelial cell responses to hypoxia by HIF-1. Blood. 2005;105:659–669. doi: 10.1182/blood-2004-07-2958. [DOI] [PubMed] [Google Scholar]
- 54.Lee J.S., Chu I.S., Mikaelyan A., Calvisi D.F., Heo J., Reddy J.K., Thorgeirsson S.S. Application of comparative functional genomics to identify best-fit mouse models to study human cancer. Nat Genet. 2004;36:1306–1311. doi: 10.1038/ng1481. [DOI] [PubMed] [Google Scholar]
- 55.Jechlinger M., Grunert S., Tamir I.H., Janda E., Lüdemann S., Waerner T., Seither P., Weith A., Beug H., Kraut N. Oncogene. 2003;22:7155–7169. doi: 10.1038/sj.onc.1206887. [DOI] [PubMed] [Google Scholar]
- 56.McLachlan J.L., Smith A.J., Bukalska I.J., Cooper P.R. Gene expression profiling of pulpal tissue reveals the molecular complexity of dental caries. Biochim Biophys Acta. 2005;1741:271–281. doi: 10.1016/j.bbadis.2005.03.007. [DOI] [PubMed] [Google Scholar]
- 57.Harris A.L. Hypoxia-a key regulatory factor in tumour growth. Nat Rev Cancer. 2002;2:38–47. doi: 10.1038/nrc704. [DOI] [PubMed] [Google Scholar]
- 58.Gery S., Gombart A.F., Yi W.S., Koeffler C., Hofmann W.K., Koeffler H.P. Transcription profiling of C/EBP targets identifies Per2 as a gene implicated in myeloid leukemia. Blood. 2005;106:2827–2836. doi: 10.1182/blood-2005-01-0358. [DOI] [PMC free article] [PubMed] [Google Scholar]
- 59.Dorsey J.F., Cunnick J.M., Mane S.M., Wu J. Regulation of the Erk2-Elk1 signaling pathway and megakaryocytic differentiation of Bcr-Abl(+) K562 leukemic cells by Gab2. Blood. 2002;99:1388–1397. doi: 10.1182/blood.v99.4.1388. [DOI] [PubMed] [Google Scholar]
- 60.Kim H., Lee D.K., Choi J.W., Kim J.S., Park S.C., Youn H.D. Analysis of the effect of aging on the response to hypoxia by cDNA microarray. Mech Ageing Dev. 2003;124:941–949. doi: 10.1016/s0047-6374(03)00166-0. [DOI] [PubMed] [Google Scholar]
- 61.Tseng Y.H., Butte A.J., Kokkotou E., Yechoor V.K., Taniguchi C.M., Kriauciunas K.M., Cypess A.M., Niinobe M., Yoshikawa K., Patti M.E., Kahn C.R. Prediction of preadipocyte differentiation by gene expression reveals role of insulin receptor substrates and necdin. Nat Cell Biol. 2005;7:601–611. doi: 10.1038/ncb1259. [DOI] [PubMed] [Google Scholar]
- 62.Nakamori S., Ota D.M., Cleary K.R., Shirotani K., Irimura T. MUC1 mucin expression as a marker of progression and metastasis of human colorectal carcinoma. Gastroenterology. 1994;106:353–361. doi: 10.1016/0016-5085(94)90592-4. [DOI] [PubMed] [Google Scholar]
- 63.Sylvester P.A., Myerscough N., Warren B.F., Carlstedt I., Corfield A.P., Durdey P., Thomas M.G. Differential expression of the chromosome 11 mucin genes in colorectal cancer. J Pathol. 2001;195:327–335. doi: 10.1002/path.951. [DOI] [PubMed] [Google Scholar]
- 64.Ogata S., Uehara H., Chen A., Itzkowitz S.H. Mucin gene expression in colonic tissues and cell lines. Cancer Res. 1992;52:5971–5978. [PubMed] [Google Scholar]
- 65.Mollenhauer J., Herbertz S., Helmke B., Kollender G., Krebs I., Madsen J., Holmskov U., Sorger K., Schmitt L., Wiemann S., Otto H.F., Grone H.J., Poustka A. Deleted in Malignant Brain Tumors 1 is a versatile mucin-like molecule likely to play a differential role in digestive tract cancer. Cancer Res. 2001;61:8880–8886. [PubMed] [Google Scholar]
- 66.Conde A.R., Martins A.P., Brito M., Manuel A., Ramos S., Malta-Vacas J., Renner M., Poustka A., Mollenhauer J., Monteiro C. DMBT1 is frequently downregulated in well-differentiated gastric carcinoma but more frequently upregulated across various gastric cancer types. Int J Oncol. 2007;30:1441–1446. [PubMed] [Google Scholar]
- 67.Rosenstiel P., Sina C., End C., Renner M., Lyer S., Till A., Hellmig S., Nikolaus S., Folsch U.R., Helmke B., Autschbach F., Schirmacher P., Kioschis P., Hafner M., Poustka A., Mollenhauer J., Schreiber S. Regulation of DMBT1 via NOD2 and TLR4 in intestinal epithelial cells modulates bacterial recognition and invasion. J Immunol. 2007;178:8203–8211. doi: 10.4049/jimmunol.178.12.8203. [DOI] [PubMed] [Google Scholar]
- 68.Witz I.P. Yin-yang activities and vicious cycles in the tumor microenvironment. Cancer Res. 2008;68:9–13. doi: 10.1158/0008-5472.CAN-07-2917. [DOI] [PubMed] [Google Scholar]
- 69.Yamada K.M., Cukierman E. Modeling tissue morphogenesis and cancer in 3D. Cell. 2007;130:601–610. doi: 10.1016/j.cell.2007.08.006. [DOI] [PubMed] [Google Scholar]
- 70.Ronnov-Jessen L., Petersen O.W., Koteliansky V.E., Bissell M.J. The origin of the myofibroblasts in breast cancer: Recapitulation of tumor environment in culture unravels diversity and implicates converted fibroblasts and recruited smooth muscle cells. J Clin Invest. 1995;95:859–873. doi: 10.1172/JCI117736. [DOI] [PMC free article] [PubMed] [Google Scholar]
- 71.Froeling F.E., Mirza T.A., Feakins R.M., Seedhar A., Elia G., Hart I.R., Kocher H.M. Organotypic culture model of pancreatic cancer demonstrates that stromal cells modulate E-cadherin, beta-catenin, and Ezrin expression in tumor cells. Am J Pathol. 2009;175:636–648. doi: 10.2353/ajpath.2009.090131. [DOI] [PMC free article] [PubMed] [Google Scholar]
- 72.Gudjonsson T., Ronnov-Jessen L., Villadsen R., Bissell M.J., Petersen O.W. To create the correct microenvironment: three-dimensional heterotypic collagen assays for human breast epithelial morphogenesis and neoplasia. Methods. 2003;30:247–255. doi: 10.1016/s1046-2023(03)00031-8. [DOI] [PMC free article] [PubMed] [Google Scholar]
- 73.Friedl P., Gilmour D. Collective cell migration in morphogenesis, regeneration and cancer. Nat Rev Mol Cell Biol. 2009;10:445–457. doi: 10.1038/nrm2720. [DOI] [PubMed] [Google Scholar]
- 74.Vescio R.A., Redfern C.H., Nelson T.J., Ugoretz S., Stern P.H., Hoffman R.M. In vivo-like drug responses of human tumors growing in three-dimensional gel-supported primary culture. Proc Natl Acad Sci U S A. 1987;84:5029–5033. doi: 10.1073/pnas.84.14.5029. [DOI] [PMC free article] [PubMed] [Google Scholar]
- 75.Desoize B., Jardillier J. Multicellular resistance: a paradigm for clinical resistance? Crit Rev Oncol Hematol. 2000;36:193–207. doi: 10.1016/s1040-8428(00)00086-x. [DOI] [PubMed] [Google Scholar]
- 76.Muerkoster S., Wegehenkel K., Arlt A., Witt M., Sipos B., Kruse M.L., Sebens T., Kloppel G., Kalthoff H., Folsch U.R., Schafer H. Tumor stroma interactions induce chemoresistance in pancreatic ductal carcinoma cells involving increased secretion and paracrine effects of nitric oxide and interleukin-1beta. Cancer Res. 2004;64:1331–1337. doi: 10.1158/0008-5472.can-03-1860. [DOI] [PubMed] [Google Scholar]
- 77.Shekhar M.P., Santner S., Carolin K.A., Tait L. Direct involvement of breast tumor fibroblasts in the modulation of tamoxifen sensitivity. Am J Pathol. 2007;170:1546–1560. doi: 10.2353/ajpath.2007.061004. [DOI] [PMC free article] [PubMed] [Google Scholar]
- 78.Karin M. Nuclear factor-kappaB in cancer development and progression. Nature. 2006;441:431–436. doi: 10.1038/nature04870. [DOI] [PubMed] [Google Scholar]
- 79.Matsuo Y., Ochi N., Sawai H., Yasuda A., Takahashi H., Funahashi H., Takeyama H., Tong Z., Guha S. CXCL8/IL-8 and CXCL12/SDF-1alpha co-operatively promote invasiveness and angiogenesis in pancreatic cancer. Int J Cancer. 2009;124:853–861. doi: 10.1002/ijc.24040. [DOI] [PMC free article] [PubMed] [Google Scholar]
- 80.Martin D., Galisteo R., Gutkind J.S. CXCL8/IL8 stimulates vascular endothelial growth factor (VEGF) expression and the autocrine activation of VEGFR2 in endothelial cells by activating NFkappaB through the CBM (Carma3/Bcl10/Malt1) complex. J Biol Chem. 2009;284:6038–6042. doi: 10.1074/jbc.C800207200. [DOI] [PMC free article] [PubMed] [Google Scholar]
- 81.Huang S., Mills L., Mian B., Tellez C., McCarty M., Yang X.D., Gudas J.M., Bar-Eli M. Fully humanized neutralizing antibodies to interleukin-8 (ABX-IL8) inhibit angiogenesis, tumor growth, and metastasis of human melanoma. Am J Pathol. 2002;161:125–134. doi: 10.1016/S0002-9440(10)64164-8. [DOI] [PMC free article] [PubMed] [Google Scholar]
- 82.Mollenhauer J., Helmke B., Muller H., Kollender G., Krebs I., Wiemann S., Holmskov U., Madsen J., Otto H.F., Poustka A. An integrative model on the role of DMBT1 in epithelial cancer. Cancer Detect Prev. 2002;26:266–274. doi: 10.1016/s0361-090x(02)00094-6. [DOI] [PubMed] [Google Scholar]
- 83.Huber M.A., Azoitei N., Baumann B., Grunert S., Sommer A., Pehamberger H., Kraut N., Beug H., Wirth T. NF-kappaB is essential for epithelial-mesenchymal transition and metastasis in a model of breast cancer progression. J Clin Invest. 2004;114:569–581. doi: 10.1172/JCI21358. [DOI] [PMC free article] [PubMed] [Google Scholar]
- 84.Rupp C., Dolznig H., Puri C., Schweifer N., Sommergruber W., Kraut N., Rettig W.J., Kerjaschki D., Garin-Chesa P. Laser capture microdissection of epithelial cancers guided by antibodies against fibroblast activation protein and endosialin. Diagn Mol Pathol. 2006;15:35–42. doi: 10.1097/00019606-200603000-00006. [DOI] [PubMed] [Google Scholar]
- 85.Rosner M., Siegel N., Fuchs C., Slabina N., Dolznig H., Hengstschlager M. Efficient siRNA-mediated prolonged gene silencing in human amniotic fluid stem cells. Nat Protoc. 2010;5:1081–1095. doi: 10.1038/nprot.2010.74. [DOI] [PubMed] [Google Scholar]
Associated Data
This section collects any data citations, data availability statements, or supplementary materials included in this article.
Supplementary Materials
Collagen gel assays. Spheroids of different tumor cell lines were grown for 3 to 7 days in collagen I gels and photographed. Some cell lines showed strong invasive capacity (SK-OV3, Colo699, KNS5, H446), whereas others remained compact with sharp borders (A549, MCF7, BT474, HT29).
A: Phenotypic characterization of freshly isolated CAFs. CAFs from two different colon carcinoma specimens at low passage numbers (p2-p3) were analyzed for the presence of the mesenchymal marker vimentin, smooth muscle actin (SMA), and the absence of the epithelial cytokeratin 8 (CK8) by immunofluorescence staining. hTERT immortalized BJ-1 SFs are shown as control fibroblasts. B: DNA content and EdU incorporation as determined by flow cytometry revealed similar proliferation rates in the different fibroblasts.
Expression profiling characterization of fibroblasts. Affymetrix GeneChip analysis revealed that the expression of the fibroblast markers fibroblast activation protein α (FAP), vimentin (VIM), THY1, PDGFRα and β, and smooth muscle actin (SMA) (ACTA2) were high in CAF1 (passage number 3) and CCD18-Co NCFs. The fibroblasts were negative for epithelial markers as demonstrated by very low expression of cytokeratin 18 (KRT18) and E-cadherin (CDH1). The expression of blood endothelial markers CD31 (PECAM1), EndoGlyx (MMRN2), VE-cadherin (CDH5), the lymph endothelial marker PROX1, and the pericyte marker NG-2 (CSPG4) was also barely detectable. LS174T epithelial tumor cells and blood endothelial cells (EC) are shown as control. Results are from biological triplicates. The bold centerline indicates the median; the box represents the interquartile range (IQR). Whiskers extend to 1.5 times the IQR.
Cell death in the spheroid core. When HCT116 tumor cell spheroids reached a diameter of approximately 500 μm, cell death occurred in the center of the 3D structures as indicated by the uptake of propidium iodide (PI, red) in living cultures (left). Morphologic examination (H&E) revealed loss of cell-cell contacts in the center of the spheroids accompanied by reduction of phospho-Akt in that central area. Scale bar = 100 μm.
Tumor cell motility. DsRed-labeled LS174T spheroids were co-cultured with colonic fibroblasts and followed by time lapse videomicroscopy for 11 hours. White arrows indicate the track of a single tumor cell (red); the position of the cell was determined every hour (circles).
Illustration of the workflow to obtain a mixture of RNA from tumor cell spheroids (blue cell cluster) and fibroblast (elongated cells in magenta) monocultures and RNA from co-cultures. A defined number of tumor cell spheroids grown for 2 days (96 spheroids initially seeded with 150 LS174T cells) and exactly determined cell numbers of the different fibroblasts (2 × 10⁵) were used. The whole lysates from LS174T monocultures were mixed with fibroblast monoculture lysates (lysates, monoculture mix), thereby ensuring the same amount of tumor and fibroblast components present as in the co-culture experiments (lysates, co-culture). RNA extracted from the mixed monoculture and from the co-culture experiments was processed for Affymetrix GeneChip analysis.
A: Number of regulated genes in co-cultivation experiments compared with mixed monoculture experiments. Genes with a fold change >1.5 and adjusted FDR P values of <0.01 were defined as significantly regulated. Left: Co-cultivation of LS174T spheroids with colon fibroblasts (NF, CAF1, CAF2 + LS174T); numbers of up-regulated genes are shown in red, down-regulated genes are displayed in green. Right: Number of genes specifically regulated by the co-culture of CAFs with tumor cells (CAF1, CAF2 + LS174T). Red: Up-regulated, green: down-regulated. B: Co-culture of LS174T spheroids with CAFs changed cell-cell communication pathways. GSEA identified cell-cell signaling as defined in GO terms. In this set, PCA separated the individual mixed monocultures (blue) from the corresponding co-cultures (red).
Mucin expression in LS174T-fibroblast co-cultures (C) versus monoculture mix (M). Whisker box plots displaying the expression profile of MUC1, MUC2, MUC5AC, MUC5B, and MUC17 (yellow: mixed individual cultures; blue: co-cultures). Results are from biological triplicates after 3.5 days of co-co-cultures or mixed monocultures. The bold centerline indicates the median; the box represents the interquartile range (IQR). Whiskers extend to 1.5 times the IQR.
DMBT1 expression in major human tumors and their normal tissue counterparts in large expression databases (BioExpress, GeneLogic, Affymetrix Human Genome U133 Plus 2.0 GeneChip based database). A:DMBT1 mRNA was expressed in normal colon and increased in colon carcinomas, whereas normal lung was positive for DMBT1 and DMBT1 decreased in lung tumors. B:DMBT1 RNA was significantly increased in mucinous colon carcinomas, esophagus carcinomas, and stomach and pancreas carcinomas. Red: cancer samples; green: normal tissue samples. The bold centerline indicates the median; the box represents the interquartile range (IQR). Whiskers extend to 1.5 times the IQR. Outliers are shown as small circles.
PI3K inhibitor (LY294002) treatment of LS174T colon fibroblast 3D co-cultures. Sections from DMSO control and LY294002 treated co-cultures were stained for cleaved caspase 3 (top) as a marker for apoptotic cells. The number of cleaved caspase 3–positive tumor cells was increased compared with the control. Fibroblast were not affected. Cell proliferation was assessed by the mitosis marker phospho-histone H3 (bottom). LY294002-treated cultures showed reduced numbers of phospho-histone H3–positive tumor cells compared with the DMSO controls. Fibroblasts did not show phospho-histone H3 staining under both conditions.