

Abstract
As the major component of membrane proteins, transmembrane helices embedded in anisotropic bilayer environments adopt preferential orientations that are characteristic or related to their functional states. Recent developments in solid-state nuclear magnetic resonance (SSNMR) spectroscopy have made it possible to measure NMR observables that can be used to determine such orientations in a native bilayer environment. A quasistatic single conformer model is frequently used to interpret the SSNMR observables, but important motional information can be missing or misinterpreted in the model. In this work, we have investigated the orientation of the single-pass transmembrane domain of viral protein ”u“ (VpuTM) from HIV-1 by determining an ensemble of structures using multiple conformer models based on the SSNMR ensemble dynamics technique. The resulting structure ensemble shows significantly larger orientational fluctuations while the ensemble-averaged orientation is compatible with the orientation based on the quasistatic model. This observation is further corroborated by comparison with the VpuTM orientation from comparative molecular dynamics simulations in explicit bilayer membranes. SSNMR ensemble dynamics not only reveals the importance of transmembrane helix dynamics in interpretation of SSNMR observables, but also provides a means to simultaneously extract both transmembrane helix orientation and dynamics information from the SSNMR measurements.
Introduction
As the major component of membrane proteins, transmembrane (TM) helices embedded in anisotropic bilayer environments adopt preferential orientations that are characteristic or related to their functional states. Recent developments in solid-state nuclear magnetic resonance (SSNMR) spectroscopy, particularly selective isotopic labeling technique and novel pulse sequences, have made it possible to collect high-resolution NMR spectra from an aligned sample (1–3). Polarization inversion spin-exchange at the magic-angle (PISEMA) experiment allows simultaneous measurement of pairwise 15N chemical shift anisotropy (CSA) and 1H-15N dipolar coupling (DC) of isotopically labeled amide backbone of proteins (4). The two-dimensional display of PISEMA spectrum shows a characteristic pattern, so-called polar index slant angle wheels, which can be used to identify the helical segment and to determine the orientation of the helix, i.e., each helix's tilt angle with respect to the membrane-normal and rotation angle around the helical axis (5).
The most popular computational technique for determining the TM helix orientation from PISEMA measurement is a geometric search approach or its variations (5–7). In this approach, experimentally derived structures are determined by searching a particular orientation (tilt and rotation) of an ideal, rigid helix that minimizes the root mean-square deviation (RMSD) between the calculated and the experimental CSA and DC. The motional averaging is implicitly accounted by scaling the observables using generalized order parameters, which makes the model quasistatic (5–7). This approach is relatively straightforward, and one can quickly find a particular helix orientation that satisfies the experimental observables. The extent of TM helix orientation's variability is generally defined by the orientational space that yields the RMSD below the experimental error, e.g., <10 ppm for CSA and 1 kHz for DC (1–3). The resulting structures generally suggest that the TM helices have very limited orientational freedom, e.g., ±1° in terms of the helix tilt angle (1–3).
However, increasing evidence from experiment and computer simulation indicates that orientational fluctuations of TM helices in membranes are substantially larger (8–11). Recently, several flexible fitting models have been proposed to include TM peptide dynamics in the structure determination (12–14). In these methods, the peptide dynamics is represented by additional fitting parameters with a Gaussian or uniform distribution. Although more complex fitting parameters could be included to capture peptide motions other than the whole body motion (e.g., such as kink or peptide bond librations), addition of such fitting parameters could be arbitrary and may not provide realistic dynamic information and orientational variability because TM helix orientations may deviate from a normal distribution.
This study aims to simultaneously extract both TM helix orientation and intrinsic dynamics information that are embedded in the SSNMR observables by combining molecular dynamics (MD) simulation and explicit SSNMR measurements. For this aim, we have developed a SSNMR ensemble dynamics (SSNMR-ED) technique. In SSNMR-ED, an ensemble of structures (i.e., replicas) is simulated in parallel, and ensemble-averaged CSA and DC across the replicas rather than a single individual structure are restrained to the experimental values. This approach is valid because, like the other NMR observables, CSA and DC measured in PISEMA experiment are time- and ensemble-averaged properties. In addition, SSNMR-ED is advantageous because of its ability to generate an ensemble of structures (i.e., TM helix orientation distribution) that satisfies the experimental observables without additional fitting parameters. Similar techniques have been used in solution NMR structure determination (15,16) as well as in x-ray structure refinement (17).
To illustrate the efficacy of SSNMR-ED, we have determined the orientation and dynamics of viral protein “u” TM domain (VpuTM), whose high-quality SSNMR data are available (3). The ensemble structures determined by the SSNMR-ED simulation show better agreement with experimental NMR observables while the orientational freedom is greatly increased. We have used cross-validation technique to validate that the increased agreement with experimental observables is not due to an reduced data/parameter ratio. This observation is further corroborated by comparison with the Vpu orientation from a total of 1.5 μs comparative (unrestrained) MD simulations in explicit bilayer membranes. The extension and application of the current SSNMR-ED technique to deuterium quadrupolar splitting (18), another type of SSNMR observable, are also briefly discussed.
Materials and Methods
Definition of tilt and rotation angles
The TM helix orientation is defined by its tilt (τ) and rotation (ρ) angles (Fig. 1) following the convention described in Lee and Im (19). In brief, τ is defined by the angle between the helical principal axis (a) and the unit vector along the Z axis, which is parallel to the membrane-normal in this work. The value ρ is defined by the angle between the projections of the Z axis (Zp) and the internal reference vector (rs) on the plane perpendicular to the helical axis. The internal reference vector is defined by the shortest vector from the helical axis to a reference atom. In this work, the helical axis was defined by the Cα atoms of residues 7–25 of VpuTM, and the Cα atom of Ile8 was used for the reference atom. To compare the rotation angle with the previous study (due to a different definition of ρ), 180° was added to ρ.
Figure 1.
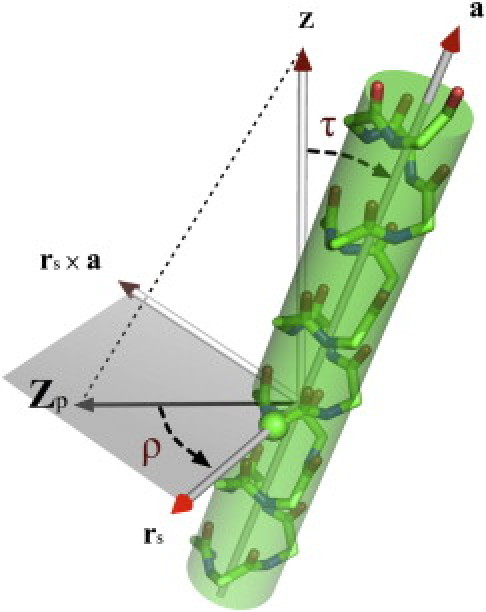
Definition of tilt (τ) and rotation (ρ) angle of a TM helix. The value τ is defined by the angle between the helical principal axis (a) and the unit vector along the Z axis. The value ρ is defined by the angle between the projections of the Z axis (Zp) and the internal reference vector (rs) on the plane perpendicular to the helical principal axis. (Green sphere) Internal reference atom.
SSNMR ensemble dynamics
The ensemble dynamics simulation is designed to perform the parallel MD simulation with a certain number of replicas (NREP) using a set of biased potentials (Uχ) that restrain the ensemble-averaged property (〈χcalc〉ens) to the experimental target value (χexp),
| (1) |
where Nχ is the number of target experimental observables and kχ is the force constant. In this work, the target data are the experimental 15N CSA (χ = σ) and 1H-15N DC (χ = ν), so that we have developed the ensemble CSA and DC restraint potentials based on the single-conformer CSA and DC restraint potentials that Lee et al. (20) previously developed.
First, based on the rigid tensor approximation (21,22), the ensemble-averaged 15N CSA is calculated by (for simplicity, we dropped the index i for ith observable in Eq. 1)
| (2) |
where σnn and (n = 1, 2, 3) are the instantaneous magnitude and unit vector Z-component of chemical shift tensors. According to the rigid tensor approximation, is defined by the cross product of rNC and rNH. Then, is defined by a rotation angle ϕ from rNH on the peptide plane defined by N, C, and H atoms. Finally, is defined by the cross product of and . In this work, 64, 77, and 222 ppm were used for σ11, σ22, and σ33, respectively, and 108.5° was used for ϕ (3).
Second, the ensemble-averaged 1H-15N DC is calculated by
| (3) |
where ν0, the dipolar coupling constant, was set to 21.016 kHz, and θ is the angle between the 15N–1H vector and the external magnetic field (i.e., the Z axis). The total potential energy (UTOTAL) of the ensemble system is then expressed as
| (4) |
where UCHARMM is the standard CHARMM potential energy (23) of the ensemble structure. We have checked the numerical accuracy of the CSA and DC ensemble restraint potentials; the total energy of all the replicas (not the total energy of each replica) was well converged during the NVE dynamics.
The initial structure of VpuTM was built in an ideal α-helical geometry (ϕ = −57.8°/ψ = −47°) with the amino-acid sequence (QPIQ IAIVA LVVAI IIAIV VWSIV IIEGR GGKKKK), which corresponds to residues 2–30 of wild-type Vpu and the polylysine tag (GGKKKK) at the C-terminal end; the lysine tag was used in PISEMA experiment to increase solubility (3). There was no bias potential imposed to maintain the ideal helix conformation during the SSNMR-ED simulation, although the helical conformation was maintained throughout the simulation. The center of the TM region (residues 7–25) of VpuTM was placed at the center of the GBSW implicit membrane bilayer (24). The hydrophobic thickness of implicit membrane was set to 28 Å for 18:1-O-DOPC/DOPG, 25 Å for 14:0-O-DMPC/DMPG, and 21 Å for 12:0-O-DLPC/DLPG bilayer with an additional 5 Å hydrophobic/solvent interfacial switching region in each side of the hydrophobic core.
Starting from a random initial orientation, VpuTM structure determination was performed by carrying out 11 cycles of torsion angle molecular dynamics (25). Each cycle consisted of 100-ps SSNMR-ED simulation with a time step of 1 fs, and the force constant for each restraint potential was doubled each cycle, so that the final values, kσ = 0.01 kcal/(mol·ppm2) and kν = 1.0 kcal/(mol·kHz2), were used at the beginning of the final cycle. Trajectories from the last cycle were subjected to analysis. To increase the sampling statistics, we repeated the torsion angle molecular dynamics simulation 256 times with different initial orientation and velocity for NREP = 1, 2, 4, 8, 16, and 32. The experimental CSA and DC values were obtained from Park and Opella (3). Cross-validation was done by setting either kσ or kν to zero.
To validate the quality of the structure ensemble determined by the SSNMR-ED simulation, we calculated the RMSD between the ensemble-averaged NMR properties (〈χcalc〉) and experimental data (χexp),
| (5) |
where χ = σ (CSA) or ν (DC).
Standard molecular dynamics simulation
The initial structure of VpuTM was built as an ideal α-helical conformation (ϕ = −57.8°/ψ = −47°) with the residues 2–30 of wild-type Vpu (excluding the lysine tag). The center of the TM region (residues 7–25) with τ = 0° was placed at the bilayer center (Z = 0) at the beginning of the simulation. The Membrane Builder (26,27) in CHARMM-GUI (http://www.charmm-gui.org) (28) was used to build three different lipid bilayer systems that were composed of 9:1 mixture of DOPC/DOPG, DMPC/DMPG, and DLPC/DLPG to mimic the experimental condition. The initial system size and the number of each component are given in Table S1 in the Supporting Material. Each system was replicated and assigned with different initial velocity to make five independent simulation systems for each lipid bilayer.
All simulations were performed in the NPγT (γ = 10 dyne/cm) ensemble (29,30) at 303.15 K using the CHARMM biomolecular simulation program (23) with the all-atom parameter set PARAM22 for protein (31) including the dihedral cross-term correction (CMAP) (32) as well as C27r lipid parameters (33,34). The 10 dyn/cm surface tension was applied to avoid the well-known freezing of lipid tails in this CHARMM lipid force field (29,30), and it was shown that such surface tension values do not perturb the TM peptide orientation (36) (note that this work was initiated much earlier than the release of the new C36 lipid force field (37) that allows NPT simulations without chain freezing). A time step of 2 fs was used with the SHAKE algorithm (38).
For each system, we first equilibrated the initial system with 50-ps NPAT (constant area) dynamics followed by 325-ps NPγT dynamics with the nonbonded and dynamics options in the Membrane Builder inputs; the van der Waals interactions were smoothly switched off at 10–12 Å by a force-switching function (39) and the electrostatic interactions were calculated using the particle-mesh Ewald method with a mesh size of ∼1 Å for fast Fourier transformation, κ = 0.34 Å−1, and a sixth-order B-spline interpolation (40). After equilibration, 100-ns production was performed for each of five independent systems in three different lipid bilayers, and the last 50-ns trajectories were used for analysis. Fig. 2 shows a final snapshot of each lipid bilayer system.
Figure 2.
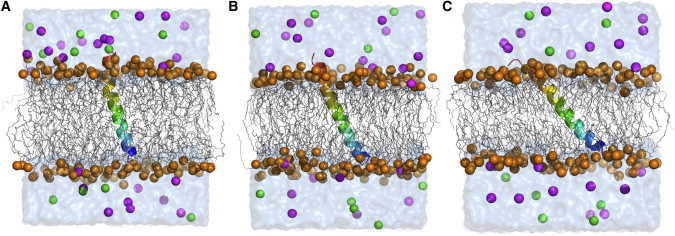
Molecular representation of VpuTM simulation systems in (A) DOPC, (B) DMPC, and (C) DLPC bilayers. (Rainbow) VpuTM. (Blue) N-terminal. (Orange spheres) Phosphate atoms of lipid molecules. (Gray lines) Other parts of the lipids. Water in surface representation: (Magenta) K+; (green) Cl−. The figures were produced with PyMOL.
Results and Discussion
Orientation distribution of ensemble structures
Vpu is a small membrane protein encoded in the HIV-1 virus. The native protein is composed of the hydrophobic TM and amphipathic C-terminal domains. Park and Opella (3) have measured CSA and DC of the TM domain (VpuTM) in three different lipid environments, and showed that the TM helix tilt angle (τ) increases as the bilayer thickness decreases: 18° in 18:1-O-DOPC/DOPG (9:1 mixture), 27° in 14:0-O-DMPC/DMPG (9:1 mixture), and 35° in 12:0-O-DLPC/DLPG (9:1 mixture) (hereafter, for simplicity, 18:1-O-DOPC/DOPG, 14:0-O-DMPC/DMPG, and 12:0-O-DLPC/DLPG are referred to as DOPC, DMPC, and DLPC, respectively).
We have performed the SSNMR-ED simulation to determine an ensemble of VpuTM orientation using SSNMR observables from DOPC, DMPC, and DLPC bilayer environments. The influence of the bilayer environment was taken into account using the GBSW implicit membrane bilayer (24) (see Materials and Methods). For each set of NMR observables, we have used different number of replicas (i.e., NREP= 1, 2, 4, 8, 16, and 32) and carried out 256 independent simulations with different initial velocity assignments and randomly assigned initial orientations. When a single replica is used in the SSNMR-ED simulation, it becomes essentially the same as the conventional (rigid-body geometric search) structure determination protocol (20).
The quality of the determined structures is often assessed by the difference between the experimental observables and the calculated ones. Fig. 3, A and B, shows the RMSD of CSA and DC of the structure ensembles determined by the SSNMNR-ED simulation in a DMPC bilayer environment (see Fig. S1 in the Supporting Material for the DLPC and DOPC cases). Regardless of NREP, the RMSD of CSA and DC are well below the acceptable range (i.e., <10 ppm for CSA and 1 kHz for DC), indicating that the generated structure ensemble agrees well with the SSNMR experimental observables. Interestingly, as NREP increases, the RMSD of CSA and DC decreases, suggesting that the resulting structure ensembles with more replicas better represent the experimental observables.
Figure 3.
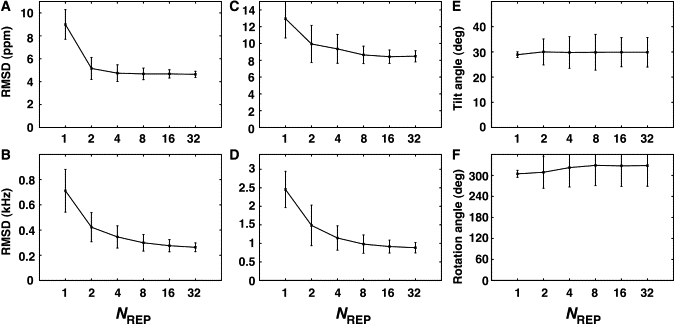
Validation of VpuTM structure ensemble determined by SSNMR-ED in a DMPC bilayer environment. (A and B) CSA and DC RMSD with respect to the experimental observables as a function of the number of replicas. (C and D) CSA and DC RMSD from cross-validation SSNMR-ED in which either the CSA or DC restraint was excluded. (E and F) The τ- and ρ-values of VpuTM.
To validate that such observations are not the consequence of reduction in the data/parameter ratio, we performed cross-validation, which is an unbiased measure of fit (41). For cross-validation, 128 independent SSNMR-ED simulations without either CSA or DC restraint set were performed, and RMSD of NMR observables that are not incorporated in SSNMR-ED were calculated. For example, the CSA RMSD is calculated from a structure ensemble determined by SSNMR-ED only using the DC restraint set, and vice versa. As shown in Fig. 3, C and D, unbiased CSA and DC RMSD becomes lower when more replicas are used, supporting the idea that using more number of replicas indeed generates structure ensembles that are more representative than the conventional structure determination method with single conformer. This cross-validation result also demonstrates that the better agreement is not because of imposing unphysical bias to the structure.
Although the RMSD indicates good agreement with experimental data, the calculated ensemble structures show striking differences in terms of orientational variability when NREP > 1. Fig. 3, E and F, shows the τ and ρ of the ensemble structures (see Materials and Methods for τ- and ρ-definitions in Fig. 1). When NREP = 1, the average τ and ρ are 29 ± 1° and 309 ± 9°, respectively. These values agree well with the results from the rigid-body geometric search method (τ = 27° and ρ = 345°) (3), considering the fact that conformational flexibility is included in our calculations even with NREP = 1. When NREP > 1, the ensemble-averaged τ and ρ remain similar values, but the τ- and ρ-variations are increased to ∼8–9° and 50° in terms of standard deviation.
Such increase in orientational variability is observed in other structure ensembles that we determined using the NMR observables from different lipid bilayer systems. Fig. 4 shows the τ and ρ of VpuTM determined by SSNMR-ED in different bilayer environments including DLPC and DOPC. Clearly, in accordance with the hydrophobic mismatch concept (7,42,43), VpuTM's τ-value increases as the bilayer hydrophobic thickness decreases in order to maximize the match between the TM helix's hydrophobic length and the bilayer hydrophobic thickness. Similar to the DMPC case, regardless of NREP, the ensemble-averaged τ and ρ in DLPC and DOPC match well with the values derived from the rigid-body geometric search method (3), but the variations in τ and ρ increase significantly when NREP > 1.
Figure 4.
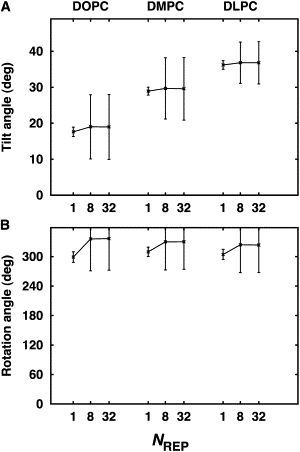
VpuTM orientation determined by SSNMR-ED in DOPC, DMPC, and DLPC bilayers. The average τ-values from the SSNMR-ED are 17.7 ± 1.3° (DOPC), 28.9 ± 1.1° (DMPC), and 36.2 ± 1.2° (DLPC), and the average ρ-values from the SSNMR-ED are 299 ± 10° (DOPC), 309 ± 10° (DMPC), and 304 ± 10° (DLPC) when NREP = 1. The average τ-values from SSNMR-ED are 18.9 ± 9.0° (DOPC), 29.5 ± 8.7° (DMPC), and 36.8 ± 5.8° (DLPC), and the average ρ-values from SSNMR-ED are 336 ± 64° (DOPC), 330 ± 55° (DMPC), and 323 ± 56° (DLPC) when NREP = 8.
Fig. 5 shows the τ- and ρ-distributions of VpuTM structure ensembles determined by SSNMR-ED in DMPC (see Fig. S2 for the DLPC and DOPC cases). When NREP = 1, the structure ensemble adopts a unimodal distribution around the orientation that gives rise to the minimum RMSD of SSNMR properties, which is very similar to the ones from the geometric search (3). When NREP > 1, however, the distribution becomes more complex. When NREP = 2, there are two major clusters of preferred orientation; one has a larger τ and the other has a smaller τ, and each cluster has different preferred ρ. In other words, the distribution is close to the mixture of two unimodal distributions with different preferred orientation. The variability within each preferred orientation is small, suggesting that SSNMR-ED effectively searches the orientational space to find an ensemble of orientations whose averaged properties satisfy the experimental observables, but each replica is still under strong influence of the CSA and DC restraint potentials with NREP = 2. Such strong bias quickly disappears as more replicas are employed. The orientational distributions are well converged when NREP ≥ 8, and there are three major clusters (Fig. 5); values of τ for the two most populated clusters are approximately within 28°–38° range, and the average τ is ∼20° in the sparsely populated third cluster.
Figure 5.
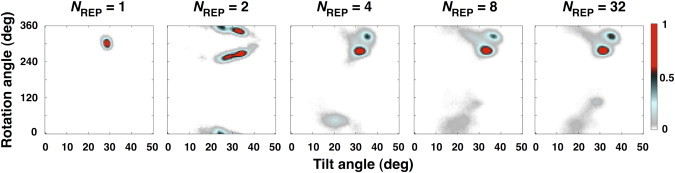
Orientational distributions of VpuTM structure ensembles in DMPC bilayer environment with different numbers of replica. The population is normalized for easy comparison.
Comparison with molecular dynamics simulation
By design, the structure ensemble determined by the (biased) SSNMR-ED simulation agrees well with the experimental data. To examine whether the orientation distributions of such ensemble structures are compatible with those from (unbiased) standard MD simulation, we have performed a total of 1.5 μs comparative MD simulations of VpuTM in explicit lipid bilayers, starting from τ = 0° (see Materials and Methods). The τ- and ρ-distributions from the last 50-ns simulation trajectories in DLPC, DMPC, and DOPC bilayers are shown in Figs. 6 and 7 (top row). Because the complete relaxation of a membrane protein in a lipid bilayer could take longer than a typical all-atom simulation timescale (44), we have combined the trajectories from five independent systems to construct the cumulative distribution (black line). The average τ-values from the standard MD simulations are 17.7 ± 7.9° (DOPC), 24.7 ± 7.5° (DMPC), and 34.2 ± 6.3° (DLPC), and the average ρ-values are 301 ± 73° (DOPC), 295 ± 47° (DMPC), and 319 ± 103° (DLPC); the error bars are the standard deviation from the five independent trajectories. The combined trajectories yield average τ- and ρ-values similar to the ones determined by the rigid-body geometric search, but the orientational variability is significantly greater than the geometric search and compatible with the SSNMR-ED structure ensembles. In addition, as shown in Fig. 6, the standard MD simulation also clearly shows the increase in the average VpuTM's τ-value as the bilayer hydrophobic thickness decreases in the order of DOPC, DMPC, and DLPC (see Fig. 2 for molecular graphics views).
Figure 6.
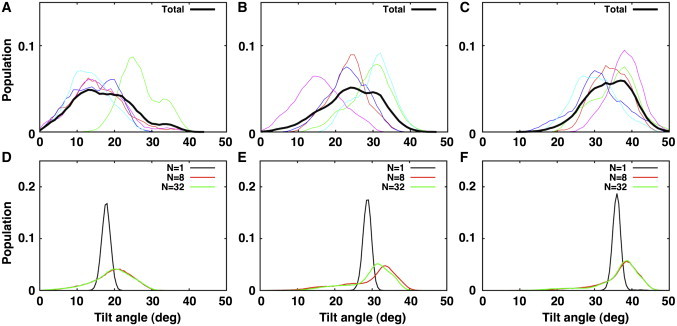
VpuTM's τ-distribution of structure ensembles in different bilayer environment. (A–C) Distributions from standard MD simulations in DOPC, DMPC, and DLPC, respectively. (Colored lines) Individual simulation trajectories. (Black lines) Combined trajectories. (D–F) Distributions from SSNMR-ED in DOPC, DMPC, and DLPC, respectively.
Figure 7.
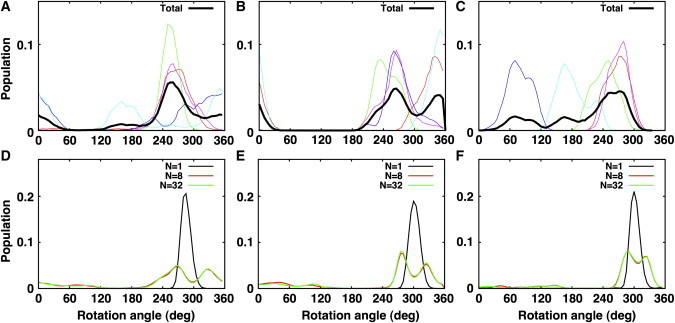
VpuTM's ρ-distribution of structure ensembles in different bilayer environments. (A–C) Distributions from standard MD simulations in DOPC, DMPC, and DLPC, respectively. (Colored lines) Individual simulation trajectories. (Black lines) Combined trajectories. (D–F) Distributions from SSNMR-ED in DOPC, DMPC, and DLPC, respectively.
When the τ- and ρ-distributions from MD simulations are compared with the ones from SSNMR-ED (Figs. 6 and 7, bottom row), it is clear that the structures determined with NREP = 1 (black line) produce a much narrower distribution than those from MD simulation. Although the averaged VpuTM orientation matches well, using NREP = 1 significantly underestimates the variability of TM helix orientation. When NREP ≥ 8, the structures determined by SSNMR-ED show similar orientational variability to the ones from MD simulation. However, detailed examination of τ- and ρ-distributions revealed that the overall shape of the distributions does not exactly match the structure ensembles from MD and SSNMR-ED. Such difference could arise from the limited MD simulation time and the different representation of membranes in MD (explicit) and SSNMR-ED (implicit). Nonetheless, this comparison clearly demonstrates that SSNMR-ED has the ability to generate an ensemble of structures (i.e., TM helix orientation distribution) that satisfies the experimental observables within a reasonable physical (force-field) model, so that one can extract both TM helix orientation and dynamics information simultaneously from SSNMR observables.
Orientational exchange is faster than NMR timescale
From the ensemble structures determined by SSNMR-ED and standard MD, it becomes clear that VpuTM has much larger orientational variability compared to the view based on the interpretation from the conventional geometric search approach. Both CSA and DC are averaged on a millisecond or faster timescale in experiment (45). If the orientational exchange rate is faster than the timescale of NMR measurement, orientational variability could be averaged and only a single NMR observable corresponding to the average orientation would be measured. It is very difficult to confidently measure the degree of orientational variability in experiment. The TM helix precession around the membrane normal has been characterized to have a timescale at least faster than 10−4 s (46). The timescale of TM helix tilt and rotation motions has yet to be measured explicitly in experiment.
Because we have the time series of τ and ρ from the standard MD that yields the τ- and ρ-distributions similar to SSNMR-ED, it is instructive to estimate the relaxation time by calculating the correlation function of such motions,
| (6) |
where T(t) is τ or ρ of VpuTM at time t, and 〈T〉 is the time-averaged τ and ρ. To increase the statistical significance, we have averaged correlation functions over the five independent trajectories. Fig. 8 shows the correlation functions of τ and ρ in DMPC (see Fig. S3 for the DLPC and DOPC cases, and Fig. S4 for the time series of tilt and rotation angles). By using a least-square fit to a single exponential decay, C(t) ≈ e−t/ω, ω is determined to be 3.0 ± 0.8 ns (tilt) and 2.8 ± 0.4 ns (rotation); ω represents a mean relaxation time of the fluctuations around the average value, and the errors are the standard error of ω fitted to individual (five) trajectories. Although the mean relaxation time is approximate because the correlation functions from individual trajectories show a residual oscillatory behavior, it is clear that the fluctuation time in τ and ρ is well below the NMR timescale. Although this is not a direct proof that the orientational variability observed in the standard MD or SSNMR-ED structure ensembles corresponds to the orientational variability of VpuTM in the NMR probe, this analysis sheds light on the idea that the orientational average in SSNMR experiment is feasible and the TM helix dynamics needs to be considered in interpretation of SSNMR observables.
Figure 8.
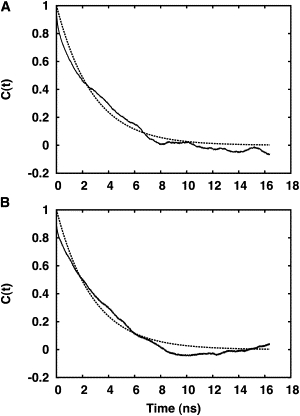
Correlation functions of VpuTM (A) τ- and (B) ρ-fluctuations. (Solid line) Average correlation function over five independent simulation trajectories. (Dotted line) Least-square fit to a single exponential decay, C(t) ≈ e−t/ω.
Concluding Discussion
In general, structure determination of membrane proteins poses different types of challenges than globular proteins. The TM domain of a membrane protein is well protected from water due to the low dielectric nature of the bilayer hydrophobic core, and thus formation of a stable and relatively rigid helical structure is favorable (47,48). Therefore, unlike globular protein, it is important to describe the TM helix structure in terms of its orientation, rather than the structure itself. The TM helix orientation is also important because its change is often associated with different functional states (49). SSNMR observables, such as CSA and DC, are used to elucidate the orientation of TM helices in its native environment. Traditionally, the orientation of a membrane protein is determined by geometric search with an ideal helix, and the motional average is described by a generalized order parameter. The resulting structures generally show that the TM helices have very limited orientational freedom, i.e., ±1° in terms of the helix tilt angle (1–3). Such a view has been challenged by a number of experimental and computer simulation evidence that the TM helices have much greater degree of dynamics in the bilayer membrane (8–11).
We have developed and illustrated the structure determination method for membrane protein by combining the MD simulation and explicit SSNMR observables, such as CSA and DC. Unlike the traditional approach, this SSNMR-ED approach uses more than one independent replica in the simulation and applies a set of bias potentials to make the averaged properties of the structure ensemble match with the experimental observables. By allowing individual replicas a greater amount of orientational freedom, the resulting structure ensembles show much greater orientational variability, which overall matches well with the MD simulation. Cross-validation of the determined structure ensemble and the standard MD simulation demonstrates that SSNMR-ED has the ability to generate an ensemble of structures (i.e., TM helix orientation distribution) that satisfies the experimental observables within a reasonable physical (force field) model, so that one can simultaneously extract both TM helix orientation and dynamic information from SSNMR observables.
Recently, we have extended the SSNMR ensemble restraint potential (Eq. 1) to handle deuterium quadrupolar splitting data, another type of SSNMR observable, and applied the SSNMR-ED simulation to determine the orientation and its variability of WALP23, a TM model peptide (18). Unlike the VpuTM case (this study with CSA and DC), the structure ensemble of WALP23 showed significantly larger ensemble-averaged τ (26.9 ± 6.7°) than the one determined by the quasistatic model (5.6 ± 3.2°) (50), but agrees well with other MD simulation and free energy calculation results (9,42). This independent study further validates that the SSNMR-ED technique provides a generalized method for extracting dynamics information from SSNMR observables while determining the TM helix structures. This method could be applicable to elucidating the influence of the TM helix orientation and its variability on the structure and function of biologically important systems.
Acknowledgments
We are grateful to Jinhyuk Lee, Taehoon Kim, and Richard W. Pastor for helpful discussion.
This work was supported by National Science Foundation MCB-0918374, and TeraGrid resources provided by Purdue University (NSF OCI-0503992).
Supporting Material
References
- 1.Ramamoorthy A., Thennarasu S., Maloy L. Solid-state NMR investigation of the membrane-disrupting mechanism of antimicrobial peptides MSI-78 and MSI-594 derived from magainin 2 and melittin. Biophys. J. 2006;91:206–216. doi: 10.1529/biophysj.105.073890. [DOI] [PMC free article] [PubMed] [Google Scholar]
- 2.Traaseth N.J., Buffy J.J., Veglia G. Structural dynamics and topology of phospholamban in oriented lipid bilayers using multidimensional solid-state NMR. Biochemistry. 2006;45:13827–13834. doi: 10.1021/bi0607610. [DOI] [PubMed] [Google Scholar]
- 3.Park S.H., Opella S.J. Tilt angle of a trans-membrane helix is determined by hydrophobic mismatch. J. Mol. Biol. 2005;350:310–318. doi: 10.1016/j.jmb.2005.05.004. [DOI] [PubMed] [Google Scholar]
- 4.Wu C., Ramamoorthy A., Opella S. High-resolution heteronuclear dipolar solid-state NMR-spectroscopy. J. Magn. Reson. A. 1994;109:270–272. [Google Scholar]
- 5.Marassi F.M., Opella S.J. A solid-state NMR index of helical membrane protein structure and topology. J. Magn. Reson. 2000;144:150–155. doi: 10.1006/jmre.2000.2035. [DOI] [PMC free article] [PubMed] [Google Scholar]
- 6.Wang J., Denny J., Cross T.A. Imaging membrane protein helical wheels. J. Magn. Reson. 2000;144:162–167. doi: 10.1006/jmre.2000.2037. [DOI] [PubMed] [Google Scholar]
- 7.Holt A., Killian J.A. Orientation and dynamics of transmembrane peptides: the power of simple models. Eur. Biophys. J. 2010;39:609–621. doi: 10.1007/s00249-009-0567-1. [DOI] [PMC free article] [PubMed] [Google Scholar]
- 8.Straus S.K., Scott W.R.P., Watts A. Assessing the effects of time and spatial averaging in 15N chemical shift/15N-1H dipolar correlation solid state NMR experiments. J. Biomol. NMR. 2003;26:283–295. doi: 10.1023/a:1024098123386. [DOI] [PubMed] [Google Scholar]
- 9.Ozdirekcan S., Etchebest C., Fuchs P.F. On the orientation of a designed transmembrane peptide: toward the right tilt angle? J. Am. Chem. Soc. 2007;129:15174–15181. doi: 10.1021/ja073784q. [DOI] [PubMed] [Google Scholar]
- 10.Lee J., Im W. Transmembrane helix tilting: insights from calculating the potential of mean force. Phys. Rev. Lett. 2008;100:018103. doi: 10.1103/PhysRevLett.100.018103. [DOI] [PubMed] [Google Scholar]
- 11.Im W., Brooks C.L., 3rd Interfacial folding and membrane insertion of designed peptides studied by molecular dynamics simulations. Proc. Natl. Acad. Sci. USA. 2005;102:6771–6776. doi: 10.1073/pnas.0408135102. [DOI] [PMC free article] [PubMed] [Google Scholar]
- 12.Esteban-Martín S., Strandberg E., Salgado J. Influence of whole-body dynamics on 15N PISEMA NMR spectra of membrane proteins: a theoretical analysis. Biophys. J. 2009;96:3233–3241. doi: 10.1016/j.bpj.2008.12.3950. [DOI] [PMC free article] [PubMed] [Google Scholar]
- 13.Holt A., Rougier L., Milon A. Order parameters of a transmembrane helix in a fluid bilayer: case study of a WALP peptide. Biophys. J. 2010;98:1864–1872. doi: 10.1016/j.bpj.2010.01.016. [DOI] [PMC free article] [PubMed] [Google Scholar]
- 14.Strandberg E., Esteban-Martín S., Ulrich A.S. Orientation and dynamics of peptides in membranes calculated from 2H-NMR data. Biophys. J. 2009;96:3223–3232. doi: 10.1016/j.bpj.2009.02.040. [DOI] [PMC free article] [PubMed] [Google Scholar]
- 15.Lindorff-Larsen K., Best R.B., Vendruscolo M. Simultaneous determination of protein structure and dynamics. Nature. 2005;433:128–132. doi: 10.1038/nature03199. [DOI] [PubMed] [Google Scholar]
- 16.Bonvin A.M., Brünger A.T. Conformational variability of solution nuclear magnetic resonance structures. J. Mol. Biol. 1995;250:80–93. doi: 10.1006/jmbi.1995.0360. [DOI] [PubMed] [Google Scholar]
- 17.Levin E.J., Kondrashov D.A., Phillips G.N., Jr. Ensemble refinement of protein crystal structures: validation and application. Structure. 2007;15:1040–1052. doi: 10.1016/j.str.2007.06.019. [DOI] [PMC free article] [PubMed] [Google Scholar]
- 18.Kim T., Jo S., Im W. Solid-state NMR ensemble dynamics as a mediator between experiment and simulation. Biophys. J. 2011;100:2922–2928. doi: 10.1016/j.bpj.2011.02.063. [DOI] [PMC free article] [PubMed] [Google Scholar]
- 19.Lee J., Im W. Implementation and application of helix-helix distance and crossing angle restraint potentials. J. Comput. Chem. 2007;28:669–680. doi: 10.1002/jcc.20614. [DOI] [PubMed] [Google Scholar]
- 20.Lee J., Chen J., Im W. Application of solid-state NMR restraint potentials in membrane protein modeling. J. Magn. Reson. 2008;193:68–76. doi: 10.1016/j.jmr.2008.04.023. [DOI] [PMC free article] [PubMed] [Google Scholar]
- 21.Woolf T., Malkin V., Roux B. The backbone N-15 chemical shift tensor of the gramicidin channel. A molecular dynamics and density functional study. Chem. Phys. Lett. 1995;239:186–194. [Google Scholar]
- 22.Tycko R., Stewart P., Opella S. Peptide plane orientations determined by fundamental and overtone nitrogen 14NMR. J. Am. Chem. Soc. 1986;108:5419–5425. [Google Scholar]
- 23.Brooks B.R., Brooks C.L., 3rd, Karplus M. CHARMM: the biomolecular simulation program. J. Comput. Chem. 2009;30:1545–1614. doi: 10.1002/jcc.21287. [DOI] [PMC free article] [PubMed] [Google Scholar]
- 24.Im W., Lee M.S., Brooks C.L., 3rd Generalized Born model with a simple smoothing function. J. Comput. Chem. 2003;24:1691–1702. doi: 10.1002/jcc.10321. [DOI] [PubMed] [Google Scholar]
- 25.Chen J., Im W., Brooks C.L., 3rd Application of torsion angle molecular dynamics for efficient sampling of protein conformations. J. Comput. Chem. 2005;26:1565–1578. doi: 10.1002/jcc.20293. [DOI] [PubMed] [Google Scholar]
- 26.Jo S., Lim J.B., Im W. CHARMM-GUI Membrane Builder for mixed bilayers and its application to yeast membranes. Biophys. J. 2009;97:50–58. doi: 10.1016/j.bpj.2009.04.013. [DOI] [PMC free article] [PubMed] [Google Scholar]
- 27.Jo S., Kim T., Im W. Automated builder and database of protein/membrane complexes for molecular dynamics simulations. PLoS ONE. 2007;2:e880. doi: 10.1371/journal.pone.0000880. [DOI] [PMC free article] [PubMed] [Google Scholar]
- 28.Jo S., Kim T., Im W. CHARMM-GUI: a web-based graphical user interface for CHARMM. J. Comput. Chem. 2008;29:1859–1865. doi: 10.1002/jcc.20945. [DOI] [PubMed] [Google Scholar]
- 29.Skibinsky A., Venable R.M., Pastor R.W. A molecular dynamics study of the response of lipid bilayers and monolayers to trehalose. Biophys. J. 2005;89:4111–4121. doi: 10.1529/biophysj.105.065953. [DOI] [PMC free article] [PubMed] [Google Scholar]
- 30.Klauda J.B., Kucerka N., Nagle J.F. Simulation-based methods for interpreting x-ray data from lipid bilayers. Biophys. J. 2006;90:2796–2807. doi: 10.1529/biophysj.105.075697. [DOI] [PMC free article] [PubMed] [Google Scholar]
- 31.Mackerell A., Bashford D., Karplus M. All-atom empirical potential for molecular modeling and dynamics studies of proteins. J. Phys. Chem. B. 1998;102:3586–3616. doi: 10.1021/jp973084f. [DOI] [PubMed] [Google Scholar]
- 32.Mackerell A.D., Jr., Feig M., Brooks C.L., 3rd Extending the treatment of backbone energetics in protein force fields: limitations of gas-phase quantum mechanics in reproducing protein conformational distributions in molecular dynamics simulations. J. Comput. Chem. 2004;25:1400–1415. doi: 10.1002/jcc.20065. [DOI] [PubMed] [Google Scholar]
- 33.Klauda J.B., Brooks B.R., Pastor R.W. An ab initio study on the torsional surface of alkanes and its effect on molecular simulations of alkanes and a DPPC bilayer. J. Phys. Chem. B. 2005;109:5300–5311. doi: 10.1021/jp0468096. [DOI] [PubMed] [Google Scholar]
- 34.Klauda J.B., Pastor R.W., Brooks B.R. Adjacent gauche stabilization in linear alkanes: implications for polymer models and conformational analysis. J. Phys. Chem. B. 2005;109:15684–15686. doi: 10.1021/jp0527608. [DOI] [PMC free article] [PubMed] [Google Scholar]
- 35.Reference deleted in proof.
- 36.Rui H.A., Im W. Protegrin-1 orientation and physicochemical properties in membrane bilayers studied by potential of mean force calculations. J. Comput. Chem. 2010;31:2859–2867. doi: 10.1002/jcc.21580. [DOI] [PubMed] [Google Scholar]
- 37.Klauda J.B., Venable R.M., Pastor R.W. Update of the CHARMM all-atom additive force field for lipids: validation on six lipid types. J. Phys. Chem. B. 2010;114:7830–7843. doi: 10.1021/jp101759q. [DOI] [PMC free article] [PubMed] [Google Scholar]
- 38.Ryckaert J., Ciccotti G., Berendsen H. Numerical-integration of Cartesian equations of motion of a system with constraints: molecular-dynamics of n-alkanes. J. Comput. Phys. 1977;23:327–341. [Google Scholar]
- 39.Steinbach P.J., Brooks B.R. New spherical-cutoff methods for long-range forces in macromolecular simulation. J. Comput. Chem. 1994;15:667–683. [Google Scholar]
- 40.Essmann U., Perera L., Pedersen L.G. A smooth particle mesh Ewald potential. J. Chem. Phys. 1995;103:8577–8592. [Google Scholar]
- 41.Brünger A.T., Clore G.M., Nilges M. Assessing the quality of solution nuclear magnetic resonance structures by complete cross-validation. Science. 1993;261:328–331. doi: 10.1126/science.8332897. [DOI] [PubMed] [Google Scholar]
- 42.Kim T., Im W. Revisiting hydrophobic mismatch with free energy simulation studies of transmembrane helix tilt and rotation. Biophys. J. 2010;99:175–183. doi: 10.1016/j.bpj.2010.04.015. [DOI] [PMC free article] [PubMed] [Google Scholar]
- 43.Lundbaek J.A., Collingwood S.A., Andersen O.S. Lipid bilayer regulation of membrane protein function: gramicidin channels as molecular force probes. J. R. Soc. Interface. 2010;7:373–395. doi: 10.1098/rsif.2009.0443. [DOI] [PMC free article] [PubMed] [Google Scholar]
- 44.Grossfield A., Feller S.E., Pitman M.C. Convergence of molecular dynamics simulations of membrane proteins. Proteins. 2007;67:31–40. doi: 10.1002/prot.21308. [DOI] [PubMed] [Google Scholar]
- 45.De Angelis A.A., Nevzorov A.A., Opella S.J. High-resolution NMR spectroscopy of membrane proteins in aligned bicelles. J. Am. Chem. Soc. 2004;126:15340–15341. doi: 10.1021/ja045631y. [DOI] [PubMed] [Google Scholar]
- 46.Park S.H., Mrse A.A., Opella S.J. Rotational diffusion of membrane proteins in aligned phospholipid bilayers by solid-state NMR spectroscopy. J. Magn. Reson. 2006;178:162–165. doi: 10.1016/j.jmr.2005.08.008. [DOI] [PubMed] [Google Scholar]
- 47.White S.H., Wimley W.C. Membrane protein folding and stability: physical principles. Annu. Rev. Biophys. Biomol. Struct. 1999;28:319–365. doi: 10.1146/annurev.biophys.28.1.319. [DOI] [PubMed] [Google Scholar]
- 48.Popot J.L., Engelman D.M. Helical membrane protein folding, stability, and evolution. Annu. Rev. Biochem. 2000;69:881–922. doi: 10.1146/annurev.biochem.69.1.881. [DOI] [PubMed] [Google Scholar]
- 49.Opella S.J., Zeri A.C., Park S.H. Structure, dynamics, and assembly of filamentous bacteriophages by nuclear magnetic resonance spectroscopy. Annu. Rev. Phys. Chem. 2008;59:635–657. doi: 10.1146/annurev.physchem.58.032806.104640. [DOI] [PubMed] [Google Scholar]
- 50.Strandberg E., Ozdirekcan S., Killian J.A. Tilt angles of transmembrane model peptides in oriented and non-oriented lipid bilayers as determined by 2H solid-state NMR. Biophys. J. 2004;86:3709–3721. doi: 10.1529/biophysj.103.035402. [DOI] [PMC free article] [PubMed] [Google Scholar]
Associated Data
This section collects any data citations, data availability statements, or supplementary materials included in this article.