

Abstract
Solid-state NMR (SSNMR) is a powerful technique to describe the orientations of membrane proteins and peptides in their native membrane bilayer environments. The deuterium (2H) quadrupolar splitting (DQS), one of the SSNMR observables, has been used to characterize the orientations of various single-pass transmembrane (TM) helices using a semistatic rigid-body model such as the geometric analysis of labeled alanine (GALA) method. However, dynamic information of these TM helices, which could be related to important biological function, can be missing or misinterpreted with the semistatic model. We have investigated the orientation of WALP23 in an implicit membrane of dimyristoylglycerophosphocholine by determining an ensemble of structures using multiple conformer models with a DQS restraint potential. When a single conformer is used, the resulting helix orientation (tilt angle (τ) of 5.6 ± 3.2° and rotation angle (ρ) of 141.8 ± 40.6°) is similar to that determined by the GALA method. However, as the number of conformers is increased, the tilt angles of WALP23 ensemble structures become larger (26.9 ± 6.7°), which agrees well with previous molecular dynamics simulation results. In addition, the ensemble structure distribution shows excellent agreement with the two-dimensional free energy surface as a function of WALP23's τ and ρ. These results demonstrate that SSNMR ensemble dynamics provides a means to extract orientational and dynamic information of TM helices from their SSNMR observables and to explain the discrepancy between molecular dynamics simulation and GALA-based interpretation of DQS data.
Introduction
This work aims to determine the transmembrane (TM) helix dynamics that is possibly embedded in solid-state NMR (SSNMR) deuterium (2H) quadrupolar splitting (DQS) and to reconcile the long-standing discrepancy between molecular dynamics (MD) simulation and experimental interpretation on TM helix orientation and dynamics. For more than a decade, considerable efforts have been made to understand TM helix orientation and dynamics, and their changes in the context of hydrophobic mismatch, which can be related to the important biological function of membrane proteins (1–4). In particular, SSNMR has proven to be a powerful technique to describe the orientations of membrane proteins and peptides in their native membrane bilayer environments (5–7). However, dynamic information of these TM helices can be missing or misinterpreted when a static or semistatic rigid-body model is used to interpret the SSNMR observables.
Among various SSNMR observables, the DQS measurement has been used to characterize the orientations of single-pass TM helices, such as WALP and KALP peptides, using the semistatic geometric analysis of labeled alanine (GALA) method (8,9) (note that the term “semistatic” is used to broadly include some nonspecified motion that is taken into account in the GALA method with an order parameter of <1). The TM helix tilt angle interpreted by the GALA method is relatively small (∼5° for WALP23 in dimyristoylglycerophosphocholine (DMPC)) (9,10), which differs significantly from much larger tilt angles (∼30°) observed in MD simulations (11–15). Recently, to explain the apparent discrepancy between GALA-based interpretation and MD simulation of WALP23, it has been suggested that an average of large-scale rotation motion along the helix axis needs to be considered when interpreting the TM helix orientation from DQS (12,16,17). Several approaches including motional averaging of TM helix orientation have been proposed to include TM helix orientational variability (12,16,18), but these approaches have fundamental limitations in describing complex TM helix motion from the SSNMR observables, which will be discussed in detail in Results and Discussion. In general, extracting information about conformational variability directly from NMR and x-ray diffraction is not an easy task because the experimental observables represent time- and ensemble-averages (19–21).
In this work, we determine the TM orientation and intrinsic dynamic information of WALP23 using SSNMR ensemble dynamics (SSNMR-ED). In SSNMR-ED, an ensemble of conformers or replicas is used in parallel MD simulation, and a biased potential (i.e., DQS restraint potential in this work) is applied to minimize the deviation of the ensemble-averaged property from experimental measurements (9). The distribution of WALP23 ensemble structures is characterized as a function of its number of replicas; the resulting ensemble structures show better agreement with SSNMR observables with increased number of replicas and much larger TM helix tilt angles with more than one replica. The ensemble structure distribution is validated by calculating a two-dimensional potential of mean force (2D-PMF) as a function of WALP23's orientation (TM tilt and rotation). These results demonstrate that SSNMR-ED provides a means to extract the orientational and dynamic information of TM helices from their SSNMR observables. SSNMR-ED also provides a realistic explanation of the discrepancy between MD simulation and GALA-based interpretation of DQS data.
Methods
Defining the tilt and rotation angles
The TM helix orientation is defined by its tilt (τ) and rotation (ρ) angles. The value τ is defined as the angle between the helical principal axis and the unit vector along the Z axis parallel to the membrane-normal (22). For ρ, both the internal and external references have to be defined (Fig. 1). The internal reference is given by the vector pointing from the helical axis to the Cα atom of Leu10. Gly1 has been widely used to define ρ (mostly when a rigid helix is used) (8,9,12), but it is not an appropriate choice for a dynamic system because of its flexibility at the terminal. Instead, we used Leu10 to avoid the flexibility problem and for facile comparison with other results based on Gly1; Leu10 is at the almost exact opposite position to Gly1 on the helical wheel projection of WALP23. With the unit vector along the Z axis as the external reference, ρ is defined as the angle between the projections of such reference vectors on the plane made by the second and third helical principal axes. The detailed expressions can be found in our previous works (22,23).
Figure 1.
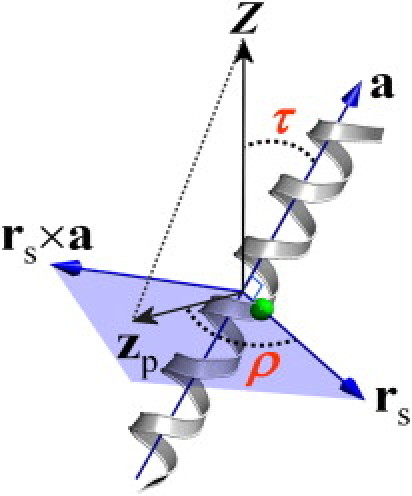
Definition of helix tilt (τ) and rotation (ρ) angles. (Green circle) Selected Cα atom to define ρ. The value ρ is defined as the angle between the perpendicular vector (rs) from the helical axis (a) to the selected Cα atom and the projection vector (zp) of the Z axis onto the plane (light blue) made by the second and third principal axes. The sign of the rotational angle becomes positive if zp × rs is in the opposite direction to a, or negative otherwise.
Implicit membrane model
WALP23, acetyl-GWW(LA)8LWWA-methylamide, was constructed in an ideal α-helical conformation (ϕ = −57.8°; ψ = −47.0°). The EEF1/IMM1 (24,25) implicit membrane model in CHARMM (26) was used to mimic the bilayer membrane environment. The planar implicit membrane was centered at Z = 0 with the membrane-normal parallel to the Z axis. The EEF1/IMM1 calculations were prepared using the Implicit Solvent Modeler module in CHARMM-GUI (www.charmm-gui.org) (27).
Solvent/membrane environments play an important role in determining TM helix orientations. To determine a proper hydrophobic thickness of the implicit membrane, the PMF calculations as a function of WALP23's τ at different rotation angles were performed and compared with our previous results in explicit lipid bilayers (Table 1) (14). The initial systems for the umbrella sampling simulations were generated by tilting WALP23 from τ = 0° to 50° by 2° every 100 ps, resulting in a total of 26 windows, at different rotation angles. Each window was then subjected to a 200-ps equilibration and 6-ns production for the PMF calculations with a different hydrophobic thickness from 18.5 Å to 21 Å in 0.5 Å increment. The biased distribution from the umbrella sampling simulations was unbiased by the weighted histogram analysis method (WHAM) (28) to construct the PMF. The PMFs as a function of τ were calculated for every 0.2°, with the energy tolerance of 10−6 kcal/mol. The optimal hydrophobic thickness was determined to be 20 Å, which showed the best agreement with the PMFs calculated in the explicit membranes (14) in terms of root mean-square deviation (RMSD) and the minimum-PMF τ (Table 1 and Fig. 2). The simulations were performed at 298 K using Langevin dynamics with a 2-fs time step. All bond lengths involving hydrogen were fixed with the SHAKE algorithm (29).
Table 1.
RMSD between the PMFs calculated from the all-atom simulations and the implicit membrane simulations with various hydrophobic thickness (LH)
| ρ (°) \ LH(Å) | 18.5 | 19.0 | 19.5 | 20.0 | 20.5 | 21.0 |
|---|---|---|---|---|---|---|
| Free | 0.78 | 0.28 | 0.33 | 0.24 | 0.28 | 0.14 |
| 0 | 0.94 | 1.07 | 1.18 | 1.52 | 1.56 | 1.87 |
| 90 | 0.34 | 0.42 | 0.43 | 0.65 | 1.16 | 1.36 |
| 180 | 0.33 | 0.45 | 0.47 | 0.61 | 1.18 | 1.45 |
| 270 | 0.31 | 0.38 | 0.54 | 0.71 | 1.06 | 1.17 |
Note that the PMFs were calculated as a function of WALP23's tilt angle at four specific rotation angles (ρ) and the term “Free” represents no rotational restraint applied.
Figure 2.
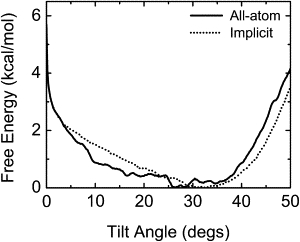
PMFs calculated from the all-atom simulation (solid line) and the implicit membrane simulation with a hydrophobic thickness of 20 Å (dotted line) for free rotation.
Ensemble dynamics with a DQS restraint potential
In the ensemble dynamics simulation, one can perform the simulations with a certain number of replicas (NREP) simultaneously and restrain the ensemble-averaged property (〈χcalc〉ens) to the experimental target value (χexp). In this work, the target data are the experimental DQS observables (χ = ν), so that we have developed an ensemble DQS restraint potential (based on our recently-developed 1H−15N dipolar coupling ensemble restraint potential (30,31)),
| (1) |
where NDQS is the number of experimental DQS observables, kDQS is the force constant [kcal/(mol·kHz2)], and 〈vicalc〉ens is
| (2) |
where KQC is the quadrupolar coupling constant and θi is the angle between the Cα-Cβ bond of labeled alanine (virtually the Cα−CβD3 vector) and the external magnetic field (i.e., the Z axis). KQC was set to 56 kHz, which corresponds to one-third of a typical quadrupolar coupling constant, 168 kHz (32), due to the fast rotation of the methyl group. The total potential energy (UTOTAL) of the ensemble system is then expressed as
| (3) |
where UCHARMM is the CHARMM potential energy of the ensemble structure. We have checked the numerical accuracy of the ensemble DQS restraint potential; the total energy of all the replicas (not the total energy of each replica) was well converged during the NVE dynamics (data not shown).
The simulation stability depends on the applied force constants and dynamics algorithms. Based on our previous studies with other SSNMR structure calculations (31), we used torsion angle MD (TAMD) simulation (33) because it yields more stable trajectories than Cartesian MD due to a rigid peptide plane. In addition, to generate stable simulation trajectories, the maximum force constant was empirically optimized to be KDQS = 0.4 kcal/(mol·kHz2). Experimental DQS observables were taken from oriented 0° di-C14:0-PC (9): 9.3 kHz for Ala5, 11.3 kHz for Ala9, 12.8 kHz for Ala13, 12.3 kHz for Ala17, and 2.0 kHz for Ala19.
Starting from an α-helical conformation of WALP23, kDQS was smoothly increased to the maximum value during 10 cycles of 400-ps TAMD simulations, and a final 200-ps TAMD production was performed for structural analysis. To increase the sampling statistics, we repeated the TAMD simulation 100 times with different initial velocities for NREP = 1, 2, 4, 8, 16, and 32. We used a 1-fs time-step for TAMD. A constant temperature of 298 K was maintained by using a simple Berendsen thermostat (34) in combination with velocity reassignments. The completion of the simulation cycle (i.e., 4.2 ns for each run) took ∼4 h for eight or smaller replicas, 8 h for 16 replicas, and 16 h for 32 replicas running in parallel on 2.33-GHz quad-core Intel workstations; the time increase is mostly due to the communication between the replicas.
To validate the quality of the ensemble dynamics simulation result, we have calculated RMSD [kHz] between |〈vicalc〉ens| and viexp,
| (4) |
2D-PMF as a function of tilt and rotation angles
To validate the orientation distribution from the SSNMR-ED simulations, we calculated the 2D-PMF as a function of WALP23's τ and ρ in the EEF1/IMM1 implicit membrane. The initial structures were generated by tilting WALP23 every 2° from 0° to 60°, followed by rotating it every 5° from −180° to 180° at each τ, resulting in a total of 2263 windows. We performed a 200-ps equilibration and a 10-ns production at each window using the same force constants for the WALP23 tilt and rotation restraint potentials as those used in the explicit membrane PMF calculations (14,35). We used the same dynamics options used in the SSNMR-ED with TAMD. The biased distribution from the umbrella sampling simulations was unbiased by WHAM (28) to construct the 2D-PMF; the interval of the free energy surface was set to 0.5° and 1.0° along the τ- and ρ-directions, respectably. The energy tolerance for the WHAM iterations was 10−6 kcal/mol.
Results and Discussion
Orientation of ensemble structures
Fig. 3 shows the orientation of WALP23 in terms of τ and ρ as a function of NREP. The orientation distribution of the ensemble structures shows a striking difference between NREP = 1 and NREP ≥ 2, whereas the ensemble-averaged DQS are in close agreement with experimental values in terms of RMSD (Fig. 4 A). The τ and ρ for NREP = 1 are 5.6 ± 3.2° and 141.8 ± 40.6° with the DQS RMSD of ∼0.8 kHz (Fig. 4), which agrees very well with the result (τ = 5.5°, ρ = 153.5°, and RMSD = 0.9 kHz) based on the GALA method (9). Interestingly, for NREP ≥ 2, much larger τ are observed, reaching at ∼27° when NREP = 32, whereas ρ remains at similar values with increased fluctuation. The ensemble orientation appears to converge when NREP ≥ 8, demonstrating that it is possible to find a well-converged solution to the applied DQS restraints (36). In addition, Fig. 4 A shows that the DQS RMSD decreases as more replicas are used in SSNMR-ED, illustrating that the generated structure ensemble agrees well with the 2H-NMR experimental DQS data.
Figure 3.
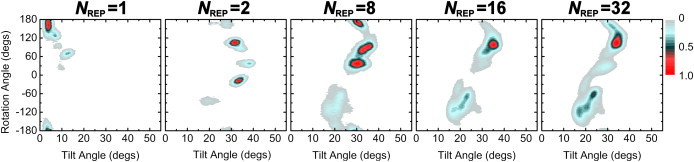
Orientation distribution of ensemble structures as a function of NREP. The population is normalized by setting the highest value to 1 for easy comparison for each system.
Figure 4.
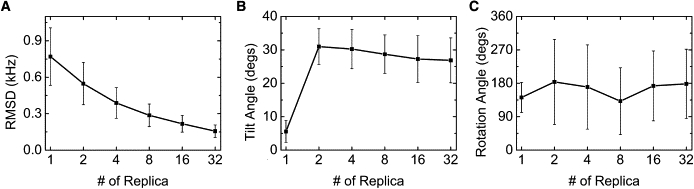
(A) RMSD of DQS and (B and C) tilt and rotation angles of WALP23 as a function of NREP.
How does the structure ensemble show such a dramatic increase in τ with smaller DQS RMSD when NREP ≥ 2?
Fig. 5 shows the DQS distribution of each alanine in the ensemble structures as a function of NREP. Surprisingly, each distribution is very broad except when NREP = 1; DQS of each alanine covers the whole DQS range (−42 to 84 kHz in Fig. 5). It is notable that each distribution has the highest population on the negative DQS side and a broad distribution on the positive one. As shown in Fig. 6, the peaks in the DQS distribution (mostly −34 kHz) correspond to the highest population (θ ≈ 75°) in the distribution of θi, the angle between the Cα−Cβ vector and the Z axis in Eq. 2. It becomes clear that such broad DQS distribution (Fig. 5) results from the various TM helix orientations in the structure ensemble (Figs. 3 and 6). Thus, the absolute value of the ensemble-averaged DQS becomes smaller (0∼10 kHz), which is measured in the 2H-NMR experiment. It should be stressed that, when NREP ≥ 2, the calculated DQS of individual structures are different from the experimental one, but their ensemble-averaged DQS (regardless of their signs) show excellent agreement with experimental observables. Although we obtain the possible DQS distributions from individual replicas (Fig. 5), it is not feasible to use them directly as reference values for the current SSNMR-ED simulation scheme.
Figure 5.
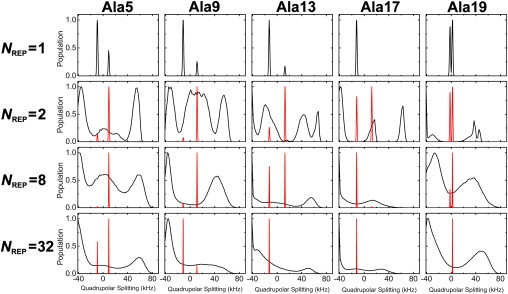
Distribution of calculated (black) and ensemble averaged (red) DQS of each alanine as a function of NREP. In the case of NREP = 1, the ensemble-averaged DQS does not exist. The population is normalized by setting the highest value to 1 for easy comparison for each system.
Figure 6.
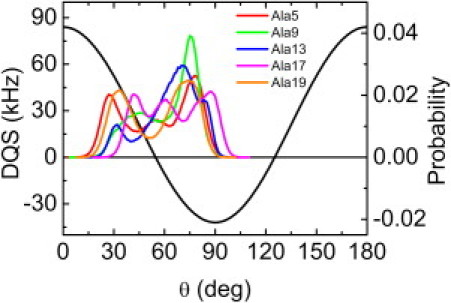
DQS value as a function of θ (black) and distribution of θ for each alanine when NREP = 32. The possible value of DQS is a range of −42 to 84 kHz.
Evaluation of MD simulation
The SSNMR-ED simulation is different from the standard MD simulation, in that the ensemble structures are generated by a biased restraint potential UDQS in Eq. 3. The applied restraints could force the generated structures to be trapped in physically irrelevant orientations that only satisfy the experimental DQS observables. To validate the orientational variability of the SSNMR-ED structures, we have carried out the 2D-PMF calculation as a function of WALP23's τ and ρ. Such a validation approach in SSNMR-ED is important for two reasons. First, the number of restraints (five DQSs) in the present SSNMR-ED simulation is not enough to perform reliable cross-validation. Second, a regular MD simulation often suffers from insufficient sampling to obtain a reliable and converged TM helix orientation distribution.
Fig. 7 A shows the resulting 2D-PMF of WALP23 in τ- and ρ-space. The free energy minimum is at τ = 36° and ρ = 112°, and the thermally accessible τ- and ρ-ranges are 27.7° ≤ τ ≤ 42.1° and 69° ≤ ρ ≤ 149°. The thermally accessible orientations are the regions that have free energies within 0.6 kcal/mol from the minimum-PMF orientation. The thermally accessible τ-region from the 2D-PMF is similar to that from the WALP23 PMFs as a function of τ in explicit DMPC membranes (14.4° ≤ τ ≤ 39°) (14). Similar to our previous work on a TM β-hairpin (37,38), as shown in Fig. 7 A, there is no significant energy barrier for TM helix rotation when τ < 10°, so that WALP23 can explore various ρ-values, but energy barriers along ρ become increased when τ > 10°.
Figure 7.
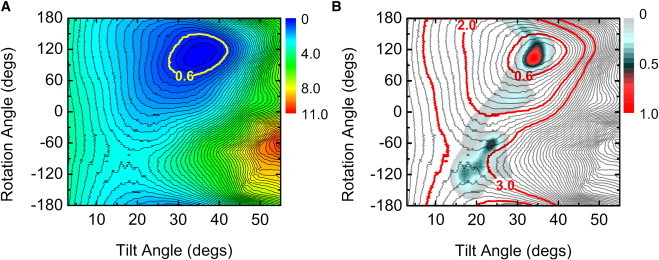
(A) 2D-PMF as a function of WALP23's τ and ρ. (Yellow line) Thermally accessible region. (B) Overlap of the ensemble structure distribution (when NREP = 32) and 2D-PMF. The contour lines (gray) are drawn every 0.2 kcal/mol. (Red line) 0.6, 2.0, and 3.0 kcal/mol from the PMF minimum.
Fig. 7 B compares the 2D-PMF with the SSNMR-ED ensemble structure distribution with NREP = 32 (Fig. 3). The high population in the ensemble structures well matches with the thermally accessible region in the 2D-PMF. Most structures from the SSNMR-ED are within 3.0 kcal/mol from the minimum-PMF orientation. This comparison clearly supports the notion that the orientation distribution of the ensemble structures from the SSNMR-ED simulations is physically relevant. The secondary structure of individual WALP23 is also well maintained during the SSNMR-ED simulations (data not shown). It should be noted that the SSNMR-ED distribution might not exactly match with the 2D-PMF because the SSNMR-ED distribution is obtained with the DQS restraints and could be deviated from the nonrestrained PMF calculation or the standard MD simulation. In this context, the agreement shown in Fig. 7 B is remarkable.
Interestingly, a total of 1.1-μs comparative (multiple) MD simulations (12) have yielded a DQS distribution similar to Fig. 5 (see Fig. 3 in Ozdirekcan et al. (12)). This, as an independent comparison, illustrates again that the present SSNMR-ED and the standard MD simulations do capture the physically relevant essential dynamic features of WALP23 in the bilayer membrane environment. Possibly due to sampling or/and force-field inaccuracy, the ensemble-averaged DQS from such standard MD simulations show some deviations from the experimental values, with the DQS RMSD of 20∼40 kHz for individual trajectories and ∼6 kHz for combined (ensemble) trajectories. Ironically, such deviations, which are considered too large to be acceptable in the experimental view point (17), provided motivation for the development of various models to consider TM helix dynamics and to seek better agreement with experimental observables, which will be discussed in the next section.
Various approaches in DQS interpretation
It was a molecular dynamics simulation study in an implicit membrane that showed a significantly large τ with a considerable fluctuation (τ = 32.7 ± 8.5°) (11), when the GALA-based interpretation of WALP23 was showing τ = 5.5 ± 0.9°. At that time, the discrepancy was attributed to unknown oligomer states of WALP23 in a bilayer (9) because oligomer formation could yield smaller τ (15,39). Now, there are several approaches/models proposed to resolve the discrepancy by considering the TM helix dynamics and orientational variability in the DQS interpretation. As mentioned at the end of the previous section, based on their long comparative MD simulations, Ozdirekcan et al. (12) proposed that the small τ of WALP23 estimated by the GALA method could be the result of orientation averaging in the τ- and ρ-space accessible to WALP23. However, due to an unknown free energy profile in τ- and ρ-space, it is still a challenging task to use standard MD simulations to determine the WALP23 orientational space and the extent of the orientational variability from which one can reliably calculate the DQS (or other SSNMR) observables. It is this reason why other approaches have been recently proposed to better understand the TM helix dynamics and orientational variability in the interpretation of experimental DQS values, particularly when the observed absolute values of DQS are small (40).
Esteban-Martín et al. (18) used empirical partition free energies of individual amino-acid residues from aqueous solution to a membrane bilayer, and calculated the relative population of WALP23 orientations in a rigid-body movement fashion. Such a population allows one to calculate the experimental DQS reasonably well. However, having a relatively high population at small τ appears to be problematic. As shown in Figs. 2 and 7, our previous PMF calculation and its decomposition (14,35) demonstrate that it is difficult to have small τ (usually <5°) for a single-pass TM helix in a bilayer environment due to the intrinsic tendency of TM helix tilting, driven by the entropic contribution arising from helix precession (area) around the membrane-normal. Therefore, the relatively high population in small τ, although necessary to reproduce the experimental data when using only positive DQS, could be physically questionable.
To take TM helix dynamic motion into account, additional fitting parameters were also introduced in the framework of the GALA method. In other words, the TM helix orientation distribution in τ- and ρ-space that satisfies the experimental DQS values are obtained by adjusting the variations of τ and ρ (i.e., δτ and δρ), in addition to τ and ρ themselves. Strandberg et al. (16) assume Gaussian distributions around average τ and ρ to adjust δτ and δρ. This procedure leads to larger values of τ (e.g., 14°−18° for WALP23 in DMPC). Also, the authors analyzed the influence of helix dynamics on the interpretation of DQS data by evaluating different dynamic models of increasing fitting parameter complexity. Very recently, extending this concept, Holt et al. (17) introduced a method using multiple anisotropic constraints, which combines nuclear interactions with different orientations with respect to helical axis. However, addition of fitting parameters in these approaches could be arbitrary and do not provide clear explanation for expressing dynamic information and orientational variability from SSNMR observables, because the TM helix orientation distribution may be neither uniform nor Gaussian, as illustrated by our results (Fig. 3). Unlike aforementioned approaches/models, the primary advantage of SSNMR-ED is the ability to generate an ensemble of structures (i.e., TM helix orientation distribution) that satisfies the experimental observables within a reasonable physical (force-field) model (Figs. 3 and 7), so that one can extract both TM helix orientation and dynamic information from SSNMR observables.
Conclusions
We have demonstrated that SSNMR-ED provides insights into the interpretation of experimental DQS data, one of the SSNMR observables, and can be used as a means to extract both TM helix orientation and dynamics information. In addition, the SSNMR-ED simulations of WALP23 also provide a realistic explanation of the discrepancy between MD simulation and GALA-based interpretation of DQS data. SSNMR-ED may provide a general strategy for the structural interpretation of the SSNMR observables, and one may apply this knowledge to investigating the influence of the TM helix orientation and its variability on the structure and function of biologically important systems.
Acknowledgments
The authors are grateful to Roger E. Koeppe II and Olaf S. Andersen for helpful discussion.
This work was supported by National Science Foundation MCB-0918374 and TeraGrid resources provided by Purdue University (NSF OCI-0503992).
References
- 1.Killian J.A., Salemink I., Greathouse D.V. Induction of nonbilayer structures in diacylphosphatidylcholine model membranes by transmembrane α-helical peptides: importance of hydrophobic mismatch and proposed role of tryptophans. Biochemistry. 1996;35:1037–1045. doi: 10.1021/bi9519258. [DOI] [PubMed] [Google Scholar]
- 2.de Planque M.R.R., Kruijtzer J.A.W., Killian J.A. Different membrane anchoring positions of tryptophan and lysine in synthetic transmembrane α-helical peptides. J. Biol. Chem. 1999;274:20839–20846. doi: 10.1074/jbc.274.30.20839. [DOI] [PubMed] [Google Scholar]
- 3.Andersen O.S., Koeppe R.E., 2nd Bilayer thickness and membrane protein function: an energetic perspective. Annu. Rev. Biophys. Biomol. Struct. 2007;36:107–130. doi: 10.1146/annurev.biophys.36.040306.132643. [DOI] [PubMed] [Google Scholar]
- 4.Holt A., Koehorst R.B.M., Killian J.A. Tilt and rotation angles of a transmembrane model peptide as studied by fluorescence spectroscopy. Biophys. J. 2009;97:2258–2266. doi: 10.1016/j.bpj.2009.07.042. [DOI] [PMC free article] [PubMed] [Google Scholar]
- 5.Cross T.A., Quine J.R. Protein structure in anisotropic environments: development of orientational constraints. Concepts Magn. Reson. 2000;12:55–70. [Google Scholar]
- 6.Opella S.J., Zeri A.C., Park S.H. Structure, dynamics, and assembly of filamentous bacteriophages by nuclear magnetic resonance spectroscopy. Annu. Rev. Phys. Chem. 2008;59:635–657. doi: 10.1146/annurev.physchem.58.032806.104640. [DOI] [PubMed] [Google Scholar]
- 7.Vostrikov V.V., Grant C.V., Koeppe R.E., 2nd Comparison of “polarization inversion with spin exchange at magic angle” and “geometric analysis of labeled alanines” methods for transmembrane helix alignment. J. Am. Chem. Soc. 2008;130:12584–12585. doi: 10.1021/ja803734k. [DOI] [PMC free article] [PubMed] [Google Scholar]
- 8.van der Wel P.C.A., Strandberg E., Koeppe R.E., 2nd Geometry and intrinsic tilt of a tryptophan-anchored transmembrane α-helix determined by 2H NMR. Biophys. J. 2002;83:1479–1488. doi: 10.1016/S0006-3495(02)73918-0. [DOI] [PMC free article] [PubMed] [Google Scholar]
- 9.Strandberg E., Ozdirekcan S., Killian J.A. Tilt angles of transmembrane model peptides in oriented and non-oriented lipid bilayers as determined by 2H solid-state NMR. Biophys. J. 2004;86:3709–3721. doi: 10.1529/biophysj.103.035402. [DOI] [PMC free article] [PubMed] [Google Scholar]
- 10.Ozdirekcan S., Rijkers D.T.S., Killian J.A. Influence of flanking residues on tilt and rotation angles of transmembrane peptides in lipid bilayers. A solid-state 2H NMR study. Biochemistry. 2005;44:1004–1012. doi: 10.1021/bi0481242. [DOI] [PubMed] [Google Scholar]
- 11.Im W., Brooks C.L., 3rd Interfacial folding and membrane insertion of designed peptides studied by molecular dynamics simulations. Proc. Natl. Acad. Sci. USA. 2005;102:6771–6776. doi: 10.1073/pnas.0408135102. [DOI] [PMC free article] [PubMed] [Google Scholar]
- 12.Ozdirekcan S., Etchebest C., Fuchs P.F. On the orientation of a designed transmembrane peptide: toward the right tilt angle? J. Am. Chem. Soc. 2007;129:15174–15181. doi: 10.1021/ja073784q. [DOI] [PubMed] [Google Scholar]
- 13.Esteban-Martín S., Salgado J. The dynamic orientation of membrane-bound peptides: bridging simulations and experiments. Biophys. J. 2007;93:4278–4288. doi: 10.1529/biophysj.107.113043. [DOI] [PMC free article] [PubMed] [Google Scholar]
- 14.Kim T., Im W. Revisiting hydrophobic mismatch with free energy simulation studies of transmembrane helix tilt and rotation. Biophys. J. 2010;99:175–183. doi: 10.1016/j.bpj.2010.04.015. [DOI] [PMC free article] [PubMed] [Google Scholar]
- 15.Monticelli L., Tieleman D.P., Fuchs P.F.J. Interpretation of 2H-NMR experiments on the orientation of the transmembrane helix WALP23 by computer simulations. Biophys. J. 2010;99:1455–1464. doi: 10.1016/j.bpj.2010.05.039. [DOI] [PMC free article] [PubMed] [Google Scholar]
- 16.Strandberg E., Esteban-Martín S., Ulrich A.S. Orientation and dynamics of peptides in membranes calculated from 2H-NMR data. Biophys. J. 2009;96:3223–3232. doi: 10.1016/j.bpj.2009.02.040. [DOI] [PMC free article] [PubMed] [Google Scholar]
- 17.Holt A., Rougier L., Milon A. Order parameters of a transmembrane helix in a fluid bilayer: case study of a WALP peptide. Biophys. J. 2010;98:1864–1872. doi: 10.1016/j.bpj.2010.01.016. [DOI] [PMC free article] [PubMed] [Google Scholar]
- 18.Esteban-Martín S., Giménez D., Salgado J. Orientational landscapes of peptides in membranes: prediction of 2H NMR couplings in a dynamic context. Biochemistry. 2009;48:11441–11448. doi: 10.1021/bi901017y. [DOI] [PubMed] [Google Scholar]
- 19.Bonvin A.M.J.J., Brünger A.T. Conformational variability of solution nuclear magnetic resonance structures. J. Mol. Biol. 1995;250:80–93. doi: 10.1006/jmbi.1995.0360. [DOI] [PubMed] [Google Scholar]
- 20.Lindorff-Larsen K., Best R.B., Vendruscolo M. Simultaneous determination of protein structure and dynamics. Nature. 2005;433:128–132. doi: 10.1038/nature03199. [DOI] [PubMed] [Google Scholar]
- 21.Richter B., Gsponer J., Vendruscolo M. The MUMO (minimal under-restraining minimal over-restraining) method for the determination of native state ensembles of proteins. J. Biomol. NMR. 2007;37:117–135. doi: 10.1007/s10858-006-9117-7. [DOI] [PubMed] [Google Scholar]
- 22.Lee J., Im W. Restraint potential and free energy decomposition formalism for helical tilting. Chem. Phys. Lett. 2007;441:132–135. [Google Scholar]
- 23.Im W., Lee J., Rui H. Novel free energy calculations to explore mechanisms and energetics of membrane protein structure and function. J. Comput. Chem. 2009;30:1622–1633. doi: 10.1002/jcc.21320. [DOI] [PubMed] [Google Scholar]
- 24.Lazaridis T., Karplus M. Effective energy function for proteins in solution. Proteins. 1999;35:133–152. doi: 10.1002/(sici)1097-0134(19990501)35:2<133::aid-prot1>3.0.co;2-n. [DOI] [PubMed] [Google Scholar]
- 25.Lazaridis T. Effective energy function for proteins in lipid membranes. Proteins. 2003;52:176–192. doi: 10.1002/prot.10410. [DOI] [PubMed] [Google Scholar]
- 26.Brooks B.R., Brooks C.L., 3rd, Karplus M. CHARMM: the biomolecular simulation program. J. Comput. Chem. 2009;30:1545–1614. doi: 10.1002/jcc.21287. [DOI] [PMC free article] [PubMed] [Google Scholar]
- 27.Jo S., Kim T., Im W. CHARMM-GUI: a web-based graphical user interface for CHARMM. J. Comput. Chem. 2008;29:1859–1865. doi: 10.1002/jcc.20945. [DOI] [PubMed] [Google Scholar]
- 28.Kumar S., Rosenberg J.M., Kollman P.A. The weighted histogram analysis method for free-energy calculations on biomolecules. I. The method. J. Comput. Chem. 1992;13:1011–1021. [Google Scholar]
- 29.Ryckaert J.-P., Ciccotti G., Berendsen H.J.C. Numerical integration of the Cartesian equations of motion of a system with constraints: molecular dynamics of n-alkanes. J. Comput. Phys. 1977;23:327–341. [Google Scholar]
- 30.Jo S., Im W. Transmembrane helix orientation and dynamics: insights from ensemble dynamics with solid-state NMR observables. Biophys. J. 2011;100:2913–2921. doi: 10.1016/j.bpj.2011.05.009. [DOI] [PMC free article] [PubMed] [Google Scholar]
- 31.Lee J., Chen J., Im W. Application of solid-state NMR restraint potentials in membrane protein modeling. J. Magn. Reson. 2008;193:68–76. doi: 10.1016/j.jmr.2008.04.023. [DOI] [PMC free article] [PubMed] [Google Scholar]
- 32.Davis J.H. The description of membrane lipid conformation, order and dynamics by 2H-NMR. Biochim. Biophys. Acta. 1983;737:117–171. doi: 10.1016/0304-4157(83)90015-1. [DOI] [PubMed] [Google Scholar]
- 33.Chen J., Im W., Brooks C.L., 3rd Application of torsion angle molecular dynamics for efficient sampling of protein conformations. J. Comput. Chem. 2005;26:1565–1578. doi: 10.1002/jcc.20293. [DOI] [PubMed] [Google Scholar]
- 34.Berendsen H.J.C., Postma J.P.M., Haak J.R. Molecular dynamics with coupling to an external bath. J. Chem. Phys. 1984;81:3684–3690. [Google Scholar]
- 35.Lee J., Im W. Transmembrane helix tilting: insights from calculating the potential of mean force. Phys. Rev. Lett. 2008;100:018103. doi: 10.1103/PhysRevLett.100.018103. [DOI] [PubMed] [Google Scholar]
- 36.Best R.B., Vendruscolo M. Determination of protein structures consistent with NMR order parameters. J. Am. Chem. Soc. 2004;126:8090–8091. doi: 10.1021/ja0396955. [DOI] [PubMed] [Google Scholar]
- 37.Lee J., Ham S., Im W. Beta-hairpin restraint potentials for calculations of potentials of mean force as a function of β-hairpin tilt, rotation, and distance. J. Comput. Chem. 2009;30:1334–1343. doi: 10.1002/jcc.21154. [DOI] [PubMed] [Google Scholar]
- 38.Rui H., Im W. Protegrin-1 orientation and physicochemical properties in membrane bilayers studied by potential of mean force calculations. J. Comput. Chem. 2010;31:2859–2867. doi: 10.1002/jcc.21580. [DOI] [PubMed] [Google Scholar]
- 39.Im W., Feig M., Brooks C.L., 3rd An implicit membrane generalized Born theory for the study of structure, stability, and interactions of membrane proteins. Biophys. J. 2003;85:2900–2918. doi: 10.1016/S0006-3495(03)74712-2. [DOI] [PMC free article] [PubMed] [Google Scholar]
- 40.Vostrikov V.V., Daily A.E., Koeppe R.E., 2nd Charged or aromatic anchor residue dependence of transmembrane peptide tilt. J. Biol. Chem. 2010;285:31723–31730. doi: 10.1074/jbc.M110.152470. [DOI] [PMC free article] [PubMed] [Google Scholar]