

Abstract
We report Monte Carlo simulations of the initial stages of self-assembly of the HIV-1 capsid protein (CA), using a coarse-grained representation that mimics the CA backbone structure and intermolecular contacts observed experimentally. A simple representation of N-terminal domain/N-terminal domain and N-terminal domain/C-terminal domain interactions, coupled with the correct protein shape, is sufficient to drive formation of an ordered lattice with the correct hexagonal symmetry in two dimensions. We derive an approximate concentration/temperature phase diagram for lattice formation, and we investigate the pathway by which the lattice develops from initially separated CA dimers. Within this model, lattice formation occurs in two stages: 1), condensation of CA dimers into disordered clusters; and 2), nucleation of the lattice by the appearance of one hexamer unit within a cluster. Trimers of CA dimers are important early intermediates, and pentamers are metastable within clusters. Introduction of a preformed hexamer at the beginning of a Monte Carlo run does not directly seed lattice formation, but does facilitate the formation of large clusters. We discuss possible connections between these simulations and experimental observations concerning CA assembly within HIV-1 and in vitro.
Introduction
The capsid (CA) shell, assembled from multiple copies of one or more CA proteins, is an essential structural component of all viruses that protects the viral genome from adverse environments and is tightly associated with the viral life cycle (1).Viruses with abnormal capsids exhibit low infectivity (1–4), making CA proteins potential antiviral drug targets (5–7). The basic principles governing the construction of symmetric capsids were elucidated almost 50 years ago (8), and the structures of many viral capsids have since been determined (9). However, the mechanisms of capsid formation remain unclear due to the fact that CA self-assembly is a rapid, dynamic process that is difficult to monitor in molecular-level detail by experiments. As an alternative, simulations based on experimental observations can contribute to our understanding of the self-assembly process. As CA self-assembly involves a large number of proteins, simulations of this process with a full atomic representation of each CA protein are not currently feasible, although all-atom simulations of the dynamics within a preassembled virus have been reported (10). Therefore, CA self-assembly simulations rely principally on coarse-grained (CG) models (11–23) or kinetic models based on differential equations (24–28). Theoretical analyses of CA geometries (29–32), energy landscapes for self-assembly (33,34), and self-assembly thermodynamics (25,35) have also been reported. To our knowledge, a high-resolution visualization of the initial stages of the self-assembly process has not been reported. Such visualization requires accurate representations of both the molecular structure and the intermolecular interactions of CA proteins.
The 25.6-kDa CA protein of HIV-1 consists of N-terminal and C-terminal domains (NTD and CTD) joined by a three-residue linker segment (36–40). The 146-residue NTD includes a β-hairpin and seven α-helices (37,38). The 82-residue CTD includes one 310-helix and four α-helices and contains a dimerization surface that causes both the CTD and the full-length CA to exist predominantly as dimers in solution at low ionic strength (39–41). The CA forms a conical shell within mature HIV-1, with dimensions of ∼120 nm × 60 nm (42,43). Other shapes within mature HIV-1 are also observed (43). CA shells within HIV-1 contain ∼1500 CA molecules. In vitro, recombinant HIV-1 CA self-assembles, at high ionic strength or upon addition of crowding agents, into various morphologies, including cones, tubes, and spheres (44–46). CA tubes and planar assemblies have been shown to be comprised of a two-dimensional (2D) triangular lattice of CA hexamers, usually called a hexagonal lattice (47–49). Within the hexagonal lattice, groups of six NTD units form the interiors of hexagons, which are joined by CTD-CTD dimerization. It is proposed that closed structures such as cones and spheres are constructed from the same lattice, but with incorporation of precisely 12 CA pentamers (42). The structures of engineered CA hexamers have been determined by x-ray crystallography (50), and detailed models for the hexagonal CA lattice have been developed by combining cryoelectron microscopy and electron diffraction data for CA lattices (48,49) with NTD and CTD structures from x-ray crystallography and NMR (36–40,49). Solid-state NMR studies of self-assembled HIV-1 CA provide further evidence that the NTD and CTD structures are retained within tubular (51) and nontubular (52) structures, and that both domains are largely immobilized in the CA lattice.
The process by which HIV-1 CA self-assembles is crucial to our understanding of both in vivo and in vitro structures. In this article, we present a CG model for HIV-1 CA that exhibits self-assembly into a hexagonal lattice in 2D Monte Carlo (MC) simulations. We focus on the 2D hexagonal lattice (rather than a closed shell that presumably includes pentamers), because such a lattice exists in HIV-1 tubes and planar assemblies that have been studied experimentally and constitutes most of the area of the conical capsids within mature HIV-1, and because hexagonal lattice formation represents the first test of our CG model. Our model includes the secondary and tertiary structure of HIV-1 CA, motivated by the hypothesis that the evolved shape of CA plays a crucial role in its self-assembly properties. Our model also includes a simple representation of attractive intermolecular interactions that derives from experimentally determined intermolecular contacts. Using this model, we characterize the stabilities of various CA oligomers, computationally derive an approximate concentration/temperature phase diagram for 2D lattice formation, and investigate the pathway by which an ordered lattice develops from an initial state in which CA dimers are well separated.
Methods
Description of the CG model
We represent HIV-1 CA by a bundle of solid cylinders, with the position, orientation, radius, and length of each cylinder adjusted to enclose the α-carbons of one helical segment of the protein, based on coordinates in Protein Data Bank (PDB) 3H47 (50) (Fig. 1 A). Since helix 7 in the NTD has a significant bend, we represent this helix by two cylinders, called 7a and 7b. Since CA molecules in solution exist as dimers (40,44,49), we use the twofold symmetric dimer structure (Fig. 1 B) as the basic unit in MC simulations, with geometry derived from PDB 3H47. Our own dynamic light scattering data indicate no detectable CA monomer at concentrations as low as 6 μM in 50 mM Tris buffer, pH 8, 22°C. We neglect all dynamics within a dimer, consistent with solid-state NMR evidence that both the NTD and the CTD are immobilized in the final CA lattice (51,52). As discussed below, hinge motions about the short linker between NTD and CTD, suggested as a source of pentamer/hexamer quasiequivalence (49,50), may be included in future studies. Solution NMR spectra of full-length CA dimers reported by Byeon et al. (49) show pronounced line broadening of NTD crosspeaks (compared with spectra of the isolated NTD), suggesting that NTD/CTD hinge motions are restricted in the unassembled state.
Figure 1.
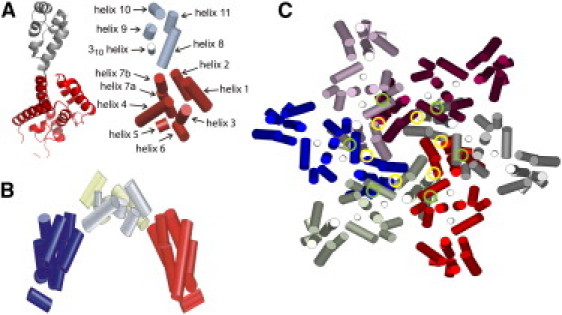
(A) Comparison of the full HIV-1 CA structure (left) with the CG model (right), with NTD and CTD shaded dark and light (red and gray on-line), respectively. (B) CG model for CA dimer, with NTDs in different shades (blue and red on-line). (C) A hexamer formed by six CA dimers, each in a different shade. Circles indicate sites of intermolecular NTD-NTD and NTD-CTD interactions that are included in the CG model.
Our MC simulations include hard-wall intermolecular repulsions among all cylinders (algorithm described in the Supporting Material) and a small number of attractive intermolecular interactions (four sites per CA monomer). By examining PDB file 3H47, we find that the shortest intermolecular NTD-NTD distances within a CA hexamer are between helices 2 and 3, whereas the shortest intermolecular NTD-CTD distances are between helices 4 and 8. Therefore, we define attractive intermolecular interactions between the corresponding cylinders of CA molecules in different dimers, indicated by green and yellow circles in Fig. 1 C. The intermolecular potential energy is expressed as a sum of terms with the form
| (1a) |
| (1b) |
| (1c) |
f(θ) is an angular weighting function that represents the orientation dependence of CA interactions, where θ is the angle between cylinders, θ0 is the angle in the experimental CA hexamer structure (50), and θmax is a cutoff angle (set to 2π/3 in our simulations) beyond which attractive interactions are zero. g(r) is a Lennard-Jones potential, where r is the distance between the centers of the interacting cylinders, and σ (which determines the minimum-energy distance r = 1.1225σ) is set to match helix-helix distances in the hexamer structure. For NTD-NTD interactions (involving cylinders 2 and 3), σ = 0.90673 nm, ɛ0 = 2.0 kcal/mol, and θ0 = 39.9°. For NTD-CTD interactions (involving cylinders 4 and 8), σ = 17.1305 nm, ɛ0 = 2.0 kcal/mol, and θ0 = 11.7°.
CA self-assembly is affected by ionic strength and pH (44,53), both of which modulate intermolecular interactions. In our model, the minimum interaction energy is −4ɛ0/CA monomer, since each monomer can interact via two NTD-NTD and two NTD-CTD contacts. To capture the dependence on solution conditions in our simulations, we varied the dimensionless interaction strength ɛ′ ≡ 4ɛ0/RT by varying the temperature T.
Simulations
We performed MC simulations in 2D, with the center of mass (COM) of each CA dimer restricted to a square with periodic boundary conditions and with the twofold symmetry axis of each dimer perpendicular to the square. In each MC step, a translational and rotational move was applied to one CA dimer (chosen sequentially) and accepted or rejected according to the standard Metropolis scheme (54) using the potential energy described above. Translational moves were randomly chosen between 0.0 and 0.1 nm, in random directions. Rotational moves were randomly chosen between −10° and +10° about the two-fold symmetry axis. Typical acceptance probabilities were 25%. For simplicity, MC simulations were used instead of full molecular dynamics (16,17,21), discontinuous molecular dynamics (13,14,22) or Brownian dynamics (11,12,18,23). It has been shown that MC simulations with small moves are equivalent to Brownian dynamics (55,56). Moreover, a more elaborate treatment of the dynamics is unwarranted, given the approximations in our CG model (e.g., the absence of internal motions and solvent). By equating the translational diffusion constant for a single dimer in our MC simulations with the experimental value from dynamic light scattering (4.47 × 10⁻⁷ cm2/s at 22°C), we estimate that one MC step per CA dimer corresponds to ∼100 ps of real time.
To investigate the stability of putative intermediates in the self-assembly process, CA oligomers shown in Fig. 2 were generated by simulated annealing, starting with the appropriate number of CA dimers at random positions. Two distinct configurations were identified for groups of three, four, and six CA dimers, called trimer1, trimer2, tetramer1, tetramer2, hexamer1, and hexamer2. One thousand constant-temperature MC simulations were then performed on each oligomer until it dissociated. An oligomer was considered to have dissociated when the interaction energy of any dimer with its closest neighbor became >−0.005ɛ0 and the distance between their COMs became >10 nm. Fig. 2 I shows an example of a dissociated hexamer2.
Figure 2.
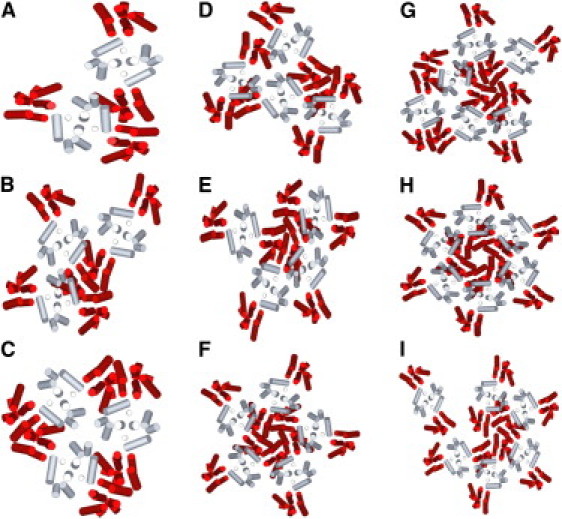
CA oligomer configurations identified by simulated annealing. (A–F) Dimer, trimer1, trimer2, tetramer1, tetramer2, pentamer, hexamer1, and hexamer2 configurations, respectively, with the oligomerization number being the number of CA dimers. (I) Dissociated hexamer2.
In MC simulations for isolated dimer, trimer2, and hexamer2 units, the root mean-squared displacement is proportional to the square root of the number of MC steps per CA dimer, as expected for diffusional motion, with diffusion constants nearly proportional to n−1/2, where n is the oligomer size (Fig. S1 in the Supporting Material).
To investigate lattice formation, constant-temperature MC simulations were performed on sets of 36 CA dimers in (periodic) square areas that were varied to produce variations in protein concentration. Starting with CA dimers on a square lattice, the system was heated to 10,000 K for 105 MC steps to randomize positions and orientations before the temperature was set to the desired value. To monitor the self-assembly mechanism, multiple simulations were performed for 2.6 × 10⁶ steps/CA dimer, sufficient to observe the nucleation and growth of the hexagonal lattice, at various CA concentrations and temperatures. COM coordinates and orientations were stored every 5 s (∼170 steps/dimer), and movies were generated from the stored configurations at 10 frames/s (see Supporting Material). To construct the phase diagram, simulations were run for 7 days (∼2 × 10⁷ steps/dimer), and the system configuration was stored every 600 s.
Simulation programs were coded in Fortran95 and run on the National Institutes of Health Biowulf cluster, with 2.8-GHz AMD Opteron CPUs. Figures and movies were generated in MATLAB (The MathWorks, Natick, MA), with the exception of Fig. 1 A, which was created with PyMOL.
Results
Stability of CA oligomers
For each annealed oligomer configuration in Fig. 2, 1000 dissociation simulations were performed at fixed temperatures. Fig. 3, A and B, shows plots of the percentage of simulations in which the dissociation time (see above) was less than a given value, in MC steps per CA dimer, at various temperatures. As expected, the average lifetime, τ, of each oligomer (defined as the time by which 50% of the simulations had reached dissociation) decreased with increasing temperature. Fig. 3 C shows that lnτ is approximately proportional to 1/T for each oligomer, allowing activation energies, Ea, for dissociation of each oligomer to be determined from an Arrhenius law, τ = τ0exp(Ea/RT). As shown in Fig. 4 D, oligomer configurations fall into two groups. The more stable group, with Ea > 4.5 kcal/mol, includes hexamer2, pentamer, and trimer2 (Fig. 2, C, F, and H). The less stable group, with Ea < 3.6 kcal/mol, includes the remaining configurations. It is interesting that the more stable oligomers have structures that appear in the hexagonal CA lattice (hexamer2 and trimer2) or in models for closed CA shells (hexamer2, pentamer, and trimer2). Each CA dimer in the more stable oligomers interacts with two neighboring dimers, compared with 1–1.5 neighboring dimers in the less stable oligomers.
Figure 3.
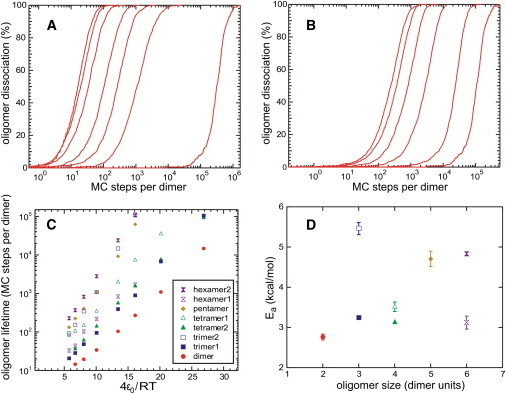
(A) Time dependence of dissociation probability for a dimer of CA dimers. Curves from left to right are from simulations at ɛ′ = 6.72, 8.06, 10.08, 13.44, 16.12, 20.16, and 26.87. (B) Time dependence of dissociation probability for a hexamer2 of CA dimers. Curves from left to right are from simulations at ɛ′ = 5.76, 6.72, 8.06, 10.08, 13.44, and 16.12. (C) Lifetime versus ɛ′ for oligomer configurations in Fig. 2. (D) Activation energies for dissociation, extracted from C.
Figure 4.
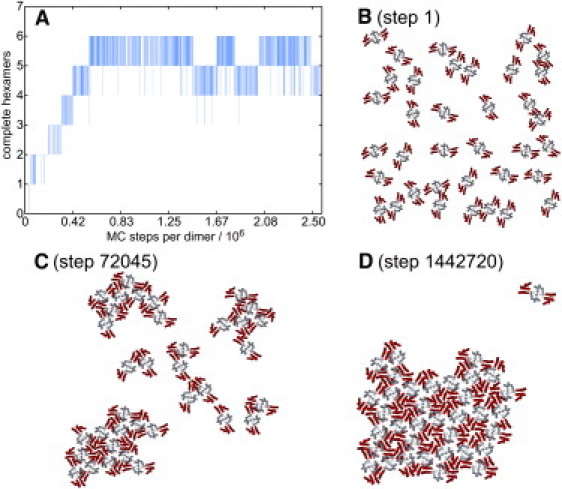
(A) Progress curve for self-assembly of 36 CA dimers at ɛ′ = 13.44 and [CA]2D = 0.016 nm−2. (B–D) Configurations after indicated numbers of MC steps per dimer.
This stability analysis predicts that trimer2 may be an important intermediate configuration in the CA self-assembly process. Since trimer2 units occur in the 2D hexagonal lattice, such intermediates can be on-pathway. Pentamers are also predicted to be important intermediates, which can be either off-pathway or on-pathway depending on whether they tend to dissociate or to convert to hexamers by addition of one more CA dimer. In three-dimensional (3D) simulations, pentamers could persist as on-pathway intermediates.
Assembly kinetics
To investigate CA self-assembly, 2D MC simulations on 36 CA dimers were performed at various temperatures and concentrations. As a measure of self-assembly progress, the time dependence of the number of assembled hexamers was calculated from stored system configurations, using a straightforward geometric algorithm (see Supporting Material). In principle, 36 CA dimers can form a maximum of eight complete hexamers. In practice, fully assembled lattices contained six to eight hexamers in our simulations.
Fig. 4 A shows the time dependence of lattice formation in a representative run at 300 K (ɛ′ = 13.4) and at a 2D concentration ([CA]2D) of 0.016 nm−2 (same average intermolecular distance as [CA] = 2.38 mM in 3D). For comparison, the experimentally determined hexagonal lattice structure has [CA]2D = 0.081 nm−2 (48). Fig. 4 B shows the initial randomized configuration of the system. After starting the self-assembly simulation by switching to 300 K, CA dimers form dynamically disordered clusters during a short lag period, until one hexamer appears within a cluster of 14 dimers (Fig. 4 C). Additional hexamers appear in a stepwise manner as the cluster grows, reaching a 2D lattice with 5 ± 1 complete hexamers within ∼5 × 10⁵ MC steps/dimer. The structure at the boundaries of the lattice continues to fluctuate. Fig. 4 D shows a typical configuration in this asymptotic equilibrium state. The successful assembly of CA dimers into hexagonal lattice shows that our CG model captures the essential structural features of the HIV-1 CA ground state in 2D.
The dependence of self-assembly kinetics on CA dimer concentration is shown in Fig. 5 A, which compares progress curves at 300 K for [CA]2D = 0.016 nm−2 and [CA]2D = 0.052 nm−2. Each curve is the average of 10 independent MC runs, each of which extends to 2.6 × 10⁶ MC steps/dimer. On average, higher concentration leads to a shorter lag period and a more rapid initial lattice growth. The longer single runs in Fig. 5 B (to 2.2 × 10⁷ MC steps/dimer) show that the lower concentration allows lattice formation to proceed nearly to completion, whereas the higher concentration can lead to a state in which lattice formation is blocked by congestion.
Figure 5.

Progress curves for self-assembly under various conditions. (A and B) ɛ′ = 13.4 and indicated concentrations. (C and D) [CA]2D = 0.052 nm−2 and indicated ɛ′. (E) ɛ′ = 13.4 and [CA]2D = 0.016 nm−2, with and without a hexamer seed in the initial configuration. Curves in A, C, and E are averages of 10 runs. Curves in B, D, and F are single runs.
The dependence of self-assembly kinetics on ɛ′ is shown in Fig. 5 C, which compares progress curves at 550 K, 300 K, and 150 K, all with [CA]2D = 0.052 nm−2. Again, each curve is the average of 10 independent runs. At the lowest temperature (largest ɛ′), development of an ordered hexagonal lattice is relatively slow, as disordered clusters of CA dimers develop at the beginning and dissociate slowly. This behavior is analogous to the kinetic trapping discussed in previous simulations of capsid self-assembly (11,13,27). At the highest temperature (smallest ɛ′), strong fluctuations in the number of complete hexamers are evident, due to the relatively weak binding of CA dimers at the boundaries of the growing lattice. The longer single runs in Fig. 5 D show that the relatively high CA dimer concentration can prevent lattice growth, as in Fig. 5 B.
Fig. 5 E compares progress curves for seeded simulations, in which a single preformed hexamer of dimers was introduced after the initial randomization, with unseeded simulations. In both cases, T = 300 K and [CA]2D = 0.016 nm−2. Although the hexamer seed dissociates quickly, and therefore does not directly nucleate the hexagonal lattice, the initial stage of lattice growth is more rapid on average in the seeded simulations. We attribute this effect to the earlier appearance of larger clusters of CA dimers in the seeded simulations, which allows a larger number of hexamers to form quickly. The longer single runs in Fig. 5 F show that both seeded and unseeded simulations can approach the maximum lattice size.
Phase diagram for 2D lattice formation
A series of long simulations (1.7–2.2 × 10⁷ MC steps/dimer) was performed over ranges of ɛ′ and [CA]2D. Fig. 6 A shows the number of hexamers formed in each simulation (averaged over the plateau period of each simulation), which we define to be the assembly efficiency. With ɛ′ ≤ 8, assembly efficiencies are low because large clusters are unstable even at the highest concentrations. With ɛ′ > 8, assembly efficiencies can be high, but the value of [CA]2D that produces the highest efficiency shifts from [CA]2D > 0.04 nm−2 when 8 < ɛ′ ≤ 12.4 to [CA]2D < 0.02 nm−2 when ɛ′ ≥ 13.0. This effect arises from congestion that prevents complete lattice formation within the accessible simulation time at high concentrations and high interaction strengths. At [CA]2D ≈ 0.05 nm−2 (250 dimers/104 nm2 in Fig. 6 A), the drop in assembly efficiency above ɛ′ = 12.4 resembles a glass transition (18,19,22).
Figure 6.

(A) Dependence of assembly efficiency on CA concentration at indicated values of ɛ′. (B) Approximate phase diagram for CA self-assembly, with colors representing assembly efficiency. Dashed line is the concentration in the experimentally determined hexagonal lattice (48). Crosses are points where preassembled hexagonal lattices dissociated completely in MC simulations, proving that they are outside the phase boundary.
Fig. 6 B shows the assembly efficiency as a function of ɛ′ and [CA]2D in a representation that we interpret as an approximate phase diagram for CA self-assembly in 2D, with blue and green points being conditions where the hexagonal lattice is thermodynamically stable, and red and yellow points being the approximate phase boundary. Black crosses are points where we verified that a preassembled hexagonal lattice dissociates completely in MC simulations. The lattice is stable over a factor of >2 in ɛ′ and a factor of >10 in [CA]2D.
Self-assembly mechanism
Fig. 7 shows snapshots from a trajectory at [CA]2D = 0.016 nm−2 and ɛ′ = 13.4. As predicted by the oligomer stability analysis (see above and Fig. 3), trimer2 units are important metastable species in early stages of the trajectory, whereas other small oligomers are unstable (Fig. 7, A and B).Trimer2 units frequently bind together to form larger clusters. Rearrangements within these clusters can produce pentamers (Fig. 7 C), which persist for variable periods but do not lead directly to an ordered lattice. Eventually, pentamers are disrupted (Fig. 7 D) or convert to a hexamer by insertion of an additional CA dimer unit (Fig. 7 E). Hexamers can also develop within a CA cluster that does not contain any pentamers. Once a single hexamer forms within a CA cluster, it persists indefinitely and nucleates the hexagonal lattice (Fig. 7 F). Occasionally, heptamers are observed at the edge of the lattice (Fig. 7 F), but heptamers are only metastable. The stability of a hexamer within a larger cluster arises from its interactions with additional CA dimers, which result in the formation of trimer2 units around the perimeter of the hexamer (Fig. 7 E, blue triangles). The center of each of these units ultimately becomes a point of threefold symmetry in the hexagonal lattice.
Figure 7.
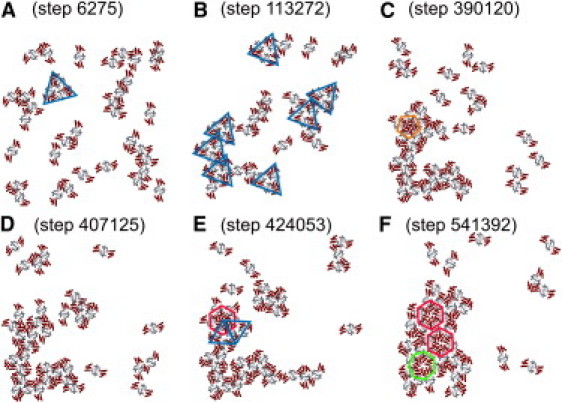
Configurations at the indicated steps/CA dimer from a typical MC run at ɛ′ = 13.4 and [CA]2D = 0.016 nm−2. (A and B) Triangles indicate trimer2 configurations, which are important self-assembly intermediates. (C) Pentagon indicates metastable pentamer configuration. (D) Pentamers are disrupted. (E) Trimer2 configurations stabilize hexamers within CA clusters. (F) Heptagon indicates metastable heptamer configuration. Once a single hexamer forms within a cluster, it persists and nucleates additional hexamers.
Movie S1 in the Supporting Material contains another trajectory at [CA]2D = 0.016 nm−2 and ɛ′ = 13.4, in which a similar pathway is observed. Movie S2 contains a trajectory from a seeded simulation, also at [CA]2D = 0.016 nm−2 and ɛ′ = 13.4. In this trajectory, the hexamer that is initially present quickly dissociates. The self-assembly mechanism then proceeds as in the unseeded simulation described above.
Movie S3 contains a trajectory at [CA]2D = 0.016 nm−2 and ɛ′ = 26.9. At this lower temperature, disordered clusters of CA dimers persist for longer periods. The clusters form linear chains, which then fold on themselves to form more compact configurations. Rearrangements within clusters are slow, as is dissociation of individual dimers from clusters. Therefore, lattice formation is inefficient and is not observed before the end of the simulation. In this trajectory, one chain folds to form a heptamer, which eventually converts to a single, stable hexamer. Pentamers also develop independently, but they are not stable.
Movie S4 contains a trajectory at [CA]2D = 0.052 nm−2 and ɛ′ = 7.3. At this higher concentration, the system is initially a single, porous cluster. Trimer2 units form frequently within the system, but they are transient. Pentamers also appear transiently. Once one hexamer develops, the hexagonal lattice spreads through the system rapidly. Since the lattice does not fill the available area, CA dimers at the edges continue to dissociate and rebind.
The importance of trimer2 units as intermediates in the self-assembly process is evident from an analysis of multiple trajectories at [CA]2D = 0.016 nm−2 and ɛ′ = 13.4 (Fig. S2), which shows that large trimer2 populations develop consistently at early stages (∼2 × 10⁵ MC steps/dimer), whereas hexamers develop significantly later (∼2 × 10⁶ steps/dimer).
Discussion
Principal results
The simulations described above demonstrate that a CG model that captures the overall shape of HIV-1 CA and includes a simple representation of intermolecular interactions to favor native contacts is sufficient to produce self-assembly into a 2D hexagonal lattice. The protein has evolved to form such a lattice. The fact that helices 1–3 of the NTD form a wedge with an angle of ∼60°, which allows six NTDs to form the interior of a hexagon, appears to be one important evolved property. Dimerization through CTD-CTD interactions imparts positions and orientations to six additional NTDs that are appropriate for their participation in six additional hexagons. Thus, the relatively strong dimerization interactions are apparently another evolved property that facilitates capsid formation in HIV-1. As pointed out by Ganser-Pornillos et al. (48), CTD dimerization is not a universal property of retroviral capsid proteins. Moreover, mutations that abolish dimerization interfere with HIV-1 CA self-assembly in vitro and reduce infectivity in vivo (2,4,45). The precise details of other intermolecular interactions may be less important, provided they are not strongly repulsive in a hexagonal lattice configuration. Our observation that lattice formation is relatively efficient over broad ranges of concentration and temperature supports this idea (Fig. 6 B). It has been observed in experiments that HIV-1 CA self-assembly into ordered lattices occurs over ranges of ionic strength and pH and is not prevented by changes in overall charge (57–59).
Before performing MC simulations, we hypothesized that hexamers of CA dimers might act as critical nuclei for lattice formation, as in standard models of nucleated polymerization (24,26,60). In other words, a single hexamer (as in Fig. 2 H) might be sufficiently stable to grow into a lattice by binding additional dimers, whereas smaller oligomers would usually dissociate before growing. The simulations do not support this hypothesis. Instead, CA dimers first coalesce into disordered clusters. Lattice formation is then nucleated by the appearance of a single hexamer within a larger cluster. Isolated hexamers of CA dimers are not stable and do not nucleate lattice formation.
It was surprising to find that trimer2 units (as in Fig. 2 C) are prevalent intermediate structures, both as discrete entities in the early stages of self-assembly and as components of the CA clusters in intermediate stages. Trimer2 configurations also contribute to the enhanced stability of hexamers within clusters (as in Fig. 7 E). Dimerization through CTD-CTD interactions is essential for the stability of trimer2 configurations, perhaps contributing to the observed effects of CTD mutations on capsid assembly and viral infectivity (2,4,45).
Comparison with experimental observations
Gross et al. (53) estimated the critical concentration for HIV-1 CA self-assembly in vitro to be 2 mg/ml (78 μM) at pH 6 or 1 mg/ml (39 μM) at pH 8 and 1 M NaCl. Del Álamo et al. (57) found a critical concentration of 5.6 μM at pH 7.8 and 2.25 M NaCl. The lower concentration limit of ∼2 dimers/104 nm2 (Fig. 6 B) corresponds to a 3D concentration of 9.4 μM. Interaction energies in our simulations are comparable to values reported for the hepatitis B virus (61) and calculated for other systems (33).
Experimental timescales for CA self-assembly in vitro are 1–10 min (59), corresponding to 6–60 × 1011 MC steps/dimer according to the estimate above. Thus, intermolecular separations in our simulations have values comparable to those seen in experiments, but self-assembly is more rapid by factors of 105–106 (see Fig. 5). This acceleration may be attributed, at least in part, to the restriction of all motions to 2D. In particular, confinement to 2D reduces the importance of orientational and translational entropy and may eliminate local minima in the intermolecular interaction potentials that would otherwise impede self-assembly It is worth noting that capsid assembly within HIV-1 takes place in a quasi-2D volume, as CA is released from the Gag polyprotein by proteolytic cleavage between the matrix (MA) and CA segments of Gag, starting from a 2D Gag layer that lines the inner surface of the viral membrane. Immature HIV-1 has been estimated to contain ∼5000 Gag proteins (62). Based on the dimensions of the virus (63), the average 2D concentration of CA near the viral membrane is then ∼0.09 nm−2, even higher than in our simulations. Little is known about the kinetics of CA self-assembly within HIV-1, but the timescale may be considerably shorter than that observed in vitro.
Experimental data of Douglas et al. (58) indicate that the in vitro self-assembly rate of wild-type HIV-1 CA at 2.25 M NaCl is roughly proportional to the third power of the protein concentration. These data may be interpreted as evidence that formation of trimers of CA dimers is a rate-limiting step for self-assembly. Direct experimental evidence for trimer2 species under conditions that favor self-assembly has not been reported, but our simulations provide stimulus for future experiments to detect such species, for example by dynamic light scattering, analytical ultracentrifugation, or rapid photochemical cross-linking (64). The importance of CTD-CTD interactions at sites of threefold symmetry in the hexagonal lattice (corresponding to local configurations similar to trimer2) has been emphasized by Byeon et al. (49). Their cryo-EM data suggest direct interactions between helices 10 and 11. Such interactions are not included as attractive potentials in our current CG model, but could be included in future studies. Trimer2 configurations are stabilized by NTD-NTD and CTD-NTD interactions in our simulations.
Comparison with previous simulations
Previous simulations of capsid self-assembly using CG models have focused primarily on the formation of capsids with icosahedral symmetry in other viruses (11–20,22,23), whereas our simulations focus on the planar hexagonal lattice found in HIV-1 CA assemblies in vitro and as a major component of conical capsids within HIV-1. The representation of HIV-1 CA as two bundles of cylinders with dimensions and geometry that mimic the helices of the NTD and CTD (Fig. 1 A) is an important novel aspect of our CG model that captures the shape of the real protein, allowing intermolecular interactions to be represented by a small number of terms with the simple form in Eq. 1 to favor native contacts. Previous CG models have used representations that do not take into account the details of the protein shape, instead using spheres (18,23), collections of spheres (13,22), or simple shapes such as trapezoids, pentagons, and hexagons (13,19,34). Representations that do not mimic the true protein shape require the imposition of anisotropic interactions that are engineered to produce the desired intermolecular packing (18,23). It is interesting to note that in MC simulations of icosahedral self-assembly by anisotropically interacting spheres, Wilber et al. observed a self-assembly mechanism that resembles the mechanism described above for 2D self-assembly of HIV-1 CA, i.e., icosahedra form within larger disordered clusters (65). An important difference is that the icosahedra subsequently separate from the larger cluster in the simulations of Wilber et al., whereas the 2D cluster crystallizes into a hexagonal lattice in our simulations.
Krishna et al. (21) have performed simulations on HIV-1 capsids using models in which CA dimers (permanently joined, as in our simulations) were represented by four or eight spheres, with intramolecular interactions derived from all-atom simulations and with anisotropic and three-body intermolecular interactions. The starting points for these simulations were preassembled CA tubes or shells in 3D, and the goal was to determine the equilibrium lattice structures for closed capsids. Thus, our simulations address different issues than those addressed by Krishna et al. It is interesting that Krishna et al. found hexagonal lattices at equilibrium (rather than close-packed lattices) only when the NTD was represented by three spheres with the wedgelike shape of the real NTD. A model for CA with additional sites was used by Ayton and Voth in CG simulations of immature HIV-1, in which partial hexagonal order was observed for membrane-associated Gag (66).
Extensions
Future refinements of our CG model may include incorporation of hinge motions between NTD and CTD units and development of more realistic sets of intermolecular interactions. An obvious next step is to extend our simulations to 3D to investigate how lattice curvature develops and is affected by hinge motions (11,49,50), the relative strengths of various intermolecular interactions, and the balance between pentamer and hexamer formation. Questions yet to be answered include Why does HIV-1 CA form tubes rather than jelly rolls? Why do certain mutations or solvent conditions promote self-assembly into closed structures rather than tubes? Are closed lattices nucleated by stable pentamers rather than hexamers? and What limits the number of pentamers to 12?
For computational feasibility, 3D simulations may be performed in a quasi-2D manner, for example by confining CA dimers close to a surface (15), attracting CA dimers to a surface (12), or starting with a preassembled tube or shell (21). Given that CA is released from a membrane-associated Gag lattice by proteolysis during HIV-1 maturation (62,63), such approaches may be biologically relevant. MC simulations with translational and rotational motions in 3D indicate that preformed hexagonal lattice remains stable in 3D for our current model of CA dimer interactions (Fig. S3), although formation of lattice from a disordered initial state has not yet been achieved.
Acknowledgments
This work was supported by the Intramural Research Program of the National Institute of Diabetes and Digestive and Kidney Diseases of the National Institutes of Health, and by the National Institutes of Health Intramural AIDS Targeted Antiviral Program. Computational facilities of the Helix Systems at the National Institutes of Health were used in this work.
Supporting Material
References
- 1.Göttlinger H.G., Sodroski J.G., Haseltine W.A. Role of capsid precursor processing and myristoylation in morphogenesis and infectivity of human immunodeficiency virus type 1. Proc. Natl. Acad. Sci. USA. 1989;86:5781–5785. doi: 10.1073/pnas.86.15.5781. [DOI] [PMC free article] [PubMed] [Google Scholar]
- 2.Abdurahman S., Höglund S., Vahlne A. Selected amino acid substitutions in the C-terminal region of human immunodeficiency virus type 1 capsid protein affect virus assembly and release. J. Gen. Virol. 2004;85:2903–2913. doi: 10.1099/vir.0.80137-0. [DOI] [PubMed] [Google Scholar]
- 3.von Schwedler U.K., Stemmler T.L., Sundquist W.I. Proteolytic refolding of the HIV-1 capsid protein amino-terminus facilitates viral core assembly. EMBO J. 1998;17:1555–1568. doi: 10.1093/emboj/17.6.1555. [DOI] [PMC free article] [PubMed] [Google Scholar]
- 4.von Schwedler U.K., Stray K.M., Sundquist W.I. Functional surfaces of the human immunodeficiency virus type 1 capsid protein. J. Virol. 2003;77:5439–5450. doi: 10.1128/JVI.77.9.5439-5450.2003. [DOI] [PMC free article] [PubMed] [Google Scholar]
- 5.Tang C., Loeliger E., Summers M.F. Antiviral inhibition of the HIV-1 capsid protein. J. Mol. Biol. 2003;327:1013–1020. doi: 10.1016/s0022-2836(03)00289-4. [DOI] [PubMed] [Google Scholar]
- 6.Sticht J., Humbert M., Kräusslich H.G. A peptide inhibitor of HIV-1 assembly in vitro. Nat. Struct. Mol. Biol. 2005;12:671–677. doi: 10.1038/nsmb964. [DOI] [PubMed] [Google Scholar]
- 7.Zhou J., Yuan X., Chen C.H. Small-molecule inhibition of human immunodeficiency virus type 1 replication by specific targeting of the final step of virion maturation. J. Virol. 2004;78:922–929. doi: 10.1128/JVI.78.2.922-929.2004. [DOI] [PMC free article] [PubMed] [Google Scholar]
- 8.Caspar D.L.D., Klug A. Physical principles in the construction of regular viruses. Cold Spring Harb. Symp. Quant. Biol. 1962;27:1–24. doi: 10.1101/sqb.1962.027.001.005. [DOI] [PubMed] [Google Scholar]
- 9.Reddy V.S., Natarajan P., Johnson J.E. Virus Particle Explorer (VIPER), a website for virus capsid structures and their computational analyses. J. Virol. 2001;75:11943–11947. doi: 10.1128/JVI.75.24.11943-11947.2001. [DOI] [PMC free article] [PubMed] [Google Scholar]
- 10.Freddolino P.L., Arkhipov A.S., Schulten K. Molecular dynamics simulations of the complete satellite tobacco mosaic virus. Structure. 2006;14:437–449. doi: 10.1016/j.str.2005.11.014. [DOI] [PubMed] [Google Scholar]
- 11.Elrad O.M., Hagan M.F. Mechanisms of size control and polymorphism in viral capsid assembly. Nano Lett. 2008;8:3850–3857. doi: 10.1021/nl802269a. [DOI] [PMC free article] [PubMed] [Google Scholar]
- 12.Hagan M.F. Controlling viral capsid assembly with templating. Phys. Rev. E. 2008;77:051904. doi: 10.1103/PhysRevE.77.051904. [DOI] [PMC free article] [PubMed] [Google Scholar]
- 13.Nguyen H.D., Brooks C.L., 3rd Generalized structural polymorphism in self-assembled viral particles. Nano Lett. 2008;8:4574–4581. doi: 10.1021/nl802828v. [DOI] [PMC free article] [PubMed] [Google Scholar]
- 14.Nguyen H.D., Reddy V.S., Brooks C.L., 3rd Invariant polymorphism in virus capsid assembly. J. Am. Chem. Soc. 2009;131:2606–2614. doi: 10.1021/ja807730x. [DOI] [PMC free article] [PubMed] [Google Scholar]
- 15.Zandi R., Reguera D., Rudnick J. Origin of icosahedral symmetry in viruses. Proc. Natl. Acad. Sci. USA. 2004;101:15556–15560. doi: 10.1073/pnas.0405844101. [DOI] [PMC free article] [PubMed] [Google Scholar]
- 16.Arkhipov A., Freddolino P.L., Schulten K. Stability and dynamics of virus capsids described by coarse-grained modeling. Structure. 2006;14:1767–1777. doi: 10.1016/j.str.2006.10.003. [DOI] [PubMed] [Google Scholar]
- 17.Arkhipov A., Roos W.H., Schulten K. Elucidating the mechanism behind irreversible deformation of viral capsids. Biophys. J. 2009;97:2061–2069. doi: 10.1016/j.bpj.2009.07.039. [DOI] [PMC free article] [PubMed] [Google Scholar]
- 18.Hagan M.F., Chandler D. Dynamic pathways for viral capsid assembly. Biophys. J. 2006;91:42–54. doi: 10.1529/biophysj.105.076851. [DOI] [PMC free article] [PubMed] [Google Scholar]
- 19.Johnston I.G., Louis A.A., Doye J.P.K. Modelling the self-assembly of virus capsids. J. Phys. Condens. Mat. 2010;22:104101. doi: 10.1088/0953-8984/22/10/104101. [DOI] [PubMed] [Google Scholar]
- 20.Kivenson A., Hagan M.F. Mechanisms of capsid assembly around a polymer. Biophys. J. 2010;99:619–628. doi: 10.1016/j.bpj.2010.04.035. [DOI] [PMC free article] [PubMed] [Google Scholar]
- 21.Krishna V., Ayton G.S., Voth G.A. Role of protein interactions in defining HIV-1 viral capsid shape and stability: a coarse-grained analysis. Biophys. J. 2010;98:18–26. doi: 10.1016/j.bpj.2009.09.049. [DOI] [PMC free article] [PubMed] [Google Scholar]
- 22.Nguyen H.D., Reddy V.S., Brooks C.L., 3rd Deciphering the kinetic mechanism of spontaneous self-assembly of icosahedral capsids. Nano Lett. 2007;7:338–344. doi: 10.1021/nl062449h. [DOI] [PubMed] [Google Scholar]
- 23.Schwartz R., Shor P.W., Berger B. Local rules simulation of the kinetics of virus capsid self-assembly. Biophys. J. 1998;75:2626–2636. doi: 10.1016/S0006-3495(98)77708-2. [DOI] [PMC free article] [PubMed] [Google Scholar]
- 24.Endres D., Zlotnick A. Model-based analysis of assembly kinetics for virus capsids or other spherical polymers. Biophys. J. 2002;83:1217–1230. doi: 10.1016/S0006-3495(02)75245-4. [DOI] [PMC free article] [PubMed] [Google Scholar]
- 25.Hagan M.F. A theory for viral capsid assembly around electrostatic cores. J. Chem. Phys. 2009;130:114902. doi: 10.1063/1.3086041. [DOI] [PMC free article] [PubMed] [Google Scholar]
- 26.Hagan M.F., Elrad O.M. Understanding the concentration dependence of viral capsid assembly kinetics—the origin of the lag time and identifying the critical nucleus size. Biophys. J. 2010;98:1065–1074. doi: 10.1016/j.bpj.2009.11.023. [DOI] [PMC free article] [PubMed] [Google Scholar]
- 27.Moisant P., Neeman H., Zlotnick A. Exploring the paths of (virus) assembly. Biophys. J. 2010;99:1350–1357. doi: 10.1016/j.bpj.2010.06.030. [DOI] [PMC free article] [PubMed] [Google Scholar]
- 28.Zlotnick A. To build a virus capsid. An equilibrium model of the self assembly of polyhedral protein complexes. J. Mol. Biol. 1994;241:59–67. doi: 10.1006/jmbi.1994.1473. [DOI] [PubMed] [Google Scholar]
- 29.Mannige R.V., Brooks C.L., 3rd Geometric considerations in virus capsid size specificity, auxiliary requirements, and buckling. Proc. Natl. Acad. Sci. USA. 2009;106:8531–8536. doi: 10.1073/pnas.0811517106. [DOI] [PMC free article] [PubMed] [Google Scholar]
- 30.Mannige R.V., Brooks C.L., 3rd Periodic table of virus capsids: implications for natural selection and design. PLoS ONE. 2010;5:e9423. doi: 10.1371/journal.pone.0009423. [DOI] [PMC free article] [PubMed] [Google Scholar]
- 31.Mannige R.V., Brooks C.L., 3rd Tilable nature of virus capsids and the role of topological constraints in natural capsid design. Phys. Rev. E. 2008;77:051902. doi: 10.1103/PhysRevE.77.051902. [DOI] [PMC free article] [PubMed] [Google Scholar]
- 32.Twarock R. Mathematical virology: a novel approach to the structure and assembly of viruses. Philos. Transact. A Math. Phys. Eng. Sci. 2006;364:3357–3373. doi: 10.1098/rsta.2006.1900. [DOI] [PubMed] [Google Scholar]
- 33.Reddy V.S., Giesing H.A., Johnson J.E. Energetics of quasiequivalence: computational analysis of protein-protein interactions in icosahedral viruses. Biophys. J. 1998;74:546–558. doi: 10.1016/S0006-3495(98)77813-0. [DOI] [PMC free article] [PubMed] [Google Scholar]
- 34.Wales D.J. The energy landscape as a unifying theme in molecular science. Philos. Transact. A Math. Phys. Eng. Sci. 2005;363:357–375. doi: 10.1098/rsta.2004.1497. discussion 375–377. [DOI] [PubMed] [Google Scholar]
- 35.Kegel W.K., Schoot Pv P. Competing hydrophobic and screened-coulomb interactions in hepatitis B virus capsid assembly. Biophys. J. 2004;86:3905–3913. doi: 10.1529/biophysj.104.040055. [DOI] [PMC free article] [PubMed] [Google Scholar]
- 36.Berthet-Colominas C., Monaco S., Cusack S. Head-to-tail dimers and interdomain flexibility revealed by the crystal structure of HIV-1 capsid protein (p24) complexed with a monoclonal antibody Fab. EMBO J. 1999;18:1124–1136. doi: 10.1093/emboj/18.5.1124. [DOI] [PMC free article] [PubMed] [Google Scholar]
- 37.Gamble T.R., Vajdos F.F., Hill C.P. Crystal structure of human cyclophilin A bound to the amino-terminal domain of HIV-1 capsid. Cell. 1996;87:1285–1294. doi: 10.1016/s0092-8674(00)81823-1. [DOI] [PubMed] [Google Scholar]
- 38.Gitti R.K., Lee B.M., Sundquist W.I. Structure of the amino-terminal core domain of the HIV-1 capsid protein. Science. 1996;273:231–235. doi: 10.1126/science.273.5272.231. [DOI] [PubMed] [Google Scholar]
- 39.Momany C., Kovari L.C., Rossmann M.G. Crystal structure of dimeric HIV-1 capsid protein. Nat. Struct. Biol. 1996;3:763–770. doi: 10.1038/nsb0996-763. [DOI] [PubMed] [Google Scholar]
- 40.Worthylake D.K., Wang H., Hill C.P. Structures of the HIV-1 capsid protein dimerization domain at 2.6 Å resolution. Acta Crystallogr. D Biol. Crystallogr. 1999;55:85–92. doi: 10.1107/S0907444998007689. [DOI] [PubMed] [Google Scholar]
- 41.Gamble T.R., Yoo S.H., Hill C.P. Structure of the carboxyl-terminal dimerization domain of the HIV-1 capsid protein. Science. 1997;278:849–853. doi: 10.1126/science.278.5339.849. [DOI] [PubMed] [Google Scholar]
- 42.Ganser B.K., Li S., Sundquist W.I. Assembly and analysis of conical models for the HIV-1 core. Science. 1999;283:80–83. doi: 10.1126/science.283.5398.80. [DOI] [PubMed] [Google Scholar]
- 43.Briggs J.A.G., Wilk T., Fuller S.D. Structural organization of authentic, mature HIV-1 virions and cores. EMBO J. 2003;22:1707–1715. doi: 10.1093/emboj/cdg143. [DOI] [PMC free article] [PubMed] [Google Scholar]
- 44.Ehrlich L.S., Agresta B.E., Carter C.A. Assembly of recombinant human immunodeficiency virus type 1 capsid protein in vitro. J. Virol. 1992;66:4874–4883. doi: 10.1128/jvi.66.8.4874-4883.1992. [DOI] [PMC free article] [PubMed] [Google Scholar]
- 45.Ganser-Pornillos B.K., von Schwedler U.K., Sundquist W.I. Assembly properties of the human immunodeficiency virus type 1 CA protein. J. Virol. 2004;78:2545–2552. doi: 10.1128/JVI.78.5.2545-2552.2004. [DOI] [PMC free article] [PubMed] [Google Scholar]
- 46.Gross I., Hohenberg H., Kräusslich H.G. A conformational switch controlling HIV-1 morphogenesis. EMBO J. 2000;19:103–113. doi: 10.1093/emboj/19.1.103. [DOI] [PMC free article] [PubMed] [Google Scholar]
- 47.Li S., Hill C.P., Finch J.T. Image reconstructions of helical assemblies of the HIV-1 CA protein. Nature. 2000;407:409–413. doi: 10.1038/35030177. [DOI] [PubMed] [Google Scholar]
- 48.Ganser-Pornillos B.K., Cheng A., Yeager M. Structure of full-length HIV-1 CA: a model for the mature capsid lattice. Cell. 2007;131:70–79. doi: 10.1016/j.cell.2007.08.018. [DOI] [PubMed] [Google Scholar]
- 49.Byeon I.J.L., Meng X., Gronenborn A.M. Structural convergence between cryo-EM and NMR reveals intersubunit interactions critical for HIV-1 capsid function. Cell. 2009;139:780–790. doi: 10.1016/j.cell.2009.10.010. [DOI] [PMC free article] [PubMed] [Google Scholar]
- 50.Pornillos O., Ganser-Pornillos B.K., Yeager M. X-ray structures of the hexameric building block of the HIV capsid. Cell. 2009;137:1282–1292. doi: 10.1016/j.cell.2009.04.063. [DOI] [PMC free article] [PubMed] [Google Scholar]
- 51.Chen B., Tycko R. Structural and dynamical characterization of tubular HIV-1 capsid protein assemblies by solid state nuclear magnetic resonance and electron microscopy. Protein Sci. 2010;19:716–730. doi: 10.1002/pro.348. [DOI] [PMC free article] [PubMed] [Google Scholar]
- 52.Han Y., Ahn J., Polenova T. Solid-state NMR studies of HIV-1 capsid protein assemblies. J. Am. Chem. Soc. 2010;132:1976–1987. doi: 10.1021/ja908687k. [DOI] [PMC free article] [PubMed] [Google Scholar]
- 53.Gross I., Hohenberg H., Kräusslich H.G. In vitro assembly properties of purified bacterially expressed capsid proteins of human immunodeficiency virus. Eur. J. Biochem. 1997;249:592–600. doi: 10.1111/j.1432-1033.1997.t01-1-00592.x. [DOI] [PubMed] [Google Scholar]
- 54.Metropolis N., Rosenbluth A.W., Teller E. Equation of state calculations by fast computing machines. J. Chem. Phys. 1953;21:1087–1092. [Google Scholar]
- 55.Meakin P., Metiu H., Scalapino D.J. The simulation of spinodal decomposition in two dimensions: a comparison of Monte Carlo and Langevin dynamics. J. Chem. Phys. 1983;79:1948–1954. [Google Scholar]
- 56.Tiana G., Sutto L., Broglia R.A. Use of the Metropolis algorithm to simulate the dynamics of protein chains. Physica A. 2007;380:241–249. [Google Scholar]
- 57.del Alamo M., Rivas G., Mateu M.G. Effect of macromolecular crowding agents on human immunodeficiency virus type 1 capsid protein assembly in vitro. J. Virol. 2005;79:14271–14281. doi: 10.1128/JVI.79.22.14271-14281.2005. [DOI] [PMC free article] [PubMed] [Google Scholar]
- 58.Douglas C.C., Thomas D., Prevelige P.E., Jr. Investigation of N-terminal domain charged residues on the assembly and stability of HIV-1 CA. Biochemistry. 2004;43:10435–10441. doi: 10.1021/bi049359g. [DOI] [PubMed] [Google Scholar]
- 59.Lanman J., Sexton J., Prevelige P.E., Jr. Kinetic analysis of the role of intersubunit interactions in human immunodeficiency virus type 1 capsid protein assembly in vitro. J. Virol. 2002;76:6900–6908. doi: 10.1128/JVI.76.14.6900-6908.2002. [DOI] [PMC free article] [PubMed] [Google Scholar]
- 60.Ferrone F. Analysis of protein aggregation kinetics. Methods Enzymol. 1999;309:256–274. doi: 10.1016/s0076-6879(99)09019-9. [DOI] [PubMed] [Google Scholar]
- 61.Ceres P., Zlotnick A. Weak protein-protein interactions are sufficient to drive assembly of hepatitis B virus capsids. Biochemistry. 2002;41:11525–11531. doi: 10.1021/bi0261645. [DOI] [PubMed] [Google Scholar]
- 62.Briggs J.A.G., Simon M.N., Johnson M.C. The stoichiometry of Gag protein in HIV-1. Nat. Struct. Mol. Biol. 2004;11:672–675. doi: 10.1038/nsmb785. [DOI] [PubMed] [Google Scholar]
- 63.Briggs J.A.G., Riches J.D., Kräusslich H.G. Structure and assembly of immature HIV. Proc. Natl. Acad. Sci. USA. 2009;106:11090–11095. doi: 10.1073/pnas.0903535106. [DOI] [PMC free article] [PubMed] [Google Scholar]
- 64.Lu J.X., Sharpe S., Tycko R. Oligomerization state and supramolecular structure of the HIV-1 Vpu protein transmembrane segment in phospholipid bilayers. Protein Sci. 2010;19:1877–1896. doi: 10.1002/pro.474. [DOI] [PMC free article] [PubMed] [Google Scholar]
- 65.Wilber A.W., Doye J.P.K., Wong P. Reversible self-assembly of patchy particles into monodisperse icosahedral clusters. J. Chem. Phys. 2007;127:085106. doi: 10.1063/1.2759922. [DOI] [PubMed] [Google Scholar]
- 66.Ayton G.S., Voth G.A. Multiscale computer simulation of the immature HIV-1 virion. Biophys. J. 2010;99:2757–2765. doi: 10.1016/j.bpj.2010.08.018. [DOI] [PMC free article] [PubMed] [Google Scholar]
Associated Data
This section collects any data citations, data availability statements, or supplementary materials included in this article.