

Abstract
We developed a computational model of mitochondrial energetics that includes Ca2+, proton, Na+, and phosphate dynamics. The model accounts for distinct respiratory fluxes from substrates of complex I and complex II, pH effects on equilibrium constants and enzyme kinetics, and the acid-base equilibrium distributions of energy intermediaries. We experimentally determined NADH and ΔΨm in guinea pig mitochondria during transitions from de-energized to energized, or during state 2/4 to state 3 respiration, or into hypoxia and uncoupling, and compared the results with those obtained in model simulations. The model quantitatively reproduces the experimentally observed magnitude of ΔΨm, the range of NADH levels, respiratory fluxes, and respiratory control ratio upon transitions elicited by sequential additions of substrate and ADP. Simulation results are also able to mimic the change in ΔΨm upon addition of phosphate to state 4 mitochondria, leading to matrix acidification and ΔΨm polarization. The steady-state behavior of the integrated mitochondrial model qualitatively simulates the dependence of respiration on the proton motive force, and the expected flux-force relationships existing between respiratory and ATP synthesis fluxes versus redox and phosphorylation potentials. This upgraded mitochondrial model provides what we believe are new opportunities for simulating mitochondrial physiological behavior during dysfunctional states involving changes in pH and ion dynamics.
Introduction
A comprehensive understanding of cardiac cell function requires elucidation of the interplay between the dynamics of energy metabolism and ion movements across the sarcolemma, sarcoplasmic reticulum, and mitochondrial membranes, which involves both feed-forward and feedback regulatory loops (1). In the heart, oxidative phosphorylation is the dominant source of energy for metabolic/contractile work, and therefore energetics plays a key role in modulating mechanical activity and ion gradients in both cytosolic and sarcoplasmic reticulum compartments. Mitochondria provide the bulk of the ATP needed for cardiac muscle contraction and sarcolemmal and sarcoplasmic ion transport, which is responsible for the electrical activity of the cardiac cell (2). Energetics drives ion transport processes by means of their dependence on the proton motive force (Δp) and phosphorylation potential, as well as by direct transport across the mitochondrial inner membrane (for example, mitochondrial Ca2+ transport can influence Ca2+ signals in the cytoplasm (3)). Conversely, energy demand changes in response to ion fluxes into and out of cellular compartments, primarily through activation of myosin ATPase, and, to a lesser extent, through Na+/K+ and Ca2+ pumps, which are responsible for resetting the ionic gradients (1). In addition, ion transport across the inner membrane modulates both mitochondrial energetic performance and ionic equilibria (4–8).
During the development of acute or chronic cardiac disease, changes in both ion gradients and energy status occur and influence each other through incompletely understood mechanisms. For example, during ischemia and reperfusion (9) or chronic heart failure (10–12), prominent alterations in Na+, Ca2+, and phosphate (Pi) ion dynamics occur and have a profound impact on the individual's susceptibility to arrhythmia, contractile performance, and mitochondrial function. Intracellular pH also changes with acute or chronic ischemia as anaerobic metabolism is enhanced. Changes in intracellular H+ concentration affect contraction (negative inotropic effect) and excitability (chronotropic effect), as well as cellular cycling of other ions. Thus, when investigating dysfunctional states such as ischemia and reperfusion, it is important to understand pH regulation (13,14). In these situations, however, multidirectional interaction loops make it difficult to discern which factors are influencing the overall function of the cell. Under such conditions, computational modeling provides a powerful approach for elucidating the regulation of ion dynamics and energetics of cardiac cells under physiological and pathological conditions.
Over the past decade, various researchers have used computational models to investigate mitochondrial function in the cardiac myocyte and pancreatic β-cells (15–19). Magnus and Keizer (15) developed a model of mitochondrial Ca2+ dynamics in pancreatic β-cells. Cortassa et al. (16) developed a mitochondrial energetics model that describes the tricarboxylic acid (TCA) cycle, oxidative phosphorylation, and Ca2+ transport across the inner mitochondrial membrane. This mitochondrial model was subsequently integrated into a model of excitation-contraction (EC) coupling in guinea pig ventricular cardiomyocytes (17). Results obtained with this EC coupling/mitochondrial energetics (ECME) model demonstrated how ADP and Ca2+ signals contribute to the matching between energy supply and demand during changes in workload (17). Further extensions of the ECME model, including reactive oxygen species (ROS)-induced ROS release, showed how oscillations of mitochondrial ATP regulate the cardiac action potential (20). Other groups also developed mitochondrial models that included detailed descriptions of transport mechanisms of K+ and other cations (18,19).
In this work, we extend our previous mitochondrial model to describe pH regulation, H+ association-dissociation equilibria, and Pi and Na+ dynamics. Two new transporters, the Na+/H+ exchanger (NHE) and the Pi carrier (PiC), are incorporated. We validated the assembled mitochondrial model experimentally with isolated guinea pig heart mitochondria in which we monitored energy and redox variables. We tested the model at the steady state by studying the dependence of respiratory and ATP synthesis fluxes on their driving forces (i.e., Δp, redox, and phosphorylation potentials), and during metabolic transitions from nonenergized to energized states 4 and 3 of respiration, followed by hypoxia and uncoupling. The simulation results were contrasted with experimental temporal profiles of energy variables and fluxes. Additionally, we performed simulations and experiments of energy variables after Pi additions during state 2/4 respiration.
Materials and Methods
Mitochondria isolation from guinea pig heart
We isolated mitochondria from adult Hartley guinea pig hearts using a method optimized for small tissue samples (8,21). Briefly, the heart ventricles were manually homogenized in the presence of protease (bacterial, type XXIV; Sigma) in ice-cold isotonic isolation solution (IS; 75 mM sucrose, 225 mM mannitol, and 1 mM EGTA). The homogenate was centrifuged at low speed (480 × g, 5 min, 4°C) and the supernatant was further centrifuged (7700 × g, 10 min) to obtain the mitochondrial pellet. The pellet was washed twice in IS, centrifuged (7700 × g, 5min), and finally resuspended in IS without EGTA.
The quality of the mitochondria was monitored by electron microscopy and respiratory control ratio (RCR) methods as previously described (8). RCRs of 10–15 with 5 mM glutamate plus malate (G/M) were obtained.
The bicinchonic acid method (BCA protein assay kit; Thermo Scientific Pierce, Rockford, IL) was used to determine mitochondrial protein.
Determination of the mitochondrial membrane potential (ΔΨm) and NADH
NADH and ΔΨm were measured fluorimetrically (PTI, Birmingham, NJ) at 37°C in a stirred cuvette. NADH fluorescence was determined at λexcitation= 340 nm and λemission= 450 nm, and the signal was calibrated with cyanide (CN−, maximal reduction) and 2,4-dinitrophenol (DNP, maximal oxidation). We measured ΔΨm using the ratiometric (excitation) method of Scaduto and Grotyohann (22) with the fluorescent dye tetramethyl rhodamine methyl ester (TMRM), at λexcitation= 546 nm and 573 nm, and λemission= 590 nm (22,23).
Suspensions of freshly isolated mitochondria were monitored fluorimetrically for TMRM and NADH signals. State 2/4 and state 3 respiration was elicited by the sequential addition of substrates and ADP, respectively.
Computational modeling of mitochondrial function
Na+ and Pi dynamics
A previous computational model of mitochondrial energetics and Ca2+ dynamics (16) was modified to account for Na+ and Pi transport (Fig. 1). Models of the NHE and PiC were developed and incorporated (18,24) (see Section S1 in the Supporting Material).
Figure 1.
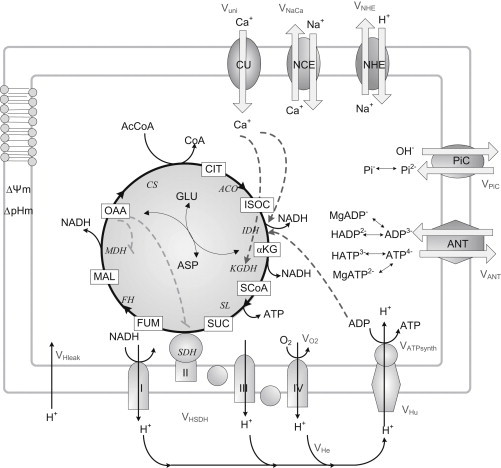
General scheme of the mitochondrial model. The upgraded model includes the Na+/H+ exchanger and phosphate carrier (PiC). It also accounts for SDH-driven respiration (complex II), which is part of the TCA cycle and respiratory electron transport chain. AcCoA, derived from the oxidation of fatty acids and glucose, is fed into the TCA cycle. The complete oxidation of AcCoA in the TCA cycle generates NADH, which drives electron transport through the respiratory chain. The pumping of protons across the inner mitochondrial membrane establishes an electrochemical gradient, or Δp, which in turn drives the phosphorylation of matrix ADP to ATP by the F1F0-ATPase (ATP synthase). Notations for processes are defined in the Glossary in the Supporting Material (Section 7. Glossary). Key to symbols: continuous lines, mass transformations; dashed lines, regulatory interactions (positive (arrowhead) or negative (dash)).
Regulation of pH and H+ dynamics
Different aspects of pH regulation and associated effects were incorporated into the model, including the pH dependence of equilibrium constants and multiple acid-base equilibria of metabolites with H+; the distribution of acid-base forms of ionizable metabolites and associations with Mg2+ of state variables ATP, ADP, Pi, and succinate; and the dependence of isocitrate dehydrogenase and malate dehydrogenase on pH. These modifications were based on the work of Alberty (25), who modeled the impact of ionic equilibria on thermodynamics, and its application to glycogenolysis in muscle (26). The development of the model is described in Section S3, Section S4, and Section S8 in the Supporting Material.
Mitochondrial respiration from complex I and complex II substrates
Our model formulation is able to discriminate between electron transport from complex I or complex II substrates. We accomplished this new feature by incorporating the activity of succinate dehydrogenase (SDH) as part of the respiratory chain. A formalism similar to that used for the respiratory electron transport from NADH was used for succinate-driven respiration. In the latter case, the corresponding thermodynamic constants and the H+ stoichiometry (4H+/succinate) were accounted for. See Section S4 in the Supporting Material for more details.
Model and parameter validation
The optimization criterion for the model kinetic parameters concerning NHE, PiC, and TCA cycle enzymes was provided by the intermediary metabolite and ion concentrations as described in Section S1 and Section S2 in the Supporting Material. When assembled into the mitochondrial energetic model, the same parameter values for NHE and PiC (except for the concentration of transporters) were used.
The assembled model parameters were either obtained directly from the literature or optimized by minimizing the differences between the model simulation and experimental data. Parameter optimization was performed with the simplex search method from MATLAB 7.1 (The MathWorks, Natick, MA) (27) to minimize the cost function for ΔΨm, NADH, and TCA cycle intermediate concentrations. The optimized parameters were concentrations of the transporters (electron carriers, NHE, and PiC), maximal rate of Ca2+ uniporter, or the rate constants of the activities involved in the TCA cycle.
The code of the assembled mitochondrial energetics model was written in C++ (Visual Studio; Microsoft, Redmond, WA). The 14 nonlinear ordinary differential equations (Table S3) were integrated numerically with CVODE (http://citeseer.ist.psu.edu/1230.html). The model was run until a steady state was achieved, when the magnitude of each time derivative was ≤10−10. The steady-state values of each state variable were then used as input for performing bifurcation and continuation stability analysis with the software MatCont (28) in MATLAB 7.1. Stability analysis was used to determine the dependence of the steady-state solution properties (type and stability) on the model parameters (i.e., the ADP level in the extramitochondrial compartment and acetyl CoA (AcCoA)).
Results
Relationships between ion and energy fluxes and forces in mitochondrial physiology
The model performance of oxidative phosphorylation in relationship to ionic fluxes was tested under steady-state and time-dependent situations. Under steady-state conditions, we paid special attention to the relationship between respiration (VO2) and ATP synthesis (VATPsynthase) fluxes versus Δp as the main driving force. We analyzed conditions that emulate the transition between state 4 (substrate but no ADP (29) but are also referred to as state 2 (30)) and state 3 (substrate and ADP present) of mitochondrial respiration. Mitochondrial respiration before ADP addition has been strictly termed state 2, but is functionally the same as state 4 (30). The latter term is usually used for both states, and in our model simulations there is a true state 4 because ATP is present (i.e., the sum of ATP + ADP is always constant). In our experimental setting, the state is labeled state 2/4 because substrate is added in the absence of ADP, but we prefer to retain the number 4 in the notation because is physiologically more meaningful.
The state 4 to state 3 transition is a fundamental one in mitochondrial physiology, representing the shift from a highly energized (i.e., high ΔΨm) and reduced redox status of low respiration and ATP synthesis to high respiratory and ATP synthesis fluxes. As such, this transition also reflects the energy-redox status of mitochondria in response to low (state 4) and high (state 3) ATP demand.
Steady-state behavior
To analyze the model steady-state behavior, we performed a stability analysis as a function of the model parameters cytoplasmic ADP (ADPi) (Fig. 2, A–D) and AcCoA (Fig. 2, E and F), which were varied in the physiological range. Reaction or transport flows and driving forces were calculated at the steady state, and thus the forces and flows displayed in Fig. 2 result from the integrated behavior of all mitochondrial energetic processes accounted for by the model.
Figure 2.
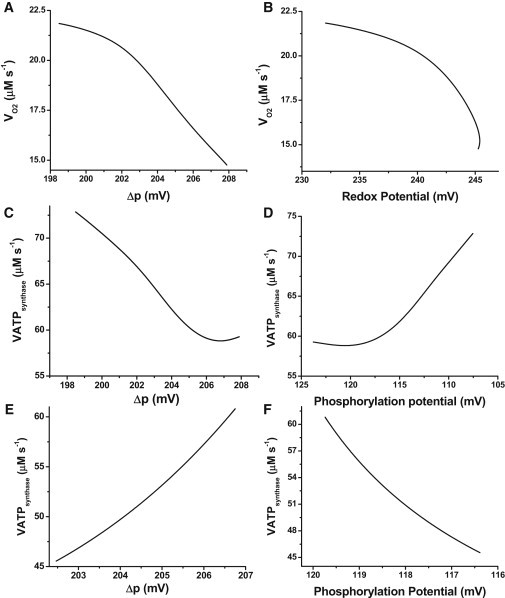
Steady-state respiratory flux (VO2) and ATP synthase activity. Model simulations were run under state 4 respiration conditions (ADPi = 0.01 mM) until the system attained a steady state in which all derivatives were ≤10−10. The solution at the steady state was continued as a function of the concentration of extramitochondrial ADP, ADPi (from 0.01 to 1.0 mM). (A) Steady-state VO2 from NADH as related to Δp. (B) VO2 as related to the redox potential. (C and D) Steady-state flux of ATP synthesis as related to Δp and the phosphorylation potential (AF1, in mV), obtained in the same simulation as a function of ADPi. The reversal of the phosphorylation potential axis in panels D and F is justified by the fact that ATP synthase activity depends inversely on the phosphorylation potential, as defined below. (E and F) Steady-state flux of ATP synthesis as related to Δp and the phosphorylation potential (in mV), obtained by departing from a de-energized steady state and increasing the parameter AcCoA until state 4 conditions are attained. The redox and phosphorylation potentials are calculated with the following expressions: Phosphorylation potential: . Redox potential: .
The steady-state behaviors of VO2 and VATPsynthase fluxes were related to Δp, redox, or phosphorylation potentials (expressed in mV) as shown in Fig. 2. The steady-state behavior depicted in Fig. 2, A–D, can be explained by considering that as ADPi increases, it is taken up into the matrix, raising the ADPm steady-state level. Higher ADPm decreases the phosphorylation potential, leading to an increase in ATP synthesis (Fig. 2, C and D). ATP synthesis is the most prominent process that dissipates the proton motive force, Δp. The steady state of Δp decreases when ADPi and ATP synthase activity increase, leading to higher VO2 (Fig. 2 A). This in turn consumes NADH, resulting in a drop of redox potential (Fig. 2 B). In this framework, flows and thermodynamic forces are both cause and effect of the dynamic behavior of the integrated model.
The steady-state behavior of the transition from substrate deprivation to supply is shown in Fig. 2, E and F. In this case, substrate provision replenishes the NADH pool, which increases the redox potential and VO2 while driving the buildup of Δp. Thus, the increased operation of ATP synthase, fueled by Δp, increases the phosphorylation potential (Fig. 2, E and F).
The 20 mV decrease in phosphorylation potential (Fig. 2 D), when ADPi is increased from 0.01 to 1.0 mM, overcomes the ∼10 mV decrease in Δp, eliciting an increase in ATPsynthase activity (Fig. 2 C). Conversely, when respiration is limited by substrate availability, the 4 mV increase in Δp powered by a larger respiratory activity after an increase in substrate (Fig. 2 E) drives the rise in ATPsynthase despite the 3 mV increase in phosphorylation potential (Fig. 2 F).
As in the former version of the mitochondrial model (16), the relationship between VO2 and Δp is inversely proportional under the ADP limitation (Fig. 2 A), in agreement with experimental data from the literature (31). Also, data obtained with mitochondria in which the ATP/ADP ratio was systematically varied, or in which ΔΨm was perturbed by the addition of carbonyl cyanide 4-(trifluoromethoxy)phenylhydrazone (FCCP) or ClO4−, displayed behavior similar to that observed in the simulation results shown in Fig. 2 (see Section S9 in the Supporting Material).
Calcium uniporter, NHE, and PiC fluxes in relation to Δp are shown in Fig. 3. Ca2+ and Na+ fluxes increase and then decrease slightly as a function of Δp when Δp is varied by changing extramitochondrial ADP levels (Fig. 3 A). The range of flux values is rather narrow, but it agrees well with the range of Ca2+ uptake fluxes determined experimentally in isolated heart mitochondria (32). On the other hand, the flux through PiC decreases with Δp subsequent to the Pi demand for phosphorylation by the ATP synthase (Fig. 3 B).
Figure 3.
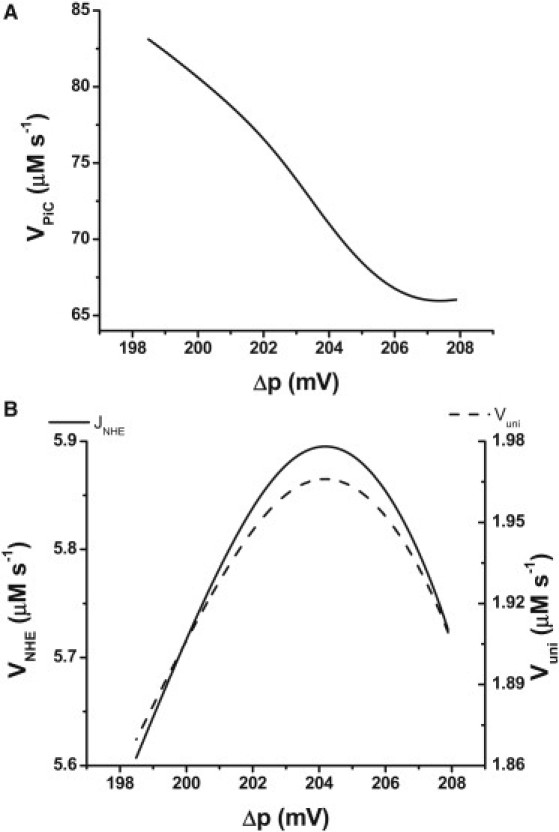
Steady-state ionic fluxes involving Ca+2, Na+, H+, and Pi as related to Δp. The figure shows the fluxes through the Ca2+ uniporter (Vuni), NHE (A), and PiC (B) obtained in the same simulations that produced the plots in Fig. 2, A–D, i.e., by continuation of the ADPi. Parameter values for the processes are indicated in Table S1.
Time-dependent behavior
We experimentally induced states 2/4 and 3 of mitochondrial respiration in freshly isolated mitochondria from guinea pig heart. After addition of substrate (G/M, 5 mM each) to the mitochondrial suspension, ΔΨm polarized to 185 mV along with a 90% reduction of the NADH pool. After ADP addition, ΔΨm and NADH levels decreased by 30–40% due to ATP synthesis and ΔΨm dissipation by the F1F0-ATP synthase, which led to higher respiratory rates (8,33). The extent of NADH reduction and oxidation was estimated after addition of CN− (full reduction) and the protonophore DNP (full oxidation), respectively.
Fig. 4 shows the experimental and model results obtained after addition of substrate and ADP. Theoretical ΔΨm levels (Fig. 4 A) were larger than experimental values (Fig. 4 C), but the total depolarization after ADP addition is comparable (∼30 mV in both experiment and model simulations). Compared with the average decrease in NADH observed experimentally, model simulations showed smaller drops in NADH (from 0.6 to 0.4 mM) during the transition between states 2/4 and 3 (Fig. 4, B and D). The largest difference between simulated and experimental behaviors occurs in the rate of change of NADH after addition of ADPi.
Figure 4.
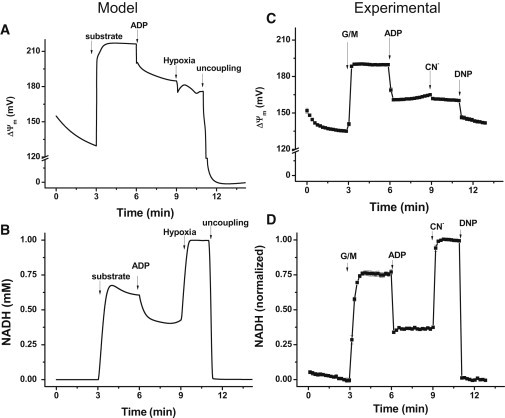
Experimental and model simulation results for NADH and ΔΨm during transitions between states 4 and 3. (A and B) Model simulations in which the parameters detailed below were varied to emulate the experimental protocol applied to the mitochondrial suspension in the cuvette of the fluorometer (C and D) as indicated. The addition of substrate is mimicked as a transition of the parameters AcCoA and Glu from 1 × 10⁻⁵ to 0.01 and 1 × 10⁻⁵ to 10.0, respectively. ADPi varies from 0.01 to 1 mM; the transition to hypoxia was simulated by a decrease in ρRES from 2.8 × 10⁻² to 9.0 × 10⁻⁵, and the uncoupling was mimicked by an increase in the proton conductance, gH, of the inner mitochondrial membrane (from 3.0 × 10⁻⁸ to 1.0 × 10⁻⁴). (C and D) Experimental profiles of ΔΨm and NADH after the addition of 5 mM G/M, 1 mM ADP, 2.5 mM KCN, and 20 μM DNP as indicated by arrows. Time points depict the mean ± SE, n = 6.
Model simulations showed that after the concentration of respiratory electron carriers (ρRES) was decreased, mimicking the effect of CN− (or hypoxia), ΔΨm further decreased, whereas NADH increased to a highly reduced state (Fig. 4) in accordance with the experimental results. NADH oxidized and ΔΨm approached zero upon uncoupling of oxidative phosphorylation (achieved in the model by a large increase in the leak conductance, gH). The apparent incomplete collapse of ΔΨm seen in the experimental data may be due to the dynamic range of the ΔΨm probe, TMRM, which is sensitive within the range of 130–210 mV under our experimental conditions (see Materials and Methods).
Model predictions about the rates of respiration and ATP synthesis during the transition from state 4 to state 3, followed by hypoxia and uncoupling, are shown in Fig. 5. The increase in respiration observed upon ADP addition corresponds to a simulated RCR of ∼2.5 (Fig. 5). This is in the same range of RCRs obtained experimentally with mouse heart mitochondria but lower than the values obtained with guinea pig heart mitochondria (8). The ATP synthase activity exhibits a ∼5.7-fold increase after ADP addition, a steady fall during simulated hypoxia, and a reversal of the H+ pumping direction upon uncoupling, as expected (Fig. 5).
Figure 5.
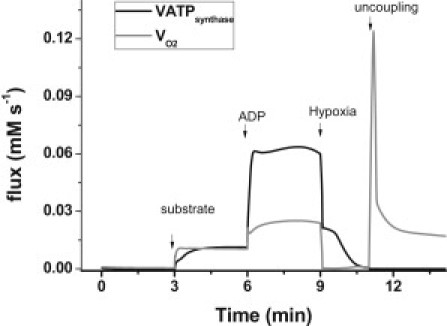
Model simulation of respiratory and ATP synthesis rates during the state 4 to state 3 transition. Shown are the VO2 and VATPsynthase fluxes computed in the simulations depicted in Fig. 4. The black continuous trace displays the NADH-driven respiratory flux, and the dashed line displays the ATP synthase flux.
A better measure of the energetic yield of oxidative phosphorylation is provided by the P/O ratio, i.e., the quotient of the flux of ATP synthase over the sum of respiration from complex I and complex II substrates. During the steady-state regime, the P/O ratio varies between 1.67 to 2.02 when the behavior of the model is studied as a function of the extramitochondrial ADP (Fig. 2, compare panels A and C). This is comparable to the P/O ratio values usually reported (34,35). On the other hand, during time-dependent behavior, the P/O ratio varies from 0.5 in state 4 to 1.25 in state 3. As expected, the ratio becomes negative upon uncoupling, due to reversal of the ATP synthase.
Mitochondrial pH and Pi responses during energetic transitions
Addition of 2.0 mM Pi to a mitochondrial suspension in state 2/4 resulted in an increase of ΔΨm and a higher reduction of NADH as compared with lower extramitochondrial Pi (0.5 mM; Fig. 6 A). Model simulations reproduced the change in ΔΨm (Fig. 6 B), but the level of NADH remained constant (not shown). The latter could be explained by a stimulation of the TCA cycle (through the activity of SCoA lyase), which was similar in magnitude to the slight increase in respiration triggered by the ATP synthase, resulting in no net change in NADH. The mechanism of Pi transport, accounted for by the model, involves a Pi/OH antiport, which is equivalent to an apparent Pi/H+ cotransport (36). Pi uptake triggers intramitochondrial acidification, resulting in a decrease of the ΔpH component of Δp. When Pi is transported, Δp undergoes a slight increase but ΔpH and ΔΨm interconvert, as shown in Fig. 6 B.
Figure 6.
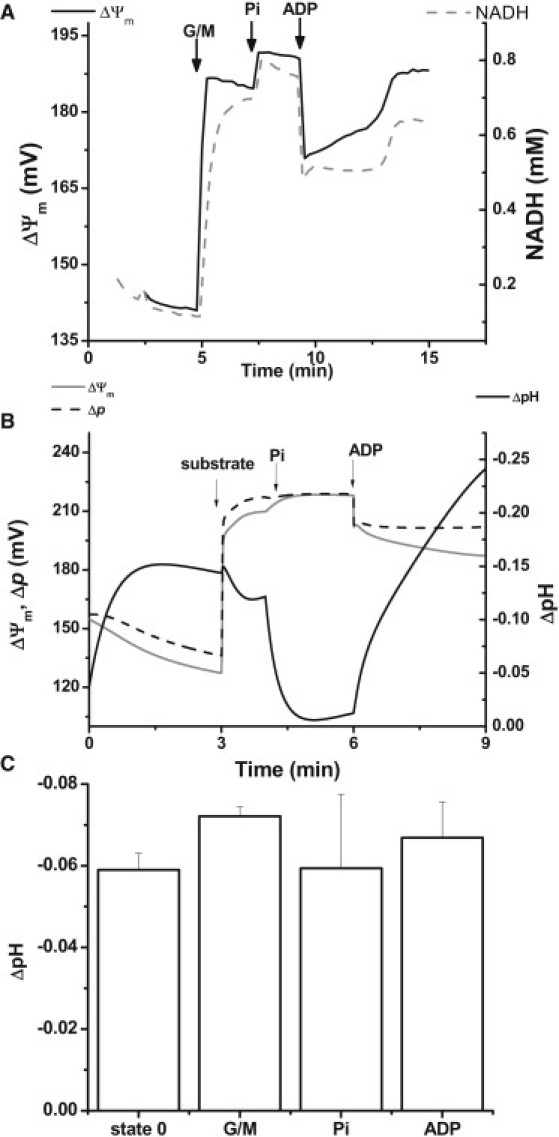
Experimental results and model simulation of Pi addition to mitochondria in state 2/4. (A) Experimental profile of ΔΨm and NADH after the addition of 5 mM G/M, followed by 2 mM KH2PO4 and 1 mM ADP at the times indicated by arrows. (B) ΔpH (defined as pHi − pHm; black solid trace), ΔΨm (gray solid trace), and Δp (black dashed trace) obtained in model simulations after the addition of substrate, Pi, and ADP. The change in model parameters to mimic the additions of substrate and ADP are as indicated in the legend of Fig. 4. Pi addition is represented by a change in extramitochondrial Pi (from 0.5 to 3.0 mM). (C) Experimental mitochondrial matrix pH monitored by the fluorescent signal of the ratiometric dye carboxy SNARF-1 (54). The panel displays the time averages of a typical pH response after the additions indicated in the x axis.
Slight changes in mitochondrial pH, pHm (∼0.05– 0.1 pH units), were observed during the state 2/4 to state 3 transition in the experiment and simulation (Fig. 6, B and C). This could be due to a larger buffering capacity by the mitochondrial matrix than that experimentally measured (37), which is only overcome by a large increase in proton transport, after nigericin and FCCP (not shown).
Discussion
In this work, we extended a previously developed model of mitochondrial energetics (16) by incorporating interactions between energetics (i.e., TCA cycle, respiration, and ATP synthesis fluxes) and the dynamics of several ions, including Ca2+, Na+, Pi, and H+ (with the latter influencing mitochondrial activities through pH modulation). The distinct features of the upgraded model are as follows: 1), inclusion of the mitochondrial NHE exchanger and PiC; 2), explicit accounting for the dynamics of Na+, H+, and Pi; 3), discrimination between electron transport from complex I or complex II substrates by including the activity of SDH in the respiratory chain; 4), acid-base equilibria for ATP, ADP, Pi, and succinate; and 5), pH dependence of the equilibrium constants for ATP synthase, SDH, and succinate lyase.
We performed crucial validation tests of the upgraded model by combining experimental and theoretical data as follows: 1), simulation of the respiratory (VO2) and ATP synthesis (VATPsynthase) fluxes as related to their driving forces (i.e., Δp, redox, and phosphorylation potentials) in agreement with data reported in the literature (Fig. 2) (16,31,38,39); 2), simulation of experimental profiles of ΔΨm and NADH during the transition between states 2/4 and 3, hypoxia (mimicked by CN− addition), and uncoupling by DNP (Fig. 4); 3), simulation of the increase in VO2 and VATPsynthase upon addition of ADP, followed by their decrease under hypoxia and reversal of the ATP synthase during uncoupling (Fig. 5); 4), reproduction of changes in ΔΨm after Pi addition during state 2/4 respiration; and 5), interconversion between ΔpH and ΔΨm after addition of Pi (Fig. 6). The precise experimental definition of the physiological status of mitochondria (e.g., state 2/4 or state 3 respiration) enables a better understanding of the effect of ionic changes (mainly in H+ and Pi) due to quite different energetic and osmotic statuses under both conditions (see below).
Ion dynamics and mitochondrial energetics during physiological metabolic transitions
The transition from state 4 to state 3 of mitochondrial respiration plays a fundamental role in mitochondrial physiology. In state 4, mitochondria exhibit maximal energization with high ΔΨm, ATP, and NADH levels in the presence of low electron flow, whereas in state 3, ATP synthesis and respiration are maximal with relatively lower ΔΨm and more oxidized NADH (Fig. 4) (8,33). The behavior displayed by our model, both in the steady-state regime and during transients, quantitatively reproduces the same range of experimental values for energy intermediates and fluxes measured in this study (Figs. 2–4) and in our previous work (16).
The integrated function of major ionic mechanisms with mitochondrial energetics and redox status involves multiple interactions and is only partially understood. The importance of the energy-dependent uptake of ions by mitochondria was recognized in early work (40–43). The energy that is stored as electrochemical gradients across the inner mitochondrial membrane constitutes the main driving force of ion and substrate transport, as well as ATP synthesis. The Δp is used for the import of respiratory substrates and Pi (driven by ΔpH), ADP in exchange for ATP through the ANT (driven by ΔΨm), volume regulation (K+, Na+, and anions), energetic signaling (Ca2+), and heat production (H+; see Bernardi (44) for a review). Ionic exchange modulates mitochondrial volume, and an increase in mitochondrial volume may activate the respiratory chain (4,45).
In model simulations, Na+ levels increased (∼10%) during energization of the membrane after substrate addition, and decreased (∼13%) in state 3 after ADP addition (results not shown). A tight regulation of mitochondrial Na+ appears to be desirable because of the impact of Na+ cellular overload on the dynamics of Ca2+ and its negative consequences for mitochondrial energetics (3,12), in addition to the generation of ROS (46). Na+ is also known to increase in cardiac mitochondria after episodes of ischemia/reperfusion, and sarcolemmal NHE activity is important for the preconditioning elicited by brief ischemic periods before the occurrence of index ischemia (47). Mitochondrial NHE activity also appears to be required for steady-state Ca2+ cycling in energized mitochondria (44).
The transmembrane pH gradient and ΔΨm are the main components of Δp, which drives most ionic and substrate exchanges through the inner mitochondrial membrane. Mitochondrial pH exhibited only small changes during metabolic transitions in response to substrate additions (Fig. 6 C). In our model, the H+ dynamics are linked to Na+ through the activity of NHE, and both ion concentrations appear to be tightly regulated under the conditions explored here.
Pi accumulated to ∼4–5 mM levels in mitochondria when Δp increased (results not shown). This result is expected because mitochondria exhibit increased Δp when ATP synthesis decreases, and Pi, as a substrate of ATPsynthase, accumulates. The increase in VO2 as a function of Pi concentration in state 3 (48) (results not shown), and the transient increase in ΔΨm after a pulse of Pi to mitochondria in state 2/4 (Fig. 6, A and B) could be also simulated. Our model does not account for direct activation of TCA cycle dehydrogenases by Pi, as postulated by other authors (48), which could partly explain the lack of increase in NADH that we observe in the simulations after a pulse of Pi (see Results section and Fig. 6).
A comparison of model simulations of respiratory chain inhibition as a surrogate of mitochondrial behavior during ischemia and experimental data obtained after the addition of cyanide shows a close agreement for changes in ΔΨm, i.e., 10 mV (from ∼180 mV to ∼170 mV) as compared with 5 mV (from 165 mV to 160 mV) observed in the experiments (Fig. 4, A and C). A wide spectrum of experimental results have been reported for similar interventions by other authors, ranging from large ΔΨm depolarization (from 161 mV to 57 mV in <5 s) to no change (48). In our simulations, the drop in ΔΨm in response to a decrease in respiratory electron carrier levels results from the sudden decrease in respiration that is responsible for building up the Δp.
Strengths and limitations of the mitochondrial model
The updated mitochondrial model is able to simulate significant physiological conditions and reproduce a wide range of experimental results reported herein and elsewhere. We optimized the model parameters by adjusting the kinetic constants to reproduce experimental measurements of state variables, including 1), the TCA cycle intermediates (49); 2), the H+ concentration, which should render a more alkaline pH than the extramitochondrial milieu (Fig. 6); 3), the Na+ concentration in the matrix, which should be close to the extramitochondrial concentration, which in turn should mimic cytoplasmic levels of Na+; and 4), the steady-state levels of ΔΨm and NADH in state 4, which should resemble the experimental levels measured in mitochondrial suspensions (Fig. 4). When all of the above criteria are met rather accurately (±20%), the model displays fluxes of uniporter (Vuni) and respiratory rates (VO2) that are in the same range as those reported previously (8,31–33) (Fig. 5), and the correct flow-force relationships are obtained with a fully operational energy transduction system (Fig. 2).
There are quantitative differences between the simulated and experimental absolute values of state variables (e.g., the level of ΔΨm during the state 2/4 to state 3 transition) and the fast relaxation of the state variables observed in the experiments. Such differences are likely due to some of the processes that were omitted from the model formulation presented here. These processes are related to the transport of K+ and its associated effect on mitochondrial matrix volume, and the metabolism of ROS that are known to be produced and scavenged in mitochondria. These processes consume Δp and redox potential (e.g., through transhydrogenase activity), resulting in an increase in respiration and a faster NADH consumption rate.
Comparison with previous models of mitochondrial energetics
The model of energy metabolism and mitochondrial ion dynamic presented here advances previous models (16,18,19,50) in several ways. For example, the model of Korzeniewski and Mazat (50), in its various versions, involves respiratory chain activities and the ATP synthase that do not explicitly depend on Δp or ΔΨm. Beard (51) also presented a detailed model that encompassed ion transport, including Pi, K+, and H+. His simulations showed a good reproduction of experimental data concerning the response of energy variables to Pi addition, assuming Pi activation of NADH-producing enzymes and complex III activity. The main differences between the Beard model (51) and the one presented here are that, in the former, oxidative phosphorylation rate expressions assume linear flow-force relationships instead of the S-shaped relationships characterized for proton pumps in the respiratory chain (38,39), and the Beard model does not account for Na+ or Ca2+ transport or its effects on energy metabolism.
Another model of mitochondrial ion transport and energetics based on Magnus and Keizer models (15) has been used to study the effect of Ca2+ on ATP synthesis. The model proposed by Nguyen et al. (18) simulates a linear relationship between mitochondrial and extramitochondrial Ca2+ concentrations, providing an upper limit to the activation of the ATP synthase by Ca2+, which is a built-in feature of their model. Our model exhibits an exponential relationship between mitochondrial and extramitochondrial Ca2+ concentrations, and also accounts for H+ dynamics, the acid-base equilibria of metabolites, and the pH dependence of thermodynamic constants.
Conclusions
The close experimental-theoretical approach adopted in this work allowed us to conduct a rigorous validation of our computational model. Among the new possibilities offered by this computational model, we believe, is the ability to simulate ischemia-reperfusion-related changes in energetics, ion transport, and pH regulation, and assess their impact on the contractile and electrical functions of the cardiomyocyte. Thus, a forthcoming step will be the incorporation of pH regulation and a more comprehensive description of mitochondrial ion transport in the integrated model of cardiomyocyte function (ECME model) (17). Recent achievements obtained with the ECME model include a description of the action potential duration shortening during mitochondrial oscillations (20), and propagation of the ΔΨm depolarization wave obtained with a network simulation of the isolated mitochondrion model under criticality (52,53). The simulation of arrhythmias and mechanical dysfunction during ischemia-reperfusion can now be more realistically attempted by including the effects of pH and ion regulation on mitochondrial energetics. This will increase the possibility of understanding and predicting the appearance of pathological behavior on different scales, which in turn will facilitate the design of new strategies to treat or avoid conditions that lead to heart disease.
Acknowledgments
This work was supported by National Institutes of Health grants R33HL87345, P01HL081427, R21HL106054, R01 HL091923, and NO1-HV-28180.
Supporting Material
References
- 1.Cortassa S., O'Rourke B., Aon M.A. Control and regulation of mitochondrial energetics in an integrated model of cardiomyocyte function. Biophys. J. 2009;96:2466–2478. doi: 10.1016/j.bpj.2008.12.3893. [DOI] [PMC free article] [PubMed] [Google Scholar]
- 2.Solaini G., Harris D.A. Biochemical dysfunction in heart mitochondria exposed to ischaemia and reperfusion. Biochem. J. 2005;390:377–394. doi: 10.1042/BJ20042006. [DOI] [PMC free article] [PubMed] [Google Scholar]
- 3.Maack C., Cortassa S., O'Rourke B. Elevated cytosolic Na+ decreases mitochondrial Ca2+ uptake during excitation-contraction coupling and impairs energetic adaptation in cardiac myocytes. Circ. Res. 2006;99:172–182. doi: 10.1161/01.RES.0000232546.92777.05. [DOI] [PMC free article] [PubMed] [Google Scholar]
- 4.Halestrap A.P. The regulation of the matrix volume of mammalian mitochondria in vivo and in vitro and its role in the control of mitochondrial metabolism. Biochim. Biophys. Acta. 1989;973:355–382. doi: 10.1016/s0005-2728(89)80378-0. [DOI] [PubMed] [Google Scholar]
- 5.Garlid K.D., Dos Santos P., Paucek P. Mitochondrial potassium transport: the role of the mitochondrial ATP-sensitive K(+) channel in cardiac function and cardioprotection. Biochim. Biophys. Acta. 2003;1606:1–21. doi: 10.1016/s0005-2728(03)00109-9. [DOI] [PubMed] [Google Scholar]
- 6.O'Rourke B., Cortassa S., Akar F., Aon M. Mitochondrial ion channels in cardiac function and dysfunction. Novartis Found. Symp. 2007;287:140–151. doi: 10.1002/9780470725207.ch10. discussion 152–146. [DOI] [PMC free article] [PubMed] [Google Scholar]
- 7.Maack C., Ganesan A., O'Rourke B. Cardiac sodium-calcium exchanger is regulated by allosteric calcium and exchanger inhibitory peptide at distinct sites. Circ. Res. 2005;96:91–99. doi: 10.1161/01.RES.0000151334.48676.68. [DOI] [PMC free article] [PubMed] [Google Scholar]
- 8.Aon M.A., Cortassa S., O'Rourke B. Energetic performance is improved by specific activation of K+ fluxes through K(Ca) channels in heart mitochondria. Biochim. Biophys. Acta. 2010;1797:71–80. doi: 10.1016/j.bbabio.2009.08.002. [DOI] [PMC free article] [PubMed] [Google Scholar]
- 9.Brown D.A., Aon M.A., O'Rourke B. Effects of 4′-chlorodiazepam on cellular excitation-contraction coupling and ischaemia-reperfusion injury in rabbit heart. Cardiovasc. Res. 2008;79:141–149. doi: 10.1093/cvr/cvn053. [DOI] [PMC free article] [PubMed] [Google Scholar]
- 10.Hobai I.A., Maack C., O'Rourke B. Partial inhibition of sodium/calcium exchange restores cellular calcium handling in canine heart failure. Circ. Res. 2004;95:292–299. doi: 10.1161/01.RES.0000136817.28691.2d. [DOI] [PMC free article] [PubMed] [Google Scholar]
- 11.Wagner S., Dybkova N., Maier L.S. Ca2+/calmodulin-dependent protein kinase II regulates cardiac Na+ channels. J. Clin. Invest. 2006;116:3127–3138. doi: 10.1172/JCI26620. [DOI] [PMC free article] [PubMed] [Google Scholar]
- 12.Liu T., O'Rourke B. Enhancing mitochondrial Ca2+ uptake in myocytes from failing hearts restores energy supply and demand matching. Circ. Res. 2008;103:279–288. doi: 10.1161/CIRCRESAHA.108.175919. [DOI] [PMC free article] [PubMed] [Google Scholar]
- 13.Ch'en F., Clarke K., Noble D. Modeling of internal pH, ion concentration, and bioenergetic changes during myocardial ischemia. Adv. Exp. Med. Biol. 1997;430:281–290. doi: 10.1007/978-1-4615-5959-7_24. [DOI] [PubMed] [Google Scholar]
- 14.Ch'en F.F., Vaughan-Jones R.D., Noble D. Modelling myocardial ischaemia and reperfusion. Prog. Biophys. Mol. Biol. 1998;69:515–538. doi: 10.1016/s0079-6107(98)00023-6. [DOI] [PubMed] [Google Scholar]
- 15.Magnus G., Keizer J. Minimal model of β-cell mitochondrial Ca2+ handling. Am. J. Physiol. 1997;273:C717–C733. doi: 10.1152/ajpcell.1997.273.2.C717. [DOI] [PubMed] [Google Scholar]
- 16.Cortassa S., Aon M.A., O'Rourke B. An integrated model of cardiac mitochondrial energy metabolism and calcium dynamics. Biophys. J. 2003;84:2734–2755. doi: 10.1016/S0006-3495(03)75079-6. [DOI] [PMC free article] [PubMed] [Google Scholar]
- 17.Cortassa S., Aon M.A., Winslow R.L. A computational model integrating electrophysiology, contraction, and mitochondrial bioenergetics in the ventricular myocyte. Biophys. J. 2006;91:1564–1589. doi: 10.1529/biophysj.105.076174. [DOI] [PMC free article] [PubMed] [Google Scholar]
- 18.Nguyen M.H., Dudycha S.J., Jafri M.S. Effect of Ca2+ on cardiac mitochondrial energy production is modulated by Na+ and H+ dynamics. Am. J. Physiol. Cell Physiol. 2007;292:C2004–C2020. doi: 10.1152/ajpcell.00271.2006. [DOI] [PubMed] [Google Scholar]
- 19.Wu F., Yang F., Beard D.A. Computer modeling of mitochondrial tricarboxylic acid cycle, oxidative phosphorylation, metabolite transport, and electrophysiology. J. Biol. Chem. 2007;282:24525–24537. doi: 10.1074/jbc.M701024200. [DOI] [PubMed] [Google Scholar]
- 20.Zhou L., Cortassa S., O'Rourke B. Modeling cardiac action potential shortening driven by oxidative stress-induced mitochondrial oscillations in guinea pig cardiomyocytes. Biophys. J. 2009;97:1843–1852. doi: 10.1016/j.bpj.2009.07.029. [DOI] [PMC free article] [PubMed] [Google Scholar]
- 21.Mela L., Seitz S. Isolation of mitochondria with emphasis on heart mitochondria from small amounts of tissue. Methods Enzymol. 1979;55:39–46. doi: 10.1016/0076-6879(79)55006-x. [DOI] [PubMed] [Google Scholar]
- 22.Scaduto R.C., Jr., Grotyohann L.W. Measurement of mitochondrial membrane potential using fluorescent rhodamine derivatives. Biophys. J. 1999;76:469–477. doi: 10.1016/S0006-3495(99)77214-0. [DOI] [PMC free article] [PubMed] [Google Scholar]
- 23.Rottenberg H. Membrane potential and surface potential in mitochondria: uptake and binding of lipophilic cations. J. Membr. Biol. 1984;81:127–138. doi: 10.1007/BF01868977. [DOI] [PubMed] [Google Scholar]
- 24.Crampin E.J., Smith N.P. A dynamic model of excitation-contraction coupling during acidosis in cardiac ventricular myocytes. Biophys. J. 2006;90:3074–3090. doi: 10.1529/biophysj.105.070557. [DOI] [PMC free article] [PubMed] [Google Scholar]
- 25.Alberty R.A. Wiley-Interscience; Hoboken, NJ: 2003. Thermodynamics of Biochemical Reactions. ix, 397 p. [Google Scholar]
- 26.Vinnakota K., Kemp M.L., Kushmerick M.J. Dynamics of muscle glycogenolysis modeled with pH time course computation and pH-dependent reaction equilibria and enzyme kinetics. Biophys. J. 2006;91:1264–1287. doi: 10.1529/biophysj.105.073296. [DOI] [PMC free article] [PubMed] [Google Scholar]
- 27.Lagarias J.C., Reeds J.A., Wright P.E. Convergence properties of the Nelder-Mead simplex method in low dimensions. SIAM J. Optim. 1998;9:112–147. [Google Scholar]
- 28.Dhooge A., Govaerts W., Sautois B. New features of the software MatCont for bifurcation analysis of dynamical systems. Math. Comput. Model. Dyn. Syst. 2008;14:147–175. [Google Scholar]
- 29.Chance B., Williams G.R. Respiratory enzymes in oxidative phosphorylation. III. The steady state. J. Biol. Chem. 1955;217:409–427. [PubMed] [Google Scholar]
- 30.Nicholls D.G., Ferguson S.J. Academic Press; London/San Diego: 2002. Bioenergetics 3. 297 p. [Google Scholar]
- 31.Borutaite V., Mildaziene V., Brand M.D. Control and kinetic analysis of ischemia-damaged heart mitochondria: which parts of the oxidative phosphorylation system are affected by ischemia? Biochim. Biophys. Acta. 1995;1272:154–158. doi: 10.1016/0925-4439(95)00080-1. [DOI] [PubMed] [Google Scholar]
- 32.Wei A.C., Liu T., Cortassa S., Winslow R.L., O'Rourke B. Mitochondrial Ca2+ influx and efflux rates in guinea pig cardiac mitochondria: low and high affinity effects of cyclosporine A. Biochim. Biophys. Acta. 2011 doi: 10.1016/j.bbamcr.2011.02.012. [DOI] [PMC free article] [PubMed] [Google Scholar]
- 33.Aon M.A., Cortassa S., O'Rourke B. Redox-optimized ROS balance: a unifying hypothesis. Biochim. Biophys. Acta. 2010;1797:865–877. doi: 10.1016/j.bbabio.2010.02.016. [DOI] [PMC free article] [PubMed] [Google Scholar]
- 34.Eijgelshoven M.H., van Beek J.H., Westerhof N. Cardiac high-energy phosphates adapt faster than oxygen consumption to changes in heart rate. Circ. Res. 1994;75:751–759. doi: 10.1161/01.res.75.4.751. [DOI] [PubMed] [Google Scholar]
- 35.Demaison L., Grynberg A. Cellular and mitochondrial energy metabolism in the stunned myocardium. Basic Res. Cardiol. 1994;89:293–307. doi: 10.1007/BF00795199. [DOI] [PubMed] [Google Scholar]
- 36.Stappen R., Krämer R. Kinetic mechanism of phosphate/phosphate and phosphate/OH- antiports catalyzed by reconstituted phosphate carrier from beef heart mitochondria. J. Biol. Chem. 1994;269:11240–11246. [PubMed] [Google Scholar]
- 37.Vaughan-Jones R.D., Peercy B.E., Spitzer K.W. Intrinsic H(+) ion mobility in the rabbit ventricular myocyte. J. Physiol. 2002;541:139–158. doi: 10.1113/jphysiol.2001.013267. [DOI] [PMC free article] [PubMed] [Google Scholar]
- 38.Pietrobon D., Zoratti M., Caplan S.R. Intrinsic uncoupling of mitochondrial proton pumps. 2. Modeling studies. Biochemistry. 1986;25:767–775. doi: 10.1021/bi00352a005. [DOI] [PubMed] [Google Scholar]
- 39.Zoratti M., Favaron M., Azzone G.F. Intrinsic uncoupling of mitochondrial proton pumps. 1. Non-ohmic conductance cannot account for the nonlinear dependence of static head respiration on δ microH. Biochemistry. 1986;25:760–767. doi: 10.1021/bi00352a004. [DOI] [PubMed] [Google Scholar]
- 40.Lehninger A.L. Water uptake and extrusion by mitochondria in relation to oxidative phosphorylation. Physiol. Rev. 1962;42:467–517. doi: 10.1152/physrev.1962.42.3.467. [DOI] [PubMed] [Google Scholar]
- 41.Mitchell P. Chemiosmotic coupling in oxidative and photosynthetic phosphorylation. Biol. Rev. Camb. Philos. Soc. 1966;41:445–502. doi: 10.1111/j.1469-185x.1966.tb01501.x. [DOI] [PubMed] [Google Scholar]
- 42.Brierley G.P. The uptake and extrusion of monovalent cations by isolated heart mitochondria. Mol. Cell. Biochem. 1976;10:41–63. doi: 10.1007/BF01731680. [DOI] [PubMed] [Google Scholar]
- 43.Garlid K.D. Elsevier; Amsterdam: 2004. Chemiosmotic Theory. 405–412 p. [Google Scholar]
- 44.Bernardi P. Mitochondrial transport of cations: channels, exchangers, and permeability transition. Physiol. Rev. 1999;79:1127–1155. doi: 10.1152/physrev.1999.79.4.1127. [DOI] [PubMed] [Google Scholar]
- 45.Kaasik A., Safiulina D., Veksler V. Regulation of mitochondrial matrix volume. Am. J. Physiol. Cell Physiol. 2007;292:C157–C163. doi: 10.1152/ajpcell.00272.2006. [DOI] [PubMed] [Google Scholar]
- 46.Kohlhaas M., Liu T., Maack C. Elevated cytosolic Na+ increases mitochondrial formation of reactive oxygen species in failing cardiac myocytes. Circulation. 2010;121:1606–1613. doi: 10.1161/CIRCULATIONAHA.109.914911. [DOI] [PMC free article] [PubMed] [Google Scholar]
- 47.Ramasamy R., Liu H., Schaefer S. Ischemic preconditioning stimulates sodium and proton transport in isolated rat hearts. J. Clin. Invest. 1995;96:1464–1472. doi: 10.1172/JCI118183. [DOI] [PMC free article] [PubMed] [Google Scholar]
- 48.Bose S., French S., Balaban R.S. Metabolic network control of oxidative phosphorylation: multiple roles of inorganic phosphate. J. Biol. Chem. 2003;278:39155–39165. doi: 10.1074/jbc.M306409200. [DOI] [PubMed] [Google Scholar]
- 49.Randle P.J., Tubbs P.K. Carbohydrate and fatty acid metabolism. In: Berne R.M., Sperelakis N., Geiger R., editors. Handbook of Physiology. American Physiology Society; Bethesda: 1979. pp. 805–844. [Google Scholar]
- 50.Korzeniewski B., Mazat J.P. Theoretical studies on the control of oxidative phosphorylation in muscle mitochondria: application to mitochondrial deficiencies. Biochem. J. 1996;319:143–148. doi: 10.1042/bj3190143. [DOI] [PMC free article] [PubMed] [Google Scholar]
- 51.Beard D.A. A biophysical model of the mitochondrial respiratory system and oxidative phosphorylation. PLOS Comput. Biol. 2005;1:e36. doi: 10.1371/journal.pcbi.0010036. [DOI] [PMC free article] [PubMed] [Google Scholar]
- 52.Aon M.A., Cortassa S., O'Rourke B. Percolation and criticality in a mitochondrial network. Proc. Natl. Acad. Sci. USA. 2004;101:4447–4452. doi: 10.1073/pnas.0307156101. [DOI] [PMC free article] [PubMed] [Google Scholar]
- 53.Zhou L., Aon M.A., O'Rourke B. A reaction-diffusion model of ROS-induced ROS release in a mitochondrial network. PLOS Comput. Biol. 2010;6:e1000657. doi: 10.1371/journal.pcbi.1000657. [DOI] [PMC free article] [PubMed] [Google Scholar]
- 54.Baysal K., Brierley G.P., Jung D.W. Regulation of the mitochondrial Na+/Ca2+ antiport by matrix pH. Arch. Biochem. Biophys. 1991;291:383–389. doi: 10.1016/0003-9861(91)90150-h. [DOI] [PubMed] [Google Scholar]
Associated Data
This section collects any data citations, data availability statements, or supplementary materials included in this article.