

Abstract
Uridine phosphorylase catalyzes the reversible phosphorolysis of uridine and 2′-deoxyuridine to generate uracil and (2-deoxy)ribose 1-phosphate, an important step in the pyrimidine salvage pathway. The coding sequence annotated as a putative nucleoside phosphorylase in the Trypanosoma cruzi genome was overexpressed in Escherichia coli, purified to homogeneity, and shown to be a homodimeric uridine phosphorylase, with similar specificity for uridine and 2′-deoxyuridine, and undetectable activity towards thymidine and purine nucleosides. Competitive kinetic isotope effects (KIEs) were measured and corrected for a forward commitment factor using arsenate as the nucleophile. The intrinsic KIEs are: 1′-14C = 1.103, 1,3-15N2 = 1.034, 3-15N = 1.004, 1-15N = 1.030, 1′-3H = 1.132, 2′-2H = 1.086 and 5′-3H2 = 1.041 for this reaction. Density functional theory was employed to quantitatively interpret the KIEs in terms of transition state structure and geometry. Matching of experimental KIEs to proposed transition state structures suggests an almost synchronous, SN2-like transition state model, in which the ribosyl moiety possesses significant bond order to both nucleophile and leaving group. Natural bond orbital analysis allowed a comparison of the charge distribution pattern between the ground state and the transition state model.
The kinetoplastid Trypanosoma cruzi, the etiologic agent of Chagas disease, possesses all genes codifying the six enzymes involved in de novo pyrimidine biosynthesis,1 while the salvage pathway had only been suggested based on observation of uridine phosphorylase (UP)2 activity in cell extracts.3 Recently, a putative nucleoside phosphorylase from the related protozoan Trypanosoma brucei was demonstrated to be a homodimeric UP, and a UP-specific region was identified and proposed to provide a tool to identify UPs from amino acid sequence alignments. The UP-specific region of the T. brucei genome was identified in T. cruzi and annotated as a putative nucleoside phosphorylase, which was then suggested to be a UP.4
Uridine phosphorylase (EC 2.4.2.3) catalyzes the reversible phosphorolysis of (2′-deoxy)uridine to form (2-deoxy)ribose 1-phosphate (R-1-P) and uracil5 (Scheme 1A), an important step in the pyrimidine salvage pathway.6 The reaction equilibrium favors nucleoside formation, and the equilibrium constant (Keq) was calculated, using Haldane relationships, to be approximately 0.6.7 This enzyme has been classified as a member of the nucleoside phosphorylase-I (NP-I) family, which includes enzymes that catalyze ribosyl transfer reactions, such as purine nucleoside phosphorylase (PNP) and methylthioadenosine phosphorylase (MTAP), on the basis of a common α/β – subunit fold and the inability to accept thymidine as substrate.8
Scheme 1.

UP-catalyzed (A) phosphorolysis and (B) arsenolysis of uridine.
Kinetic isotope effects (KIEs) have long been used to obtain information about reaction transition state structure and geometry, since KIEs originate primarily from differences in bond vibration frequencies as a molecule goes from the ground state to the transition state in the course of a chemical reaction.9,10 Transition state analyses utilizing KIEs and computational modeling have been reported for both non-enzymatic and enzymatic ribosyl transfer reactions involving purine,11–13 and pyrimidine and pyridine14–17 nucleosides and nucleotides. Some of these transition state models served as blueprints for the design of transition state analogues that act as potent enzyme inhibitors.18,19
Here the T. cruzi protein annotated as a putative nucleoside phosphorylase was expressed, purified to homogeneity, and demonstrated to be a uridine phosphorylase by substrate specificity studies. The oligomeric state of the protein was assessed by size-exclusion chromatography, and the substrate specificity was determined by steady-state kinetics. A combination of competitive KIEs measured with arsenate as nucleophile, isotope trapping experiment, and density functional theory (DFT) was employed to propose a transition state model for the reaction catalyzed by T. cruzi UP (TcUP). The bond order and charge distribution differences between ground state and transition state, as well as the implications of the model for the chemical mechanism of the reaction, are discussed.
Materials and Methods
Materials
D-[1-3H]Ribose, D-[1-14C]ribose, and D-[6-3H2]glucose were purchased from American Radiolabeled Chemicals, Inc. D-[6-14C]glucose was purchased from PerkinElmer, Inc. [1,3-15N2]Orotate and deuterium oxide were obtained from Cambridge Isotope Laboratories, Inc. Pyruvate kinase (PK), myokinase (MK), hexokinase (HK), glucose-6-phosphate dehydrogenase (G6PDH), glutamic acid dehydrogenase (GDH), 6-phosphogluconic acid dehydrogenase (6PGDH), and phosphoriboisomerase (PRI) were from Sigma-Aldrich®. Alkaline phosphatase (AP) was from Roche. Ribokinase (RK) and phosphoribosyl-α-1-pyrophosphate synthetase (PRPPase) were prepared as previously described.20,21 UMP synthase (UMPS) and [3-15N]orotate were kind gifts from, respectively, Keith Hazleton and Yong Zhang of this laboratory. All other chemicals and reagents were obtained from commercial sources and were used without further purification.
Expression and purification of TcUP
The expression vector pJexpress414 containing the DNA sequence annotated as a T. cruzi putative nucleoside phosphorylase (GeneDB ID Tc00.1047053509569.100), with an N-terminal His-tag-encoding sequence and optimized codons for heterologous expression in Escherichia coli, was obtained from DNA 2.0, Inc. The construct was transformed into E. coli BL21(DE3) RIPL cells (Novagen). The transformed cells were grown in Luria-Bertani medium containing 100 g mL−1 ampicillin, at 37°C, to an OD600nm of 0.5, and induced by addition of isopropyl-1-thio-β-D-galactopyranoside to a final concentration of 1 mM. Cells were allowed to grow for an additional 15 h period and harvested by centrifugation at 20,800 g for 30 min. All purification procedures were carried out at 4°C. Cells were re-suspended and incubated for 30 min in 25 mL of buffer A (20 mM Tris-HCl, 5 mM imidazole, 500 mM NaCl, pH 7.9) containing 0.2 mg mL−1 lysozyme, 0.05 mg mL−1 DNAse I, and a tablet of CØmplete protease inhibitor cocktail (Roche), disrupted with a French press, and centrifuged at 48,000 g for 30 min to remove cell debris. The supernatant was loaded onto a Ni-NTA column pre-equilibrated with buffer A. The column was washed with 6 column volumes of buffer A, and 10 column volumes of buffer B (20 mM Tris-HCl, 50 mM imidazole, 500 mM NaCl, pH 7.9). The adsorbed material was eluted with 6 column volumes of buffer C (20 mM Tris-HCl, 150 mM imidazole, 500 mM NaCl, pH 7.9), analyzed by SDS-PAGE,22 concentrated using a 10,000 Da molecular weight cutoff Amicon ultrafiltration membrane, dialyzed against 4 L of 100 mM HEPES pH 7.5, and stored at −80°C. Protein concentration was determined spectrophotometrically at 280 nm using the theoretical extinction coefficient (ε280) of 19,410 M−1 cm−1 (http://expasy.org). The protein was further characterized by trypsin digestion and matrix-assisted laser desorption/ionization time of flight mass spectrometry (MALDI-TOF).
Oligomeric state determination
The molecular mass of the purified protein was estimated by gel-filtration chromatography using a Sephacryl S-200 26/60 column (GE Healthcare). All samples, were run at 0.5 mL min−1 in 100 mM HEPES, pH 7.5, at 4°C. Bovine thyroglobulin (670,000 Da), bovine γ-globulin (158,000 Da), chicken ovalbumin (44,000 Da), horse myoglobin (17,000 Da), and vitamin B12 (1,350 Da) (Bio-Rad) were employed as molecular weight (MW) standards. The Kav value for each protein was calculated with eq 1, where Ve is the elution volume, Vt is the total column volume, and V0 is the void volume. Kav was plotted against the logarithm of MW.
| eq 1 |
HPLC method
The formation of pyrimidine or purine bases upon nucleoside phosphorolysis was assessed by reverse-phase chromatography, at room temperature, using an HPLC model 2487 (Waters) and an analytical C18 Delta Pak column (Waters) pre-equilibrated with 10 column volumes of 50 mM triethylamine:acetic acid, pH 5.0. Each sample was injected and run at 1.0 mL min−1 in the same buffer, and base and nucleoside elution were followed by the increase in absorbance at the appropriate wavelength. A typical reaction mixture (300 μL) contained 10 μM TcUP, 100 mM HEPES, pH 7.5, 50 mM phosphate, and 200 μM nucleoside. Reactions were allowed to proceed for 45 minutes prior to HPLC analysis. Each nucleoside and the respective base were run as standards to determine their retention time. In control experiments, TcUP, nucleoside, and phosphate were omitted, one at a time, from the reaction mixture.
Enzymatic assay and substrate specificity of TcUP
All assays were performed under initial rate conditions at 25°C and 100 mM HEPES, pH 7.5, in 120μL, unless otherwise stated. The decrease in absorbance at 282 nm upon conversion of (2′-deoxy)uridine to uracil (Δε = 1,600 M−1 cm−1),23 in the presence of TcUP, in either phosphorolytic (Scheme 1A) or arsenolytic (Scheme 1B) reactions, was monitored in an SX-20 stopped-flow spectrophotometer outfitted with a mercury-xenon lamp (Applied Photophysics). The substrate specificity and apparent steady-state parameters of the enzyme were determined by measuring TcUP activity in the presence of varying concentrations of one substrate and fixed, saturating concentrations of the other. In all cases, the concentration of TcUP was 20 nM. Each data point is the average of at least ten replicates measured on the stopped-flow. The data was fitted to eq 2, where v is the initial rate, V is the maximal velocity, A is the concentration of the varying substrate, and KM is the Michaelis constant for the varying substrate.
| eq 2 |
Synthesis and purification of isotopically labeled uridines
[1′-3H]UMP and [1′-14C]UMP were enzymatically synthesized at 37°C from [1-3H]ribose and [1-14C]ribose, respectively (Scheme S1, available as Supporting Information). Each reaction mixture contained 1 mM ribose, 20 mM phosphoenolpyruvate (PEP), 0.2 mM ATP, 20 mM MgCl2, 1.2 mM orotate, 100 mM KH2PO4 (pH 7.5), 50 mM KCl, 1 mM DTT, 0.2 U mL−1 of PRPPase, 2 U mL−1 PK, 2 U mL−1 MK, 1 U mL−1 UMPS, and 1 U mL−1 RK.
For the synthesis of [5′-3H2]- and [5′-14C]UMP, D-[6-3H2]- and D-[6-14C]glucose were, respectively, utilized as precursors (Scheme S1, available as Supporting Information). Each reaction mixture contained 1 mM glucose, 20 mM PEP, 0.2 mM ATP, 20 mM MgCl2, 1.2 mM orotate, 140 mM KH2PO4 (pH 7.5), 50 mM KCl, 2.5 mM DTT, 0.2 mM NADP+, 20 mM α-ketoglutarate (α-KG), 5.5 mM NH4Cl, 0.2 U mL−1 PRPPase, 2 U mL−1 PK, 2 U mL−1 MK, 1 U mL−1 UMPS, 1 U mL−1 G6PDH, 1 U mL−1 6PGDH, 0.5 U mL−1 PRI, 1 U mL−1 GDH, and 0.2 U mL−1 HK. Orotate was replaced by [1,3-15N2]- and [3-15N]orotate for the synthesis of [5′-14C,1,3-15N2]- and [5′-14C,3-15N]orotate, respectively. To synthesize [5′-14C,2′-2H]UMP, the reaction mix with D-[6-14C]glucose was prepared in D2O. The deuterium was incorporated by the reaction catalyzed by PRI, and the deuterium content in the final product was determined by electrospray ionization mass spectrometry (ESI-MS).
Labeled UMPs, synthesized in 1 mL reaction volumes, were purified by HPLC using the same method described above. The solvent was evaporated by centrifugation under vacuum, and the pellet was dissolved in water. The labeled UMPs were converted to labeled uridines via the AP-catalyzed reaction, and the labeled uridines were purified with the same protocol utilized for UMP purification.
Determination of forward commitment factor
The forward commitment (Cf) for uridine in the arsenolysis catalyzed by TcUP was measured by the isotope trapping method.24 Pulse incubation mixtures (20 μL) containing 20 μM TcUP, 50 μM [5′-14C]uridine, and 100 mM HEPES, pH 7.5, at 25°C, were chased with a solution (480 μL) consisting of 2 mM uridine, 100 mM HEPES, pH 7.5, and 1 mM NaH2AsO4. After 5 s, the reactions were quenched with 50 μL of 1 N HCl and loaded onto charcoal columns (W. R. Grace & Co.) pre-equilibrated with 10 mM ribose in 10% ethanol (v/v). [5-14C]Ribose was eluted with 3 mL of 10 mM ribose in 10% ethanol (v/v), dried centrifugation under vacuum, and dissolved in 100 μL of water and 10 mL of scintillation fluid (Perkin-Elmer). Radioactivity was counted for 10 min in a Tricarb 2910 TR scintillation counter (Perkin-Elmer). The values obtained in the absence of arsenate were used as background to correct the others. The final value is the average of eight replicates in two independent experiments. Cf was calculated with eq 3, where Cf is the forward commitment, and Y is ratio of moles of R-1-P to moles of TcUP-uridine complex. The concentration of TcUP-uridine complex was calculated according to eq 4, where ES is the concentration of the TcUP-uridine complex, E is the total concentration of enzyme in the pulse, S is the total concentration of uridine in the pulse, and KM is the Michaelis constant for uridine.
| eq 3 |
| eq 4 |
Measurement of KIEs
All KIEs were measured by the competitive radiolabel method,21 at 25°C. A typical reaction mixture (1 mL) contained 10 mM NaH2AsO4, 10 nM TcUP, 100 mM HEPES, pH 7.5, and 100 μM uridine (3H-labeled, 14C-labeled, and cold carrier). The arsenolysis was allowed to proceed to 15 to 20% completion, when half of the reaction mixture was loaded onto charcoal columns (Grance). The remainder of the reaction was completely converted to products by addition of 4μM TcUP and loaded onto charcoal columns. Column pre-equilibration and elution steps, as well as sample preparation for scintillation counting, followed the same procedures described for the isotope trapping experiment. A sample with only [14C]uridine was also counted as a standard. At least ten replicates, in two independent experiments, were averaged for each KIE.
Samples were counted in dual-channel fashion, with the 3H signal appearing only in channel 1, and the 14C signal, in both channels. The initial ratio of 3H to 14C counts per minute (cpm) was 2:1, and enough material was used so that at least 10,000 cpm of 14C were obtained in channel 2. The total 3H signal was assessed by eq 5, and the total 14C signal, by eq 6, in which 3H is the total number of cpm for this isotope, 14C is the total number of cpm for this isotope, channel 1 and channel 2 are the number of cpm in each channel, and r is the channel 1 to channel 2 ratio of 14C standard.21
| eq 5 |
| eq 6 |
Experimental KIEs were calculated and extrapolated to 0% reaction using eq 7, where Rf and R0 are the ratios of heavy to light isotopes at partial and complete conversions, respectively, and f is the fraction of substrate conversion.
| eq 7 |
Computational methods
The nucleophilic substitution reaction involving arsenate and uridine was studied by DFT in B3LYP and using a 6–31G** basis set as implemented in Gaussian 09.25 All ground state structures were located as global minima and frequency calculations performed on the optimized structures contained no imaginary frequencies. All located transition structures, with and without geometric constraints, possessed only one calculated imaginary frequency, a characteristic of first-order saddle points that correspond to true transition states.26 The isotope effects for each of the theoretical transition structures were calculated from scaled theoretical vibrational frequencies using ISOEFF98.27 Tunneling corrections were applied using a one-dimensional infinite parabolic barrier model.28
Results and Discussion
Purification, activity, and oligomeric state of TcUP
The N-terminal His-tagged enzyme was successfully overexpressed and purified to homogeneity. MALDI-TOF-TOF mass spectrometry analysis confirmed that the amino acid sequence of the homogeneous protein was that annotated as a putative nucleoside phosphorylase from the T. cruzi genome.
In reaction mixtures containing either uridine or 2′-deoxyuridine and phosphate, uracil was formed (Figure 1). No nucleobase formation was detected when reaction mixtures contained thymidine, cytosine, orotidine, or any of the purine nucleosides. Controls without phosphate eliminated a hydrolytic reaction for uracil formation under conditions that would have detected a rate 10−6 that of phosphorolysis. Thus TcUP is a (2′-deoxy)uridine-specific uridine phosphorylase that does not catalyze nucleoside hydrolysis in the absence of phosphate, as do some purine and pyrimidine phosphorylases.29,30 This is in agreement with the specificity proposed for most UP members of the NP-I family,8 but contrasts with the detected, though small, activity towards thymidine reported for T. brucei UP.4 The lack of hydrolysis of uridine by TcUP may also relate to the chemical stability of its N-ribosidic bond, which is stable to 1 N HCl at 100 °C for more than 3 days.31
Figure 1.

HPLC elution profile of TcUP-catalyzed reactions. (A) Uridine, 2′-deoxyuridine, and uracil run as standards. (B) Phosphorolysis of uridine. (C) Phosphorolysis of 2′-deoxyuridine.
Molecular sieve chromatography estimated the molecular weight of TcUP to be 76,000 ± 2,280 Da. The calculated MW of the subunit, based on the amino acid sequence of the His-tagged protein, is 38,630 Da (http://expasy.org), suggesting that TcUP is a homodimer in solution. The same oligomeric state has been proposed for T. brucei UP.4
Substrate specificity and apparent kinetic parameters
The kinetic parameters for TcUP and uridine are in the range reported for E. coli UP7 and human UP (Table 1).32 The specificity of TcUP for uridine and 2′-deoxyuridine is comparable, evidenced by the similar values of the specificity constants (kcat KM). Thus, the ribosyl 2′-OH group is not essential for substrate binding or catalysis. TcUP also accepts arsenate as nucleophile, as is observed for other nucleoside phosphorylases.12,13,16
Table 1.
TcUP apparent steady-state kinetic parameters.
| Varying substrate | kcat (s−1) | KM (μM) | kcat/KM (M−1 s−1) |
|---|---|---|---|
| Uridine | 12±1 | 21±2 | 5.7×10⁵ |
| Phosphate | 298±23 | 4.0×10⁴ | |
| 2′-deoxyuridine | 15±1 | 32±4 | 4.7×10⁵ |
| Phosphate | 385±41 | 3.9×10⁴ | |
| Uridine | 6±1 | 20±2 | 3.0×10⁵ |
| Arsenate | 183±17 | 3.3×10⁴ |
Commitments to catalysis
Cf, the forward commitment, is the probability of a substrate to proceed forward to catalysis, after the Michaelis complex is formed, as opposed to dissociating to free substrate. The reverse commitment (Cr) reflects the tendency for the first enzyme-product complex following the isotope-sensitive step to undergo catalysis in the reverse direction instead of moving forward to free product and enzyme through the first irreversible step.33 Cf always refers to the substrate carrying the isotopic label when dealing with competitive KIEs,34 uridine in the present study. Significant commitment factors obscure KIE expression, and knowing their values permits calculation of intrinsic KIEs.35 A Cf value of 0.283 ± 0.012 was measured for uridine with TcUP, using arsenate as nucleophile. This value is similar to those reported for His257Phe (0.300 ± 0.010)36 and Lys22Glu-His104Arg (0.239 ± 0.025)37 mutants of human PNP, and for Val39Thr-Asn123Lys-Arg210Gln mutant of bovine PNP (0.243 ± 0.026),38 and permits correction of experimental KIEs to yield intrinsic values. The isotope trapping experiment establishes that uridine can bind to free enzyme, leading to a catalytically competent complex upon arsenate binding. The result eliminates a mandatory ordered kinetic mechanism in which the nucleophile binds to the free enzyme.
Experimental and intrinsic KIEs
Competitive KIEs measured for the TcUP-catalyzed arsenolysis of uridine, and their corresponding position and type, are shown in Table 2. In enzymatic reactions, the competitive method provides isotope effects on V/K, therefore reporting on steps starting with free substrate up to, and including, the first irreversible step.39 Quantitative information on the transition state structure can only be gathered from intrinsic KIEs, the ones reporting on the microscopic chemical step of the enzymatic reaction.34 Experimental KIEs can be corrected for Cf and Cr to yield intrinsic ones, according to eq 8, where LV/K is the experimental KIE on V/K, Lk is the intrinsic KIE, and LKeq is the isotope effect on the equilibrium constant.40
Table 2.
Kinetic isotope effects for the TcUP-catalyzed arsenolysis of uridine
| Heavy uridine | Light uridine | Type of KIE | Experimental KIE | Intrinsic KIE | Predicted KIE |
|---|---|---|---|---|---|
| 1′-3H | 5′-14Ca | α – Secondary | 1.103±0.004 | 1.132±0.005 | 1.126 |
| 1′-14C | 5′-3H2 | Primary | 1.080±0.003b | 1.103±0.004 | 1.109 |
| 5′-14C,2′-2H | 5′-3H2 | β – Secondary | 1.067±0.003b,c | 1.086±0.004 | 1.080 |
| 5′-14C,1,3-15N | 5′-3H2 | Primary and β – Secondary | 1.027±0.003b | 1.034±0.004 | 1.027 |
| 5′-14C,3-15N | 5′-3H2 | β – Secondary | 1.003±0.002b | 1.004±0.003 | 1.002 |
| 5′-14C,1-15N | – | Primary | 1.024±0.004d | 1.030±0.005 | 1.025 |
| 5′-3H2 | 5′-14C | δ – Secondary | 1.032±0.002 | 1.041±0.003 | 1.058 |
The remote 5′-14C KIE is assumed to be unity.
Experimental values corrected for remote 5′-3H2 KIE according to the equation .
Experimental values corrected for 2H content according to the equation , where F is the fraction of 2H in the substrate.
Experimental values corrected for 3-15N KIE according to the equation KIE = KIEobs/3-15N KIE.
| eq 8 |
Arsenate is used to replace phosphate in studies of nucleoside phosphorylase reactions inasmuch as the product ribose 1-arsenate is rapidly hydrolyzed to ribose. This renders the overall reaction irreversible, and reduces eq 8 to eq 9 as Cr is negligible.12 Accordingly, intrinsic KIEs for the TcUP-catalyzed reaction were obtained upon correction for Cf (Table 2). Further evidence that Cf is the only term reducing the experimental KIEs from their intrinsic values is provided by the 1-15N KIE, which, after correction for Cf, is equal, within experimental error, to the maximum value found computationally for any possible mechanism or transition state structure of this reaction (discussed below).41
| eq 9 |
The large value of the 1′-14C KIE and the relatively modest value of the 1′-3H KIE suggest a bimolecular ANDN mechanism42 with an SN2-like transition state. In nucleophilic substitution reactions of nucleosides, large primary 14C KIEs occur only with significant bond order between the developing oxocarbenium ion and both leaving group and attacking nucleophile at the transition state. The relatively small α-secondary 3H KIEs indicate incomplete sp3 to sp2 rehybridization at the transition state.43 The large 1-15N KIE is consistent with extensive, but not full, 1′-C to1-N bond loss at the transition state, with some bond order remaining,44 as indicated by the 1′-14C KIE. The large 2′-2H KIE suggests significant hyperconjugation between the 2′-C – 2′-H σ-bond and the developing vacant 1′-C p-orbital, forming a partial 1′-C – 2′-C π-bond.45 As the 2′-C – 2′-H bond is weakened by electron density loss, the β-secondary 2H KIE increases.14 The isotope effects eliminate a steady-state ordered kinetic mechanism in which uridine is the first substrate to bind to the enzyme, as saturating arsenate concentration in this mechanism would decrease the KIEs to unity.46 Interpretation of the intrinsic KIEs in terms of transition state structure was attempted using DFT-based modeling.
Ground state and transition state search
The lowest energy reactant geometry was identified by optimizing uridine structures with distinct conformations of the ribosyl ring and orientations of uracil (coordinates for reactant structures are available as Supporting Information). A structure with a 3′-exo ribosyl pucker and the 2-O of uracil poised to accept a hydrogen-bond (H-bond) from the 5′-OH was found to be the global minimum (Figure 2A). The choice of appropriate starting material is essential for accurate prediction of KIEs, as they reflect changes in bonding environment of atoms in the transition state relative to the lowest energy initial material free in solution.14
Figure 2.

Stick models of DFT (B3LYP/6-31+G**)-optimized structures of (A) ground state and (B) transition state. Carbon atoms are shown in gray, oxygen in red, hydrogen in cyan, nitrogen in blue, and arsenic in green. The dashed lines (black) represent rC-N and rC-O, and the dotted lines (blue) represent the distance between hydrogen and H-bond acceptor atoms. The full H-bond distances are described in the text.
A systematic search for transition structures was conducted by varying the distances between 1′-C and 1-N (rC-N), and 1′-C and the nucleophilic oxygen of arsenate (rC-O) (Scheme 2) by 0.2 Å increments. KIEs were calculated for every optimized structure and compared with intrinsic values (coordinates and predicted KIEs for all transition structure geometries are available as Supporting Information). The geometry that best reproduced the intrinsic KIEs, particularly the distinct, large 1′-14C KIE, was further analyzed, as the primary carbon KIE is the most informative one for investigation of transition state structure and geometry of ribosyl-transfer reactions.47
Scheme 2.
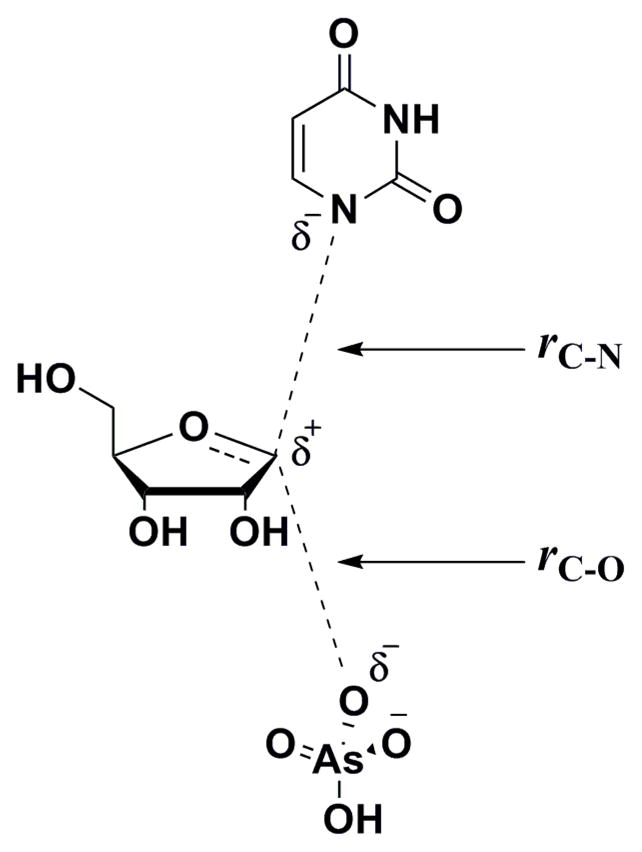
General transition state for TcUP-catalyzed arsenolysis of uridine.
Enzymatic transition structures and predicted KIEs
The transition structures selected from the initial search were systematically modified in terms of rC-N and rC-O, with increments of 0.1 Å, and of 5′-O – 5′-C – 4′-C – 4′-O and of 2′-C – 1′-C – 1-N – 2-C dihedral angles, and re-optimized. After calculation of KIEs for each structure, the best matches were selected upon comparison with intrinsic values (coordinates and predicted KIEs for transition structure geometries with varying dihedrals are available as Supporting Information). An orientation with an H-bond between 5′-OH and 1-N yielded calculated KIEs in excellent agreement with intrinsic values, and was stable enough to be maintained with different rC-N and rC-O even after the constraint on the 5′-O – 5′-C – 4′-C – 4′-O dihedral angle was removed.
The orientation of uracil was important for accurate prediction of the 2′-2H KIE. However, all transition structures that provided calculated KIE values in accordance with intrinsic ones were characterized by two imaginary frequencies, indicating that the structures were not located in first-order saddle points.26 To overcome this difficulty, the side chain of an amino acid residue was added to the model. This approach has recently been successfully employed to model the transition states of the reactions catalyzed by human thymidine phosphorylase (TP)16,30 and Phe200Gly mutant of human PNP.48 As a three-dimensional structure of TcUP is not yet available, the crystal structure of T. brucei UP4 was utilized to identify a residue that contacts uracil. The two enzymes share 100 % amino acid sequence identity in the active site, and the chosen residue, glutamine (Gln) 248 (Gln249 in TcUP) is conserved in all uridine phosphorylases characterized.4 The glutamine side chain was inserted in the transition state model to stabilize the anionic uracil leaving group via H-bond contacts with the 2-O and 3-N of uracil anion, similarly to the crystal structure.4 This orientation of uracil, with the 2-O directed away from the 5′-OH and 2′-H, provided a good match of the 2′-2H KIE. The final transition structure (Figure 2B) possesses a 2′-C – 1′-C – 1-N – 2-C dihedral angle of 85°, is characterized by a single imaginary frequency corresponding to motion along the reaction coordinate, and its calculated KIEs provide the best match for the intrinsic values (Table 2).
In the model represented in Figure 2B, rC-N = 2.1 Å and rC-O = 2.3 Å. Thus, TcUP-catalyzed arsenolysis of uridine proceeds via an almost synchronous ANDN transition state with moderate oxocarbenium ion character. This is in contrast with the dissociative transition state models, with no significant participation of the attacking nucleophile, reported for inosine arsenolysis by bovine, malarial, and human PNP,12,47 and for the hydrolytic cleavage of the N-glycosidic bond of 2′-deoxyuridine in DNA, catalyzed by E. coli uracil DNA glycosylase (UDG),49 while in agreement with the almost synchronous, though less tight, transition state structure proposed for the NAD+ hydrolysis catalyzed by diphtheria toxin.44 SN2 mechanisms have also been reported for E. coli UP phosphorolysis,50 and for human TP-catalyzed arsenolysis of thymidine, however in the latter, bond breaking was significantly more advanced than bond making at the transition state.16
A comparison of substrate and transition structures highlights the differences in forming the transition state. In reactant uridine, the 5′-OH group is oriented in a syn configuration, and the distance between the ribosyl 5′-O and the uracil 2-O is 2.82 Å, allowing an intramolecular H-bond (Figure 2A). At the transition state, the 5′-OH group is in a syn configuration, but is positioned to H-bond with the leaving group 1-N, with a 5′-O – 1-N distance of 3.18 Å, while the carbonyl 2-O is turned away from the ribosyl plane and interacts with the amino group of the glutamine side chain (Figure 2B). The ribosyl group of uridine has a 3′-exo and 2′-endo pucker (Figure 2A), and assumes a flatter conformation at the transition state, with a less pronounced 3′-exo pucker (Figure 2B). This conformation favors hyperconjugation between the 2′-C – 2′-H bond and the partially unoccupied 1′-C p-orbital.45 The syn configuration of the 5′-OH group and the distortion of the ribosyl pucker are features observed in other enzymatic N-ribosidic cleavage reactions, and are proposed to be a strategy to help stabilize the charge development in the ribosyl moiety at the transition state.12,44,49,51
Pauling bond orders and charge distribution at the transition state
Pauling bond order (ni-j) is an exponential function of interatomic distance and represents the number of electron pairs shared by atoms i and j in a chemical bond.52 Comparison of ni-j values for bonds in the reactant state and transition state structures provides quantitative information on the geometry and hybridization of a molecule along the reaction coordinate. Accordingly, Pauling bond orders for specific bonds in uridine and in the transition structure were calculated using eq 10, for multiple bonds (ni-j > 1), or eq 11, for partial bonds (ni-j < 1), where nij is the bond order between atoms i and j, rb is the bond length for a single bond between atoms of elements i and j, and rij is the bond length between atoms i and j.53
| eq 10 |
| eq 11 |
Bond orders (Table 3) are significant (nC1′-N1 and nC1′-O(As) of 0.35 and 0.25, respectively) at the transition state, in agreement with the large intrinsic 1′-14C and 1-15N KIEs. Since ni-j is a nonlinear function of bond distance, a small difference in length between bonds being broken and formed at the transition state (0.2 Å) reflects a significant difference in bond order. The gain in nC1′-C2′ and the loss in nC2′-H2′ as the reaction reaches the transition state agrees with hyperconjugation in the ribosyl moiety,14 as discussed above, and explains the significant intrinsic 2′-2H KIE. Incomplete sp2 hybridization of 1′-C is indicated by the nC1′-O4′ of 1.49, in conformity with the relatively modest intrinsic 1′-3H KIE of 1.132. In comparison, nC1′-O4′ = 1.65 at the transition state of human TP-catalyzed arsenolysis of thymidine, with 1′-3H KIE = 1.177,16 and nC1′-O4′ = 1.71 at the transition state of inosine arsenolysis catalyzed by the Phe200Gly mutant of human PNP, for which 1′-3H KIE = 1.254.48 These two reactions proceed by highly asynchronous ANDN mechanisms, with more complete sp2 character in the ribosyl moiety of their transition state structures16,48 than in the nearly synchronous ANDN mechanism reported here. A modest decrease in nN3-C2 is observed in the transition structure, consistent with the normal intrinsic 3-15N KIE (Table 2). It is noteworthy that the bond order analysis of the DFT-derived transition state model (Figure 2B) is in agreement with the qualitative interpretation of the intrinsic KIEs discussed above.
Table 3.
Bond distances and Pauling bond orders in the ground state and transition state structures of TcUP-catalyzed reaction
| Bond | Bond distance in ground state (Å) | Bond distance in transition state (Å) | Bond order in ground statea | Bond order in transition statea |
|---|---|---|---|---|
| 1′-C – 1-N | 1.47 | 2.10 | 1.00 | 0.35 |
| 1′-C – O(As) | 2.30 | – | 0.25 | |
| 1′-C – 4′-O | 1.41 | 1.31 | 1.07 | 1.49 |
| 1′-C – 2′-C | 1.55 | 1.53 | 0.98 | 1.03 |
| 1′-C – 1′-H | 1.09 | 1.04 | 1.00 | 1.18 |
| 2′-C – 2′-H | 1.09 | 1.10 | 1.00 | 0.98 |
| 4′-C – 4′-O | 1.45 | 1.48 | 0.97 | 0.92 |
| 5′-C – 5′-O | 1.41 | 1.42 | 1.07 | 1.03 |
| 4′-C – 5′-C | 1.53 | 1.52 | 1.03 | 1.07 |
| 1-N – 2-C | 1.40 | 1.37 | 1.27 | 1.40 |
| 1-N – 6-C | 1.38 | 1.36 | 1.35 | 1.44 |
| 3-N – 2-C | 1.38 | 1.39 | 1.35 | 1.31 |
| 3-N – 4-C | 1.41 | 1.41 | 1.22 | 1.22 |
Atomic charge distribution of reactants and transition states is useful to understand catalytic strategies and transition state analogue design.54 Hence, natural bond orbital (NBO) charges were calculated for the TcUP transition state model and compared with reactant uridine (Figure 3). As expected, the most conspicuous changes in NBO charges occur in the atoms along the reaction coordinate with 1′-C becoming more cationic, and 1-N, more anionic as the N-ribosidic bonding electrons are pushed towards uracil at the transition state. Concurrently, the attacking arsenate oxygen is partially bonded and therefore less negative at the transition state than in the reactant.48 A small reduction in electron density occurs on 4′-O, since it forms a partial π-bond with 1′-C, as evidenced by the nC1′-O4′ of 1.49. In the uracil moiety, 5-C and 4-O accumulate extra electron density in the transition structure, due to electron delocalization on the pyrimidine ring to stabilize the incoming N-ribosidic bond electrons. The negative charges on the uracil moiety at the transition structure may be slightly under predicted in comparison with uridine, owing to the stabilization from an H-bond with the glutamine side chain. The glutamine amide donates an H-bond (2.74 Å) to the leaving group 2-O, while its carbonyl oxygen accepts an H-bond (3.15 Å) from the uracil 3-N (Figure 2B). Similar H-bond patterns are observed between Gln248 and product uracil in the T. brucei UP crystal structure.4
Figure 3.

NBO charge distribution in (A) ground state and (B) transition state of TcUP-catalyzed reaction, and in (C) the theoretical intermediates in case the reaction proceeded by a stepwise mechanism. Negative charges are shown in red, and positive charges in blue.
NBO charges were also calculated for the theoretical intermediates that would be formed if the reaction proceeded via a stepwise, SN1 mechanism (Figure 3C). The most pronounced differences occur in the fully formed ribooxocarbenium ion, in which both 1-C and 4-O are significantly more deficient in electron density as compared with their counterparts in the SN2-like transition state for TcUP-catalyzed reaction (Figure 3B). This attests to the relatively modest oxocarbenium-ion character in the transition state for this reaction, as suggested above by the qualitative interpretation of the intrinsic KIEs.
Other chemical mechanisms
The intrinsic KIEs obtained here are consistent with a concerted, ANDN mechanism (Scheme 3, path in green). However, elimination of alternative mechanisms is also necessary. All bimolecular transition structures with a protonated leaving group failed to yield theoretical KIEs that matched the experimental values. Negatively charged nucleobases have also been described in the transition state models of human and malarial orotate phosphoribosyl transferases,15,55 human TP,30 and uracil DNA glycosylase.49
Scheme 3.

Three general nucleophilic substitution mechanisms considered for TcUP-catalyzed arsenolysis of uridine. In blue, DN*AN‡ stepwise mechanism; in green, ANDN concerted mechanism; in red, DN‡*AN stepwise mechanism. The double dagger denotes the rate-limiting step.
In stepwise DN*AN‡ mechanisms,42,43 where the nucleobase departs first, followed by the rate-limiting attack of the nucleophile on the ribooxocarbenium ion (Scheme 3, path in blue), the KIEs are the product of the equilibrium isotope effect (EIE) for the first step and the KIE for the second step.30,56,57 For uridine arsenolysis, the predicted 1,3-15N2 EIEs were in agreement with the intrinsic values for a negatively charged uracil (1.027), but did not match the calculated values for the departure of a neutral uracil with a proton on either 1-N (1.008) or 4-O (1.020) positions. In all cases, the products of the remaining EIEs and KIEs, for several rC-O, were inconsistent with the experimental results, including that for 1′-14C KIE, where the largest predicted KIE for a DN*AN‡ mechanism was (1.066).
A stepwise DN‡*AN mechanism,42,43 involving the rate-determining break of the N-ribosidic bond and a subsequent nucleophilic attack on the ribooxocarbenium intermediate (Scheme 3, path in red), as described for bovine PNP-catalyzed arsenolysis of inosine,12 was also considered. The largest calculated 1′-14C KIE (1.070) for this mechanism was significantly smaller than the intrinsic value, ruling out this mechanism as a possibility. The last mechanism modeled was a DN*AN mechanism featuring an intermediate energetically similar to the transition state, with comparable barrier heights for bond breaking and formation, as proposed for the arsenolytic cleavage of inosine catalyzed by human PNP, in which all measured isotope effects were EIEs reporting on the formation of the ribooxocarbenium ion.47 This mechanism is readily eliminated in the present work, since the predicted 1′-14C EIE was essentially unity, the 1′-3H EIE was three times as large as the intrinsic value, and the 5′-3H2 EIEs were inverse.
It should be pointed out that the term nucleophile-assisted SN1 has been invoked to describe transition structures characterized by very low bond orders to both leaving group and nucleophile, although where the presence of the latter at the transition state is mandatory to yield calculated KIEs that match experimental values.58 Nonetheless, the bond orders in the transition structure proposed for the TcUP reaction are significant, and reactions with transition structures of comparable bond order values to the ones presented here have widely been interpreted as SN2.16,43,56
Summary
The T. cruzi protein annotated as a putative nucleoside phosphorylase is a (2′-deoxy)uridine-specific homodimeric uridine phosphorylase that accepts arsenate as an alternative to phosphate as nucleophile. Intrinsic KIEs matched calculated KIEs for a DFT-derived transition state model in which both leaving group and incoming nucleophile possess significant bond order to the electrophile being transferred, with rC-N = 2.1 Å and rC-O = 2.3 Å. The reaction proceeds via an ANDN chemical mechanism in which uracil departs as a negative species stabilized by interactions with the enzyme. The intrinsic KIEs are fully compatible with an ANDN mechanism and are inconsistent with other mechanisms for nucleophilic substitutions. Significant changes in Pauling bond orders and NBO charge distribution take place as the reaction proceeds from the ground state to the transition state. To the best of our knowledge, this is the first report on the transition state analysis of the reaction catalyzed by uridine phosphorylase from any organism.
Supplementary Material
Acknowledgments
This work was supported by NIH grant GM41916. The authors thank Yong Zhang and Keith Hazleton for their kind gifts of [3-15N]orotate and UMP synthase, respectively, and Dr. Andrew S. Murkin and Dr. Luiz Pedro S. de Carvalho, respectively, for insightful discussion about reverse commitment and for critical reading of this manuscript.
Footnotes
Abbreviations: UP, uridine phosphorylase; Keq, equilibrium constant; R-1-P, ribose-1-phosphate; NP-I, nucleoside phosphorylase-I; PNP, purine nucleoside phosphorylase; MTAP, methylthioadenosine phosphorylase; DFT, density functional theory; KIE, kinetic isotope effect; TcUP, T. cruzi UP; EIE, equilibrium isotope effect; Cf, forward commitment; Cr, reverse commitment; ZPE, zero-point energy; PK, pyruvate kinase; MK, myokinase; HK, hexokinase; G6PDH, glucose-6-phosphate dehydrogenase; GDH, glutamic acid dehydrogenase; 6PGDH, 6-phosphogluconic acid dehydrogenase; PRI, phosphoriboisomerase; AP, alkaline phosphatase; RK, ribokinase; PRPPase, phosphoribosyl-α-1-pyrophosphate synthetase; UMPS, uridine monophosphate synthase; MALDI-TOF, matrix-assisted laser desorption/ionization time of flight mass spectrometry; PEP, phosphoenolpyruvate; α-KG, α-ketoglutarate; ESI-MS, electrospray ionization mass spectrometry; cpm, counts per minute; H-bond, hydrogen bond; TP, thymidine phosphorylase; UDG, uracil DNA glycosylase; ni-j, bond order; NBO, natural bond orbital.
Supporting Information Available: Synthetic scheme for labeled UMPs (Scheme S1), and geometries and calculated KIEs for transition structures. This material is available free of charge via the Internet at http://www.pubs.acs.org.
References
- 1.Gao G, Nara T, Nakajima-Shimada J, Aoki T. J Mol Biol. 1999;285:149–161. doi: 10.1006/jmbi.1998.2293. [DOI] [PubMed] [Google Scholar]
- 3.Miller RL, Sabourin CL, Krenitsky TA, Berens RL, Marr JJ. J Biol Chem. 1984;259:5073–5077. [PubMed] [Google Scholar]
- 4.Larson ET, Mudeppa DG, Gillespie JR, Mueller N, Napuli AJ, Arif JA, Ross J, Arakaki TL, Lauricella A, Detitta G, Luft J, Zucker F, Verlinde CL, Fan E, Van Voorhis WC, Buckner FS, Rathod PK, Hol WG, Merritt EA. J Mol Biol. 2010;396:1244–1259. doi: 10.1016/j.jmb.2010.01.013. [DOI] [PMC free article] [PubMed] [Google Scholar]
- 5.Paege LM, Schlenk F. Arch Biochem Biophys. 1952;40:42–49. doi: 10.1016/0003-9861(52)90071-4. [DOI] [PubMed] [Google Scholar]
- 6.Pizzorno G, Cao D, Leffert JJ, Russell RL, Zhang D, Handschumacher RE. Biochim Biophys Acta. 2002;1587:133–144. doi: 10.1016/s0925-4439(02)00076-5. [DOI] [PubMed] [Google Scholar]
- 7.Vita A, Huang CY, Magni G. Arch Biochem Biophys. 1983;226:687–692. doi: 10.1016/0003-9861(83)90339-9. [DOI] [PubMed] [Google Scholar]
- 8.Pugmire MJ, Ealick SE. Biochem J. 2002;361:1–25. doi: 10.1042/0264-6021:3610001. [DOI] [PMC free article] [PubMed] [Google Scholar]
- 9.Westheimer FH. Chem Rev. 1961;61:265–273. [Google Scholar]
- 10.Sims LB, Fry A, Netherton LT, Wilson JC, Reppond KD, Crook SW. J Am Chem Soc. 1972;94:1364–1365. [Google Scholar]
- 11.McCann JA, Berti PJ. J Am Chem Soc. 2007;129:7055–7064. doi: 10.1021/ja067371l. [DOI] [PubMed] [Google Scholar]
- 12.Kline PC, Schramm VL. Biochemistry. 1993;32:13212–13219. doi: 10.1021/bi00211a033. [DOI] [PubMed] [Google Scholar]
- 13.Singh V, Schramm VL. J Am Chem Soc. 2006;128:14691–14696. doi: 10.1021/ja065419p. [DOI] [PMC free article] [PubMed] [Google Scholar]
- 14.Berti PJ, Schramm VL. J Am Chem Soc. 1997;119:12069–12078. doi: 10.1021/ja971317a. [DOI] [PMC free article] [PubMed] [Google Scholar]
- 15.Zhang Y, Luo M, Schramm VL. J Am Chem Soc. 2009;131:4685–4694. doi: 10.1021/ja808346y. [DOI] [PMC free article] [PubMed] [Google Scholar]
- 16.Schwartz PA, Vetticatt MJ, Schramm VL. Biochemistry. 2011;50:1412–1420. doi: 10.1021/bi101900b. [DOI] [PMC free article] [PubMed] [Google Scholar]
- 17.Cen Y, Sauve AA. J Am Chem Soc. 2010;132:12286–12298. doi: 10.1021/ja910342d. [DOI] [PMC free article] [PubMed] [Google Scholar]
- 18.Miles RW, Tyler PC, Furneaux RH, Bagdassarian CK, Schramm VL. Biochemistry. 1998;37:8615–8621. doi: 10.1021/bi980658d. [DOI] [PubMed] [Google Scholar]
- 19.Singh V, Shi W, Evans GB, Tyler PC, Furneaux RH, Almo SC, Schramm VL. Biochemistry. 2004;43:9–18. doi: 10.1021/bi0358420. [DOI] [PubMed] [Google Scholar]
- 20.Singh V, Lee JE, Nunez S, Howell PL, Schramm VL. Biochemistry. 2005;44:11647–11659. doi: 10.1021/bi050863a. [DOI] [PubMed] [Google Scholar]
- 21.Parkin DW, Leung HB, Schramm VL. J Biol Chem. 1984;259:9411–9417. [PubMed] [Google Scholar]
- 22.Laemmli UK. Nature. 1970;227:680–685. doi: 10.1038/227680a0. [DOI] [PubMed] [Google Scholar]
- 23.Miller RL, Lindstead D. Mol Biochem Parasitol. 1983;7:41–51. doi: 10.1016/0166-6851(83)90115-9. [DOI] [PubMed] [Google Scholar]
- 24.Rose IA. Methods Enzymol. 1980;64:47–59. doi: 10.1016/s0076-6879(80)64004-x. [DOI] [PubMed] [Google Scholar]
- 25.Frisch MJ, et al. Gaussian, Inc; Wallingford CT: 2009. [Google Scholar]
- 26.Hirschi JS, Takeya T, Hang C, Singleton DA. J Am Chem Soc. 2009;131:2397–2403. doi: 10.1021/ja8088636. [DOI] [PMC free article] [PubMed] [Google Scholar]
- 27.Anisimov V, Paneth P. J Math Chem. 1999;26:75–86. [Google Scholar]
- 28.Bell RP. The tunnel effect in chemistry. Chapman and Hall; London: 1980. [Google Scholar]
- 29.Kline PC, Schramm VL. Biochemistry. 1992;31:5964–5973. doi: 10.1021/bi00141a003. [DOI] [PubMed] [Google Scholar]
- 30.Schwartz PA, Vetticatt MJ, Schramm VL. J Am Chem Soc. 2010;132:13425–13433. doi: 10.1021/ja105041j. [DOI] [PMC free article] [PubMed] [Google Scholar]
- 31.Prior JJ, Santi DV. J Biol Chem. 1984;259:2429–2434. [PubMed] [Google Scholar]
- 32.Renck D, Ducati RG, Palma MS, Santos DS, Basso LA. Arch Biochem Biophys. 2010;497:35–42. doi: 10.1016/j.abb.2010.03.004. [DOI] [PubMed] [Google Scholar]
- 33.Northrop DB. Annu Rev Biochem. 1981;50:103–131. doi: 10.1146/annurev.bi.50.070181.000535. [DOI] [PubMed] [Google Scholar]
- 34.Cleland WW. Methods Enzymol. 1982;87:625–641. doi: 10.1016/s0076-6879(82)87033-x. [DOI] [PubMed] [Google Scholar]
- 35.Schramm VL. Methods Enzymol. 1999;308:301–355. doi: 10.1016/s0076-6879(99)08015-5. [DOI] [PubMed] [Google Scholar]
- 36.Murkin AS, Birck MR, Rinaldo-Matthis A, Shi W, Taylor EA, Almo SC, Schramm VL. Biochemistry. 2007;46:5038–5049. doi: 10.1021/bi700147b. [DOI] [PMC free article] [PubMed] [Google Scholar]
- 37.Luo M, Li L, Schramm VL. Biochemistry. 2008;47:2565–2576. doi: 10.1021/bi702133x. [DOI] [PubMed] [Google Scholar]
- 38.Li L, Luo M, Ghanem M, Taylor EA, Schramm VL. Biochemistry. 2008;47:2577–2583. doi: 10.1021/bi7021365. [DOI] [PubMed] [Google Scholar]
- 39.Cleland WW. Arch Biochem Biophys. 2005;433:2–12. doi: 10.1016/j.abb.2004.08.027. [DOI] [PubMed] [Google Scholar]
- 40.Northrop DB. Biochemistry. 1975;14:2644–2651. doi: 10.1021/bi00683a013. [DOI] [PubMed] [Google Scholar]
- 41.For this reaction, the computationally predicted 15Keq = 1.007. Rearranging eq 7 to solve for 15k, one obtains 15k = 15(V/K) × [1 + Cf] − Cf + [15(V/K) − 15Keq] × Cr, where the terms containing the corrections for Cf and Cr are explicitly separated. Substituting in the values found in this work, 15k = 1.024 × [1 + 0.283] − 0.283 + [1.024 − 1.007] × Cr, which is then further reduced to 15k = 1.030 + 0.017 × Cr. Because the maximum calculated 1-15N KIE on the arsenolysis of uridine equals 15k, within experimental error, following correction for Cf, and Cr cannot assume negative values, it is clear that the only possible value for Cr is zero
- 42.Guthrie RD, Jencks WP. Acc Chem Res. 1989;22:343–349. [Google Scholar]
- 43.Berti PJ, McCann JA. Chem Rev. 2006;106:506–555. doi: 10.1021/cr040461t. [DOI] [PubMed] [Google Scholar]
- 44.Berti PJ, Blanke SR, Schramm VL. J Am Chem Soc. 1997;119:12079–12088. doi: 10.1021/ja971317a. [DOI] [PMC free article] [PubMed] [Google Scholar]
- 45.Hehre WJ. Acc Chem Res. 1975;8:369–376. [Google Scholar]
- 46.Cook PF, Cleland WW. Biochemistry. 1981;20:1790–1796. doi: 10.1021/bi00510a013. [DOI] [PubMed] [Google Scholar]
- 47.Lewandowicz A, Schramm VL. Biochemistry. 2004;43:1458–1468. doi: 10.1021/bi0359123. [DOI] [PubMed] [Google Scholar]
- 48.Silva RG, Hirschi JS, Ghanem M, Murkin AS, Schramm VL. Biochemistry. 2011;50:2701–2709. doi: 10.1021/bi200279s. [DOI] [PMC free article] [PubMed] [Google Scholar]
- 49.Werner RM, Stivers JT. Biochemistry. 2000;39:14054–14064. doi: 10.1021/bi0018178. [DOI] [PubMed] [Google Scholar]
- 50.Komissarov AA, Moltchan OK, Romanova DV, Debabov VG. FEBS Lett. 1994;355:192–194. doi: 10.1016/0014-5793(94)01204-0. [DOI] [PubMed] [Google Scholar]
- 51.Fedorov A, Shi W, Kicska G, Fedorov E, Tyler PC, Furneaux RH, Hanson JC, Gainsford GJ, Larese JZ, Schramm VL, Almo SC. Biochemistry. 2001;40:853–860. doi: 10.1021/bi002499f. [DOI] [PubMed] [Google Scholar]
- 52.Pauling L. J Am Chem Soc. 1947;69:542–553. [Google Scholar]
- 53.Houk KN, Gustafson SM, Black KA. J Am Chem Soc. 1992;114:8565–8572. [Google Scholar]
- 54.Schramm VL. Annu Rev Biochem. 1998;67:693–720. doi: 10.1146/annurev.biochem.67.1.693. [DOI] [PubMed] [Google Scholar]
- 55.Zhang Y, Schramm VL. J Am Chem Soc. 2010;132:8787–8794. doi: 10.1021/ja102849w. [DOI] [PMC free article] [PubMed] [Google Scholar]
- 56.Berti PJ, Tanaka KSE. Adv Phys Org Chem. 2002;37:239–314. [Google Scholar]
- 57.Chen XY, Berti PJ, Schramm VL. J Am Chem Soc. 2000;122:6527–6534. [Google Scholar]
- 58.Gawlita E, Szylhabel-Godala A, Paneth P. Journal of Physical Organic Chemistry. 1996;9:41–49. [Google Scholar]
Associated Data
This section collects any data citations, data availability statements, or supplementary materials included in this article.