

Abstract
Objective. To evaluate the prevalence of metabolic syndrome (MetS) according to the International Diabetes Federation (IDF) and Adult Treatment Panel (ATP) III criteria among working East African adults. Design. This cross-sectional study of 1,935 individuals (1,171 men and 764 women) was conducted among working adults in Addis Ababa, Ethiopia. The study was conducted in accordance with the STEPwise approach of the World Health Organization. Results. According to ATP III and IDF definitions, the overall prevalence of MetS was 12.5% and 17.9%, respectively. Using ATP III criteria, the prevalence of MetS was 10.0% in men and 16.2% in women. Application of the IDF criteria resulted in a MetS prevalence of 14.0% in men and 24.0% in women. The most common MetS components among women were reduced high-density lipoprotein-cholesterol (HDL-C) (23.2%) and abdominal obesity (19.6%); whilst reduced HDL-C concentrations (23.4%) and high blood pressure (21.8%) were most common among men. Conclusion. MetS and its individual components are prevalent among an apparently healthy working population in Ethiopia. These findings indicate the need for evidence-based health promotion and disease prevention programs; and more robust efforts directed towards the screening, diagnosis and management of MetS and its components among Ethiopian adults.
1. Introduction
The global prevalence of chronic noncommunicable diseases (NCDs) is on the rise, with the majority of the growth occurring among populations in developing countries [1]. In sub-Saharan Africa, NCDs are projected to surpass infectious diseases by 2030 [2, 3]. Metabolic syndrome (MetS) is a constellation of risk factors of cardiovascular disease (CVD) such as diabetes and impaired glucose regulation, central obesity, hypertension, and dyslipidemia [4]. Consumption of calorie-dense foods, sedentary lifestyle, tobacco consumption, and use of antiretroviral medications are risk factors for MetS [5–10]. Limited available evidence suggests an increasing prevalence of MetS among populations in sub-Saharan African countries over the past decade [11].
Information concerning the prevalence and risk factors of MetS among sub-Saharan Africa is sparse, as most studies have been conducted in North America, Europe, and Asia [12–17]. To the best of our knowledge, no study has systematically evaluated the prevalence of MetS among Ethiopians.
Currently, there are four widely used definitions for MetS, and there appears to be no consensus about the application of any one diagnostic criteria [18]. We evaluated the prevalence of MetS using the National Cholesterol Education Program Adult Treatment Panel III (ATP III) [19] and the International Diabetes Federation (IDF) [20], two of the most widely used definitions of MetS. Both definitions consider blood glucose impairment (hyperglycemia), excess abdominal/body fat (increased waist and/or obesity), dyslipidemia (low HDL-cholesterol and/or high triglycerides), and elevated blood pressure to be core criteria of MetS [11]. While similar, the definitions have different criteria and cut-off values and may yield differing outcomes [21].
2. Materials and Methods
2.1. Design and Participants
This study was conducted in Addis Ababa, the capital city of Ethiopia during the months of December 2009 and January 2010. Study subjects were current permanent employees of the Commercial Bank of Ethiopia (CBE) and teachers in government schools of Addis Ababa. Workplaces were selected based on their relatively high stability of workforce and willingness to participate in the study. A multistage, probabilistic stratified sampling strategy was used to identify and recruit participants. Probability proportional to size (PPS) sampling procedures were used to select CBE branch offices and schools. All employees of the selected workplaces were invited to participate in the study. Excluding subjects with missing anthropometric information (n = 22), pregnant women (n = 21), and individuals without laboratory measures (n = 227), the final sample size included 1,935 (1,171 men and 764 women) participants.
This study was conducted in accordance with the STEPwise approach of the World Health Organization (WHO) for NCD surveillance in developing countries [22]. The approach has three levels: (1) questionnaire to gather demographic and behavioral information, (2) simple physical measurements, and (3) biochemical tests.
2.2. Data Collection and Variable Specification
Participants were interviewed by trained interviewers using the WHO STEPS-structured questionnaire. In accordance with the STEPS manual, questions related to alcohol and substance use were tailored to reflect the local context of Ethiopia [22]. A few additional questions were added to supplement the questionnaire and to reflect the local context of Ethiopia. The questionnaire was first written in English, translated into Amharic by experts, and translated back into English by a panel of professionals who speak both languages. The questionnaire was pretested before the initiation of the study and contained information regarding sociodemographic characteristics, tobacco and alcohol use, nutritional status, and physical activity. A five-day training of the contents of the STEPS questionnaire, data collection techniques, and ethical conduct of human research was provided to research interviewers prior to the commencement on the study.
Physical/anthropometric examinations and blood sample collections were carried out by trained research nurses. Blood pressure (BP) was measured using a digital measuring device (Microlife BP A50, Microlife AG, Switzerland) with participants sitting after resting for at least five minutes. Three BP measurements were taken with at least three-minute intervals between consecutive measurements. The mean systolic and diastolic BP from the second and third measurements were analyzed [22]. The weights of the participants were measured using a solar-powered scale (Model 871, Seca, Germany). Height and weight were measured with participants wearing light clothing. Waist circumference was taken at the midpoint between the lower margin of the last palpable rib and the top of the iliac crest (hip bone) [22]. Hip circumference was taken around the maximum circumference of the buttocks [22].
Blood samples were collected after a 12-hour overnight fasting. Samples of 12 mL of blood were obtained from each participant employing standard infection prevention procedures. The collected aliquots of blood serum were used to determine participants' fasting glucose concentrations and lipid profiles. Serum triglycerides (TGs), total cholesterol (TC), high-density lipoprotein cholesterol (HDL-C), low-density lipoprotein cholesterol (LDL-C), and fasting serum glucose (FG) were measured at the International Clinical Laboratory (ICL) in Addis Ababa, Ethiopia. ICL is one of the best equipped laboratories in Ethiopia with internationally accredited standard operating procedures. TG concentrations were determined by standardised enzymatic procedures using glycerol phosphate oxidase assay. HDL-C was measured using Ultra-HDL assay which is a homogeneous method for directly measuring HDL-C concentrations in serum plasma without the need for off-line pretreatment or centrifugation steps. Participants' FG was determined using standardized glucose oxidase method. All laboratory assays were completed without knowledge of participants' medical history. Lipid, lipoprotein, and FG concentrations were reported as mg/dL.
Prevalence of MetS was defined according to the IDF and ATP III criteria outlined below.
IDF Definition —
In accordance with the IDF criteria, subjects were classified as having MetS if participants had abdominal obesity (defined as waist circumference of ≥94 cm for men and ≥80 cm women) plus two of any of the following risk factors: (1) raised TG level (≥150 mg/dL) or specific treatment for this lipid abnormality; (2) reduced HDL-C (<40 mg/dL in males and <50 mg/dL in females) or specific treatment for this lipid abnormality; (3) raised blood pressure (systolic BP ≥130 or diastolic BP ≥85 mmHg) or treatment of previously diagnosed hypertension; (4) raised FG (≥100 mg/dL) or previously diagnosed with type 2 diabetes.
ATP III Definition —
In accordance with the ATP III criteria, subjects were classified as having MetS if participants had three or more of the following risk factors: (1) abdominal obesity (waist circumference >102 cm in males and >88 cm in females); (2) hypertriglyceridemia (TG ≥150 mg/dL); (3) reduced HDL-C (<40 mg/dL in males and <50 mg/dL in females); (4) high BP (≥130/85 mmHg); (5) FG (≥110 mg/dL).
All subjects provided informed consent, and all research protocols were approved by the Institutional Review Boards of Addis Continental Institute of Public Health, Addis Ababa, Ethiopia and the Human Subjects Division at the University of Washington, USA.
2.3. Statistical Analyses
Data were entered into EPI INFO (Version 3.5.1), a public access software made available from the U.S. Centers for Disease Control and Prevention (CDC). Entered data were exported to PASW Statistics (Version 18.0) for statistical analysis. We first explored frequency distributions of sociodemographical, clinical, and behavioural characteristics of subjects. Continuous variables were expressed as mean ± standard deviation. For skewed variables, median ± interquartile range was reported. Categorical variables were expressed as number (percentage, %). Chi-square tests were used to evaluate the differences in the distribution of categorical variables for study groups. Student's t-tests were used to evaluate differences in mean for study groups. The prevalence estimates for MetS according to the two definitions were determined separately. Using previously described methods, 95% confidence intervals for prevalence estimates were determined [23]. All reported P values are two tailed, and statistical significance was set at .05 levels.
3. Results
Demographic and lifestyle characteristics of the study population are provided in Table 1. The majority of participants had a college diploma, bachelor's degree, or higher (91.9% men and 77.7% women) and reported to be Orthodox Christians (79.0% men and 80.6% women). Approximately 20.0% of men and less than 1.0% of women reported that they were current or previous smokers; of 4.9% men and 1.5% of women reported almost daily or daily alcohol consumption during the past year. Khat chewing (a natural stimulant with amphetamine-like effects commonly used for social recreation in East African countries) [24] was reported by 13.7% of men and 0.7% of women. Approximately 36.0% of men and 42.0% of women reported having a fair or poor health status.
Table 1.
Sociodemographic characteristics of the study population.
| Characteristic | Men | Women | P value |
|---|---|---|---|
| N = 1,171 | N = 764 | ||
| % | % | ||
| Age (years) | |||
| ≤24 | 17.5 | 22.2 | <.001 |
| 25–34 | 38.0 | 31.5 | |
| 35–44 | 16.4 | 17.2 | |
| 45–54 | 17.5 | 22.3 | |
| ≥55 | 10.5 | 6.8 | |
| Education | |||
| ≤High school | 4.0 | 6.2 | <.001 |
| Technical school | 4.1 | 16.1 | |
| ≥ Bachelors | 91.9 | 77.7 | |
| Smoking status | |||
| Never smoker | 78.9 | 99.2 | <.001 |
| Pervious smoker | 14.0 | 0.7 | |
| Current smoker | 7.1 | 0.1 | |
| Religion | |||
| Orthodox | 79.0 | 80.6 | <.001 |
| Muslim | 5.2 | 2.60 | |
| Protestant | 14.7 | 16.4 | |
| Other | 1.1 | 0.4 | |
| Alcohol consumption in past year | |||
| Less than once a month | 65.5 | 95.4 | <.001 |
| 1–4 days a week | 29.7 | 3.3 | |
| 5-6 days a week | 2.8 | 0.7 | |
| Daily | 2.1 | 0.7 | |
| Khat chewing | |||
| No | 86.3 | 99.3 | <.001 |
| Yes | 13.7 | 0.7 | |
| Self-reported health status | |||
| Poor/Fair | 35.8 | 41.8 | <.001 |
| Excellent | 64.2 | 58.2 |
Table 2 shows the cardiometabolic and clinical characteristics of the study population. Approximately, a quarter of men (24.7%) and women (25.7%) were overweight (BMI 25.0–29.9 kg/m²). Women were more likely to be obese (10.2%) compared to men (2.1%). Approximately 46.0% of men and 31.0% of women were prehypersensitive (systolic BP 120–130 mmHg or diastolic BP 80–89 mmHg); 15.6% of men and 10.8% of women had stage 1 hypertension (systolic BP 140–159 mmHg or diastolic BP 90–99 mmHg). The mean systolic blood pressure and diastolic blood pressure were higher for men (124.3 mmHg) than for women (116.5 mmHg). Men also had a higher mean waist circumference compared with women. Fasting serum glucose concentrations were similar for both groups. However, mean serum HDL-C and LDL-C concentrations were higher among women as compared with men. Serum triglyceride concentrations were higher, on average, among men as compared with women.
Table 2.
Cardiometabolic characteristics of study population according to gender.
| Characteristic | Gender | P value | |
|---|---|---|---|
| Men | Women | ||
| N = 1,171% | N = 764% | ||
| Body mass index (kg/m2) | |||
| Underweight (<18.5) | 13.2 | 11.9 | <.001 |
| Normal (18.5–24.9) | 59.9 | 52.2 | |
| Overweight (25.0–29.9) | 24.7 | 25.7 | |
| Obese (≥30.0) | 2.1 | 10.2 | |
| Blood pressure* | |||
| Normotensive | 34.4 | 55.2 | <.001 |
| Prehypertension | 45.6 | 30.6 | |
| Stage 1 hypertension | 15.6 | 10.8 | |
| Stage 2 hypertension | 4.4 | 3.5 | |
| Mean (SD) | Mean (SD) | ||
| Waist circumference | 85.6 (11.3) | 80.6 (12.9) | <.001 |
| Diastolic blood pressure (mmHg) | 80.1 (14.6) | 76.3 (10.3) | <.001 |
| Systolic blood pressure (mmHg) | 124.3 (16.0) | 116.5 (17.0) | <.001 |
| Mean arterial pressure | 94.8 (13.4) | 89.7 (11.8) | <.001 |
| Fasting glucose (mg/dL) | 94.3 (28.7) | 93.5 (26.7) | .654 |
| HDL cholesterol (mg/dL) | 45.4 (8.4) | 50.3 (10.5) | <.001 |
| LDL cholesterol (mg/dL) | 115.3 (44.9) | 119.8 (34.7) | .908 |
| Median (IQ) | Median (IQ) | ||
| Triglycerides (mg/dL)† | 112.0 (81.0–171.0) | 95.0 (72.0–127.0) | .127 |
†Data are median (interquartile range) since distribution was skewed, and test of significance was based on log-transformed values.
*According to the Joint National Committee on Prevention, Detection, Evaluation, and Treatment of High Blood Pressure, hypertension is classified by the following standards: (1) normotensive (systolic BP < 120 mmHg and diastolic BP < 80 mmHg); (2) prehypertension (systolic BP 120–139 mmHg or diastolic BP 80–89 mmHg); stage 1 hypertension (systolic BP 140–159 mmHg or diastolic BP 90–99 mmHg); stage 2 hypertension (systolic BP ≥160 mmHg or diastolic BP ≥100 mmHg) [25].
Table 3 shows the prevalence of MetS as defined using the ATP III and IDF diagnostic criteria. Using the ATP III criteria, the prevalence of MetS was 12.5% overall (10.0% among men and 16.2% among women) in the study population. Application of the IDF criteria in this study population yielded a MetS prevalence of 17.9% overall (14.0% of men and 24.0% of women). The prevalence of MetS, irrespective of criteria used, increased markedly with age in both men and women. However, the prevalence was highest between ages 45–54 with 40.5% of men and 53.7% of women having MetS.
Table 3.
Prevalence of metabolic syndrome based on different sets of criteria by age group.
| Adult Treatment Panel (ATP) III | |||
|---|---|---|---|
| All | Men (N = 1171) % (95% CI) |
Women (N = 764) % (95% CI) |
|
| Overall | 12.5 (11.0–14.0) | 10.0 (8.3–11.7) | 16.2 (13.6–18.8) |
| Age (years) | |||
| ≤24 | 2.5 (0.9–4.1) | 1.7 (0.1–3.5) | 3.3 (0.6–6.0) |
| 25–34 | 7.9 (5.9–9.9) | 9.5 (6.8–12.2) | 6.5 (3.4–9.6) |
| 35–44 | 18.4 (14.2–22.6) | 21.6 (15.8–27.4) | 15.4 (9.2–21.6) |
| 45–54 | 47.3 (42.2–52.4) | 40.5 (33.8–47.2) | 53.7 (46.2–61.2) |
| ≥55 | 23.8 (17.5–30.1) | 26.7 (18.8–34.6) | 21.1 (9.9–32.3) |
| International Diabetes Federation (IDF) | |||
| Men (N = 1171) % (95% CI) |
Women (N = 764) % (95% CI) |
||
| Overall | 17.9 (16.2–19.6) | 14.0 (12.0–16.0) | 24.0 (21.0–27.0) |
| Age (years) | |||
| ≤24 | 2.6 (1.0–4.2) | 1.2 (10.3–20.1) | 3.9 (1.0–6.8) |
| 25–34 | 12.5 (10.0–15.0) | 14.7 (11.9–18.5) | 10.5 (6.6–14.4) |
| 35–44 | 20.9 (16.5–25.3) | 20.9 (10.1–20.3) | 21.0 (14.0–28.0) |
| 45–54 | 43.3 (38.3–48.3) | 38.0 (10.3–20.1) | 48.1 (40.6–55.6) |
| ≥55 | 20.6 (14.6–26.6) | 25.2 (8.8–21.6) | 16.6 (6.4–26.8) |
The age-adjusted prevalence estimates of each component of MetS according to the ATP III and IDF criteria are summarized in Figure 1. The most common MetS components among women using the ATP III criteria were reduced HDL-C (23.2%) and abdominal obesity (19.6%), whilst reduced HDL-C concentrations (23.4%) and high blood pressure (21.8%) were most common among men. Similar patterns were observed using the IDF criteria. Figure 2 shows the presence of 0, 1, 2, 3, 4, and 5 MetS components among men and women using the ATP III criteria and the presence of 0, 1, 2, 3, and 4 components in addition to central obesity as a requirement among men and women using the IDF definition. While some participants did not meet the MetS criteria of the ATP III and IDF, many had one or two components and may be at risk of developing the syndrome in the future. Using the ATP III criteria, 20.4% of women and 18.6% of men had two MetS components. The IDF criteria also showed a high number of individuals at risk with 46.5% of women and 34.7% of men having central obesity plus one additional component.
Figure 1.
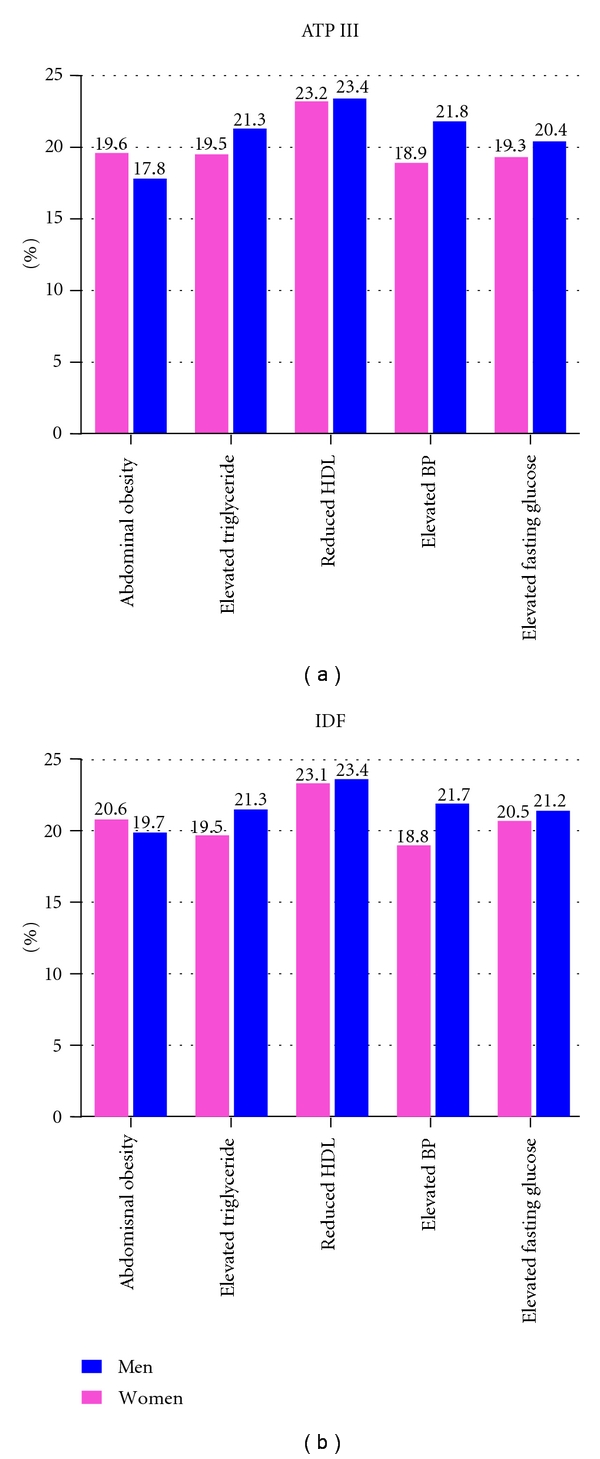
Age-adjusted prevalence of metabolic syndrome components by gender according to ATP III and IDF criteria.
Figure 2.
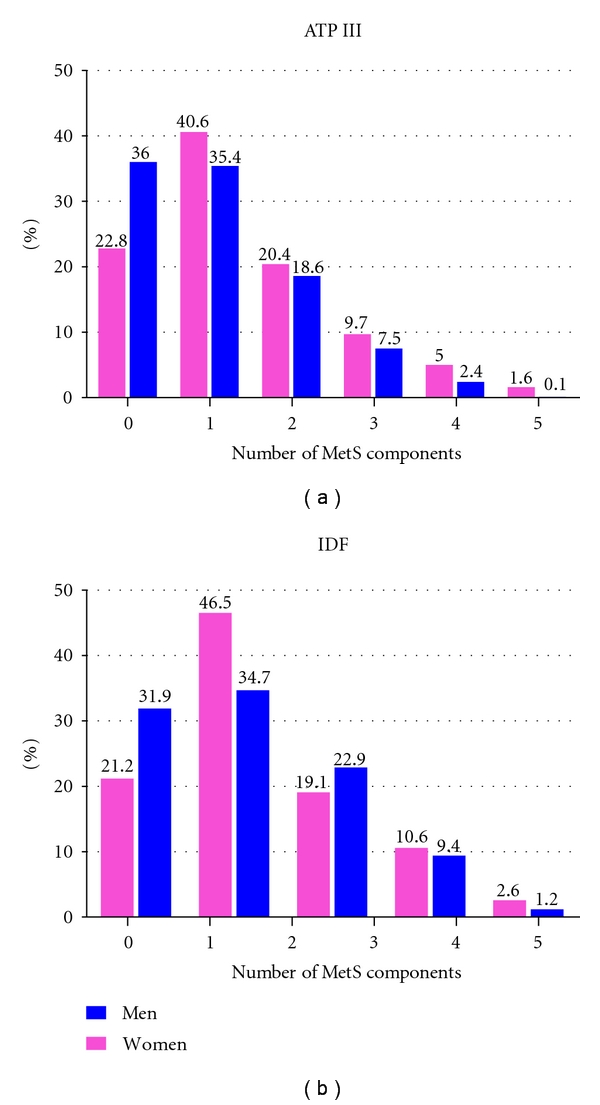
Number of metabolic syndrome components by gender according to ATP III and IDF criteria.
4. Discussion
Findings from this study confirm a high prevalence of MetS among working adults in Addis Ababa, Ethiopia. Using the ATP III criteria, the prevalence of MetS was found to be 12.5%, while the IDF criteria yielded an even higher prevalence of 17.9%. Our results suggest that women are at greater risk for MetS (ATP III 16.2% and IDF 24.0%) than men (ATP III 10.0% and IDF 14.0%). The prevalence of MetS increased markedly with age. MetS was most prevalent among participants in the 45–54 age group (43.3%–47.3%). Lastly, the number of participants with one or two MetS components suggests that certain individuals are potentially at risk of developing the syndrome.
Little information exists concerning the prevalence and epidemiological characteristics of MetS in sub-Saharan Africa. The first reported MetS study in the region was conducted in the mid-90s in Cameroon [12, 26] which found a 1.5% and 1.3% prevalence of MetS among urban dwelling women and men using IDF criteria [26]; however, the study did not measure HDL-C concentrations. A second study conducted in 2004 by Kelliny et al., in Seychelles, found a high prevalence of MetS where 25%–30% of their study population had the syndrome [11]. A recent study involving adults in semiurban and rural communities in Nigeria found a prevalence of MetS to be 18% [27]. A community-based study conducted in Tanzania in 2009 reported a 38% prevalence of MetS although the study sample size was small [28]. More recently, Adegoke et al. in their study among rural Nigerians reported a 12.1% prevalence of MetS [29]. Our prevalence estimates are higher than what was reported in Cameroon and rural Nigeria [26, 29] but lower than Seychelles and Tanzania [11, 28]. Our study findings were lower than other reports of MetS prevalence of developed countries over the last few years including the USA [15], Portugal [30], and Turkey [31]. However, the results of our study were greater than the prevalence of MetS in some developed countries such as Japan [14] and China [13]. While there is no unanimously accepted definition of MetS, findings from this study resulted in a high prevalence of MetS regardless of the definition (ATP III or IDF) used. Many recent studies have evaluated MetS prevalence using more than one definition including those established by ATP III, IDF, and WHO [11, 29].
Previous studies conducted in sub-Saharan Africa including in Benin and in south-western Nigeria have identified a high prevalence of cardiometabolic risk factors including abdominal obesity (32.0% and 14.7%, resp.) and hypertension (23.0% and 28.0%, resp.) [32, 33]. While there is an accumulating body of evidence on the prevalence of the individual components of MetS among Ethiopians [34–36], to the best of our knowledge, this is the first study to report the prevalence of the syndrome in the country. Tesfaye et al., in their cross-sectional study involving adults in Addis Ababa, Ethiopia, found a high prevalence of hypertension (31.5% among men and 28.9% among women) as a cause for concern [34]. The same study also found a high prevalence of overweight adults and indicated that women were more likely to be overweight than men in their study population [34]. Our findings of high prevalence of MetS and its components are in part due to the epidemiological and nutritional transition that has occurred globally including in sub-Saharan African countries where lifestyle and behavioral changes, both products of modernization and urbanization, have taken place [37–40]. As a result of this epidemiological transition where CVD risk in Africa is increasing [41], preventative measures as well as interventional programs are in demand.
Our study has several strengths including the number of participants which was adequate to make gender- and age-specific comparisons, the inclusion of schools and branch offices in wider geographical areas, the use of standard and calibrated instruments to make measurements, the requirement of reliability tests before data collection, and standardization during training. Limitations of our study include social desirability bias in which participants may withhold information regarding their life-style habits that may not be generally acceptable for working adults (smoking, chewing khat, etc.) [42] which may result in an underestimation of these behaviors. In addition, study findings may not be generalized to the broader Ethiopian population since study subjects consisted of current employed bankers of CBE and teachers in government schools who were fairly well-educated and urban workers.
In conclusion, the prevalence of MetS among our study population was high and ultimately adds to the limited amount of MetS data in sub-Saharan Africa. An increased risk for cardiovascular morbidity and mortality has also been linked to the prevalence of MetS [43]. The findings highlight the need for evidence-based prevention, diagnosis, and management of MetS and its associated factors among working adults in Ethiopia. Individuals with and at risk of MetS ought to focus on weight management and engage in appropriate physical activity levels. Support and promotion of healthy lifestyle behaviors by institutional leaders are also highly desirable. Moreover, future interventions by health policy makers and public health officials ought to focus on the individuals at risk for MetS who have one or two risk factors in order to control any potential burden of the syndrome.
Acknowledgments
This research was completed while Mr. A. Tran was a research training fellow with the Multidisciplinary International Research Training (MIRT) Program of the University of Washington, School of Public Health. The MIRT Program is supported by an award from the National Institutes of Health, National Center on Minority Health and Health Disparities (T37-MD001449). The authors wish to thank Addis Continental Institute of Public Health for providing facilities and logistics support throughout the research process. The authors would also like to thank the Commercial Bank of Ethiopia and Addis Ababa Education Office as well as branch offices and schools for granting access to conduct the study. The International Clinical Laboratories is also gratefully acknowledged for conducting the laboratory analyses.
References
- 1.Murray CJL, Lopez AD. Alternative projections of mortality and disability by cause 1990-2020: Global Burden of Disease Study. Lancet. 1997;349(9064):1498–1504. doi: 10.1016/S0140-6736(96)07492-2. [DOI] [PubMed] [Google Scholar]
- 2.Mathers CD, Loncar D. Projections of global mortality and burden of disease from 2002 to 2030. PLoS Medicine. 2006;3(11, article e442) doi: 10.1371/journal.pmed.0030442. [DOI] [PMC free article] [PubMed] [Google Scholar]
- 3.Yach D, Hawkes C, Gould CL, Hofman KJ. The global burden of chronic diseases: overcoming impediments to prevention and control. Journal of the American Medical Association. 2004;291(21):2616–2622. doi: 10.1001/jama.291.21.2616. [DOI] [PubMed] [Google Scholar]
- 4.Lu B, Yang Y, Song X, et al. An evaluation of the International Diabetes Federation definition of metabolic syndrome in Chinese patients older than 30 years and diagnosed with type 2 diabetes mellitus. Metabolism. 2006;55(8):1088–1096. doi: 10.1016/j.metabol.2006.04.003. [DOI] [PubMed] [Google Scholar]
- 5.Young F, Critchley JA, Johnstone LK, Unwin NC. A review of co-morbidity between infectious and chronic disease in Sub Saharan Africa: TB and diabetes mellitus, HIV and metabolic syndrome, and the impact of globalization. Global Health. 2009;5, article 9 doi: 10.1186/1744-8603-5-9. [DOI] [PMC free article] [PubMed] [Google Scholar]
- 6.Hanefeld M, Ceriello A, Schwarz PEH, Bornstein SR. The metabolic syndrome—a postprandial disease? Hormone and Metabolic Research. 2006;38(7):435–436. doi: 10.1055/s-2006-948133. [DOI] [PubMed] [Google Scholar]
- 7.Kamari Y, Grossman E, Oron-Herman M, et al. Metabolic stress with a high carbohydrate diet increases adiponectin levels. Hormone and Metabolic Research. 2007;39(5):384–388. doi: 10.1055/s-2007-976534. [DOI] [PubMed] [Google Scholar]
- 8.Schwarz PEH. Congress report from the American Diabetes Association: 66th Annual Scientific Sessions in Washington, USA. Experimental and Clinical Endocrinology and Diabetes. 2006;114(10):605–610. doi: 10.1055/s-2006-950180. [DOI] [PubMed] [Google Scholar]
- 9.Mutimura E, Crowther NJ, Stewart A, Cade WT. The human immunodeficiency virus and the cardiometabolic syndrome in the developing world: an African perspective. Journal of the cardiometabolic syndrome. 2008;3(2):106–110. doi: 10.1111/j.1559-4572.2008.07584.x. [DOI] [PMC free article] [PubMed] [Google Scholar]
- 10.World Health Organization. World Health Report. Prevention Chronic Disease: A vital Investment. 2008, http://www.who.int/chp/chronic_disease_report/contents/part1.pdf.
- 11.Kelliny C, William J, Riesen W, Paccaud F, Bovet P. Metabolic syndrome according to different definitions in a rapidly developing country of the African region. Cardiovascular Diabetology. 2008;7, article no. 27 doi: 10.1186/1475-2840-7-27. [DOI] [PMC free article] [PubMed] [Google Scholar]
- 12.Motala AA, Mbanya JC, Ramaiya KL. Metabolic syndrome in sub-Saharan Africa. Ethnicity & disease. 2009;19(2):S2–S8. [PubMed] [Google Scholar]
- 13.Feng Y, Hong X, Li Z, et al. Prevalence of metabolic syndrome and its relation to body composition in a Chinese rural population. Obesity. 2006;14(11):2089–2098. doi: 10.1038/oby.2006.244. [DOI] [PubMed] [Google Scholar]
- 14.Lee CMY, Huxley RR, Woodward M, et al. Comparisons of metabolic syndrome definitions in four populations of the Asia-Pacific region. Metabolic Syndrome and Related Disorders. 2008;6(1):37–46. doi: 10.1089/met.2007.0024. [DOI] [PubMed] [Google Scholar]
- 15.Ford ES. Prevalence of the metabolic syndrome defined by the international diabetes federation among adults in the U.S. Diabetes Care. 2005;28(11):2745–2749. doi: 10.2337/diacare.28.11.2745. [DOI] [PubMed] [Google Scholar]
- 16.Shiwaku K, Nogi A, Kitajima K, et al. Prevalence of the metabolic syndrome using the modified ATP III definitions for workers in Japan, Korea and Mongolia. Journal of Occupational Health. 2005;47(2):126–135. doi: 10.1539/joh.47.126. [DOI] [PubMed] [Google Scholar]
- 17.Ford ES, Giles WH, Dietz WH. Prevalence of the metabolic syndrome among US adults: findings from the Third National Health and Nutrition Examination Survey. Journal of the American Medical Association. 2002;287(3):356–359. doi: 10.1001/jama.287.3.356. [DOI] [PubMed] [Google Scholar]
- 18.Alberti KGMM, Zimmet PZ. Definition, diagnosis and classification of diabetes mellitus and its complications. Part 1: diagnosis and classification of diabetes mellitus. Provisional report of a WHO consultation. Diabetic Medicine. 1998;15(7):539–553. doi: 10.1002/(SICI)1096-9136(199807)15:7<539::AID-DIA668>3.0.CO;2-S. [DOI] [PubMed] [Google Scholar]
- 19.Grundy SM, Cleeman JI, Daniels SR, et al. Diagnosis and management of the metabolic syndrome: an American Heart Association/National Heart, Lung, and Blood Institute scientific statement. Circulation. 2005;112(17):2735–2752. doi: 10.1161/CIRCULATIONAHA.105.169404. [DOI] [PubMed] [Google Scholar]
- 20.Alberti KGMM, Zimmet P, Shaw J. The metabolic syndrome—a new worldwide definition. Lancet. 2005;366(9491):1059–1062. doi: 10.1016/S0140-6736(05)67402-8. [DOI] [PubMed] [Google Scholar]
- 21.Schutte AE, Schutte R, Huisman HW, et al. Classifying Africans with the metabolic syndrome. Hormone and Metabolic Research. 2009;41(2):79–85. doi: 10.1055/s-0028-1104603. [DOI] [PubMed] [Google Scholar]
- 22.World Health Organization. Chronic diseases and health promotion: Stepwise approach to surveillance (STEPS) 2010, http://www.who.int/chp/steps/manual/en/index.html.
- 23.Colton T. Statistics in Medicine. Boston, Mass, USA: Little Brown; 1974. [Google Scholar]
- 24.Getahun W, Gedif T, Tesfaye F. Regular Khat (Catha edulis) chewing is associated with elevated diastolic blood pressure among adults in Butajira, Ethiopia: a comparative study. BMC Public Health. 2010:p. 390. doi: 10.1186/1471-2458-10-390. [DOI] [PMC free article] [PubMed] [Google Scholar]
- 25.Chobanian AV, Bakris GL, Black HR, et al. Seventh report of the Joint National Committee on Prevention, Detection, Evaluation, and Treatment of High Blood Pressure. Hypertension. 2003;42(6):1206–1252. doi: 10.1161/01.HYP.0000107251.49515.c2. [DOI] [PubMed] [Google Scholar]
- 26.Fezeu L, Balkau B, Kengne AP, Sobngwi E, Mbanya JC. Metabolic syndrome in a sub-Saharan African setting: central obesity may be the key determinant. Atherosclerosis. 2007;193(1):70–76. doi: 10.1016/j.atherosclerosis.2006.08.037. [DOI] [PMC free article] [PubMed] [Google Scholar]
- 27.Ulasi II, Ijoma CK, Onodugo OD. A community-based study of hypertension and cardio-metabolic syndrome in semi-urban and rural communities in Nigeria. BMC Health Services Research. 2010;10, article no. 71 doi: 10.1186/1472-6963-10-71. [DOI] [PMC free article] [PubMed] [Google Scholar]
- 28.Njelekela MA, Mpembeni R, Muhihi A, et al. Gender-related differences in the prevalence of cardiovascular disease risk factors and their correlates in urban Tanzania. BMC Cardiovascular Disorders. 2009;9, article 30 doi: 10.1186/1471-2261-9-30. [DOI] [PMC free article] [PubMed] [Google Scholar]
- 29.Adegoke OA, Adedoyin RA, Balogun MO, Adebayo RA, Bisiriyu LA, Salawu AA. Prevalence of metabolic syndrome in a rural community in Nigeria. Metabolic Syndrome and Related Disorders. 2010;8(1):59–62. doi: 10.1089/met.2009.0037. [DOI] [PubMed] [Google Scholar]
- 30.Santos AC, Barros H. Impact of metabolic syndrome definitions on prevalence estimates: a study in a Portuguese community. Diabetes and Vascular Disease Research. 2007;4(4):320–327. doi: 10.3132/dvdr.2007.059. [DOI] [PubMed] [Google Scholar]
- 31.Can AS, Bersot TP. Analysis of agreement among definitions of metabolic syndrome in nondiabetic Turkish adults: a methodological study. BMC Public Health. 2007;7, article no. 353 doi: 10.1186/1471-2458-7-353. [DOI] [PMC free article] [PubMed] [Google Scholar]
- 32.Sodjinou R, Agueh V, Fayomi B, Delisle H. Obesity and cardio-metabolic risk factors in urban adults of Benin: relationship with socio-economic status, urbanisation, and lifestyle patterns. BMC Public Health. 2008;8, article 84 doi: 10.1186/1471-2458-8-84. [DOI] [PMC free article] [PubMed] [Google Scholar]
- 33.Oladapo OO, Salako L, Sodiq O, Shoyinka K, Adedapo K, Falase AO. A prevalence of cardiometabolic risk factors among a rural Yoruba south-western Nigerian population: a population-based survey. Cardiovascular Journal of Africa. 2010;21(1):26–31. [PMC free article] [PubMed] [Google Scholar]
- 34.Tesfaye F, Byass P, Wall S. Populationbased prevalence of high blood pressure among adults in Addis Ababa: uncovering a silent epidemic. BMC Cardiovascular Disorders. 2009;9, article no. 39 doi: 10.1186/1471-2261-9-39. [DOI] [PMC free article] [PubMed] [Google Scholar]
- 35.Tesfaye F, Nawi NG, Van Minh H, et al. Association between body mass index and blood pressure across three populations in Africa and Asia. Journal of Human Hypertension. 2007;21(1):28–37. doi: 10.1038/sj.jhh.1002104. [DOI] [PubMed] [Google Scholar]
- 36.Tesfaye F, Byass P, Wall S, Berhane Y, Bonita R. Association of smoking and khat (Catha edulis Forsk) use with high blood pressure among adults in Addis Ababa, Ethiopia, 2006. Preventing Chronic Disease. 2008;5(3, article A89) [PMC free article] [PubMed] [Google Scholar]
- 37.Kadiri S, Salako BL. Cardiovascular risk factors in middle aged Nigerians. East African Medical Journal. 1997;74(5):303–306. [PubMed] [Google Scholar]
- 38.BeLue R, Okoror TA, Iwelunmor J, et al. An overview of cardiovascular risk factor burden in sub-Saharan African countries: a socio-cultural perspective. Global Health. 2009;5, article 10 doi: 10.1186/1744-8603-5-10. [DOI] [PMC free article] [PubMed] [Google Scholar]
- 39.Fezeu L, Minkoulou E, Balkau B, et al. Association between socioeconomic status and adiposity in urban Cameroon. International Journal of Epidemiology. 2006;35(1):105–111. doi: 10.1093/ije/dyi214. [DOI] [PubMed] [Google Scholar]
- 40.Reddy KS, Yusuf S. Emerging epidemic of cardiovascular disease in developing countries. Circulation. 1998;97(6):596–601. doi: 10.1161/01.cir.97.6.596. [DOI] [PubMed] [Google Scholar]
- 41.Onyegbutulem HC, H-Onyegbutulem PI, Reimann M, Li J, Bornstein SR, Schwarz PE. Metabolic syndrome in Africa: an emerging perspective. Hormone and Metabolic Research. 2009;41(2):75–78. doi: 10.1055/s-0028-1082038. [DOI] [PubMed] [Google Scholar]
- 42.Kebede D, Alem A, Mitike G, et al. Khat and alcohol use and risky sex behaviour among in-school and out-of-school youth in Ethiopia. BMC Public Health. 2005;5, article no. 109 doi: 10.1186/1471-2458-5-109. [DOI] [PMC free article] [PubMed] [Google Scholar]
- 43.Isomaa BO, Almgren P, Tuomi T, et al. Cardiovascular morbidity and mortality associated with the metabolic syndrome. Diabetes Care. 2001;24(4):683–689. doi: 10.2337/diacare.24.4.683. [DOI] [PubMed] [Google Scholar]