

Abstract
Differential expression of secretory leukocyte protease inhibitor (SLPI) impacts on tumor progression. SLPI directly inhibits elastase and other serine proteases, and regulates matrix metalloproteinases, plasminogen activation, and plasmin downstream targets to influence invasion. We examined tissues from human oral squamous cell carcinoma (OSCC) for SLPI expression in parallel with proteases associated with tumor progression and evaluated their relationships using tumor cell lines. Significantly decreased SLPI was detected in OSCC compared to normal oral epithelium. Furthermore, an inverse correlation between SLPI and histological parameters associated with tumor progression, including stage of invasion, pattern of invasion, invasive cell grade, and composite histological tumor score was evident. Conversely, elevated plasmin and elastase were positively correlated with histological parameters of tumor invasion. In addition to its known inhibition of elastase, we identify SLPI as a novel inhibitor of plasminogen activation through its interaction with annexin A2 with concomitant reduced plasmin generation by macrophages and OSCC cell lines. In an in vitro assay measuring invasive activity, SLPI blocked protease-dependent tumor cell migration. Our data suggest that SLPI may possess antitumorigenic activity by virtue of its ability to interfere with multiple requisite proteolytic steps underlying tumor cell invasion and may provide insight into potential stratification of oral cancer according to risk of occult metastasis, guiding treatment strategies.
Head and neck squamous cell carcinoma is among the top 10 most frequent cancers in the US.1 Unfavorable prognosis is mainly due to local invasion and frequent spread to lymph nodes (LN).2 Generally, the invasive property of tumor cells is dependent on activation of proteases, such as plasmin at the cell surface.3–5 Inactive plasminogen is converted to the active, broad-spectrum serine proteinase, plasmin, by plasminogen activators (PA), including urokinase-type PA (uPA) and tissue-type PA (tPA), and their overexpression is considered central in malignant tumor progression.6,7 Efficient plasmin generation involves plasminogen binding, together with PA, on cell surfaces by annexin A2, urokinase-type PA receptor, and other docking sites that colocalize enzyme and substrate.8–10 Loss of annexin A2 from surfaces of cancer cells results in significantly reduced plasmin.11 Plasmin, in turn, activates matrix-degrading metalloproteinases (MMPs) produced by tumor cells as well as by stromal cells.12 Invasive properties of tumor cells are aided and abetted by infiltrating inflammatory cells, particularly tumor-associated macrophages, responsible for release of growth factors and matrix destructive enzymes.13 Dysregulation of the protease–antiprotease balance underlies tumor cell invasion, warranting examination of potential deficiencies in antiproteases as contributors to metastatic events.
Recently, the antiprotease secretory leukocyte protease inhibitor (SLPI), a member of the whey acidic protein family, has been implicated in tumorigenesis.14,15 SLPI is a 11.7-kDa nonglycosylated epithelial-derived protein that neutralizes elastase, tryptase, and cathepsin G. Elastase, capable of splitting a variety of structural and functional proteins, also activates MMP, leading to amplified extracellular matrix cleavage.16,17 Moreover, SLPI directly inhibits macrophage MMP, possibly through inhibition of NFκB,18,19 and absence of SLPI is associated with enhanced elastase activity, delayed matrix accumulation, and aberrant healing.16,20–22 Due to its generation by epithelial cells and its unique repertoire of antiproteolytic, antimicrobial, and anti-inflammatory properties,20–26 SLPI expression has been examined in multiple tumor types. Nonetheless, its role in tumorigenesis remains controversial, since depending on cancer type, either up-regulation or down-regulation has been observed.14,15 Correlations between reduced SLPI and tumor spread have suggested antitumorigenic functions,27 and as a potentially protective molecule against liver metastasis28 and mammary tumor invasion. However, SLPI reportedly promotes invasion-independent metastasis,29 proliferation, and survival in ovarian cancer,30 providing a far from clear view of its role in tumor development and progression.
To define potential contributions of SLPI to head and neck squamous cell carcinomas (HNSCC), we examined tumors for expression of SLPI as well as downstream proteases in tumors that did or did not progress to regional lymph node metastasis. SLPI expression in oral squamous cell carcinoma (OSCC) was significantly lower than in normal oral epithelium and exhibited significant inverse correlations with invasion parameters. Further characterization of its potential mechanism of action revealed a novel inhibitory role for SLPI in plasminogen activation on the cell surface, where it binds to annexin A2 to intercede in tPA activation of plasminogen, and in an in vitro tumor model, SLPI inhibits invasive activity. Our results provide evidence for a potential protective role of SLPI in oral cancer, and as a tool for possible stratification of oral cancer according to risk of occult metastasis, possibly guiding treatment decisions and the need for elective neck dissection in a clinically negative neck.
Materials and Methods
Patients and Tumor Samples
Patients diagnosed with early stage, clinically negative (N0) neck (stage I: T1N0M0 or stage II: T2N0M0) OSCC of the tongue or floor of the mouth and treated at the University of Maryland between 1994 and 2000 were identified (Institutional Review Board, University of Maryland; exemption #NN-040301, #H27950).31 Only patients treated by primary tumor resection without neck dissection or irradiation were included. The occurrence of delayed neck metastasis (DNM) to regional LN was recorded, with DNM+ and DNM− signifying presence or absence of LN metastasis, respectively, within the 5-year assessment. DNM represents occult LN metastatic disease that is clinically and radiographically undetectable at the time of diagnosis and treatment, but later becomes apparent.31 Formalin-fixed, paraffin-embedded tissue samples from 24 patients were obtained from the pathology archive, and oral mucosal tissues from healthy subjects (n = 5) were evaluated as controls.
Histopathological Analysis
Representative surgical tumor sections were reviewed by two oral and maxillofacial pathologists (N.G.N., R.C.) blinded to LN status. Tumors were classified based on: i) degree of keratinization; ii) nuclear polymorphism; iii) number of mitoses; iv) invasive pattern; v) stage of invasion; and vi) lymphoplasmacytic infiltration, paying particular attention to the most dysplastic area of the invasive front.31,32 Each parameter was graded for individual tumor sections using a four-point rating scale, with grade 1 corresponding to a more differentiated presentation (eg, abundant keratinization), and grade 4 to the least differentiated presentation (eg, absence of keratinization). A composite grade (CG) was calculated as the sum of six individual grades. In addition, the invasive cell grade (ICG), another widely used multifactorial and semiquantitative grading system linked to occult metastasis,33 was calculated as the sum of five parameters, excluding stage of invasion. Tumor thickness/depth of invasion was measured microscopically in millimeters31 from the surface of the epithelium to deepest invading tumor island or cell, using a reconstructed line excluding exophytic tumor components and including thickness of epithelium lost due to ulceration.
IHC and Semiquantitative Analysis of Immunostaining
Tissue sections, treated for epitope retrieval and to block endogenous peroxidase, were blocked with corresponding pre-immune serum or FBS-Tween 20 and incubated overnight at 4°C with primary antibodies: anti-SLPI (R&D Systems, Minneapolis, MN) 1:100; anti-plasmin (Genway Biotech, San Diego, CA) 1:50; anti-elastase (DakoCytomation, Glostrup, Denmark) 1:50; anti-MMP9 (Chemicon, Temecula, CA); or isotype control. After PBS washes, immunolabeling was detected using a biotinylated secondary antibody followed by avidin-biotin horseradish peroxidase (Zymed, Grand Island, NY) and diaminobenzidine, and counterstain with hematoxylin. Immunostaining was assessed (N.G.N., R.C.) and classified according to percentage stained cells and intensity of stain. Immunohistochemical (IHC) staining was evaluated for tumor cells and/or for inflammatory infiltrates using a four-point score: a score of 0 = <1% positive cells, 1 = 1% to 25%, 2 = 26% to 50%, 3 = 51% to 75%, and 4 = 76% to 100%. In some cases, a six-point scale further refined the level of expression: 0 = <1% positive, with 1 (1% to 10%), 2 (11% to 30%), 3 (31% to 50%), 4 (51% to 70%), 5 (71% to 90%), and 6 (≥91%) representing increasing positivity. Intensity of staining was classified as weak (W), moderate (M), or strong (S).
Tumor Cell Culture and MMP Analysis
The HNSCC cell line Tu1386 (kind gift from Dr. P. Sacks, New York University)34 and HN12 cells, derived from metastatic SCC35 (a kind gift from Dr. J. Silvio Gutkind, National Institute of Dental and Craniofacial Research), were maintained in Dulbecco's Modified Eagle's Medium (DMEM) (Mediatech, Inc, Herndon, VA) containing 10% FBS in a humidified (37°C, 5% CO2) incubator. Normal human keratinocyte cell line (NHEK-Ad) (Clonetics, San Diego, CA) was cultured in keratinocyte basal medium-2 (Clonetics). For experimental assays, cells were trypsinized (Accutase; Innovative Cell Technologies, San Diego, CA) and harvested on reaching 80% to 90% confluence.
MMP2 activity was measured using Calbiochem InnoZyme Gelatinase Activity Assay Kit (Calbiochem/Merck, Darmstadt, Germany) containing a triple-helical, collagen-like, fluorogenic substrate. In brief, cell lines (2.0 × 10⁵) grown to confluency in 12-well plates were cultured in serum-free medium overnight and SLPI (0 to 10 μg/mL) added before supernatants were collected (6 to 24 hours) and concentrated (Microcon; Millipore Corporation, Bedford, MA). After adding 90 μL of concentrated sample and 10 μL of substrate working solution to 96-well plates, the plates were incubated at 37°C for 2 to 6 hours and read with a fluorescence plate reader. Cleavage of substrate results in increased fluorescence at 320-nm excitation and emission wavelength of 405 nm.
Isolation and Culture of Human Blood Monocytes
Human peripheral blood mononuclear cells were obtained by leukapheresis of healthy volunteers (Department of Transfusion Medicine, National Institutes of Health). Monocytes were purified by elutriation24 and cultured in DMEM supplemented with 2 mmol/L l-glutamine, 100 μl/mL penicillin, and 100 μg/mL streptomycin (Sigma, St. Louis, MO). For macrophages, monocytes were adhered and cultured in supplemented DMEM with 10% FBS for 7 to 10 days.24
Plasmin Generation Assays
Macrophages (1 × 10⁶ cells/mL, 100 μL/tube) in buffer (HEPES-buffered saline containing 3 mmol/L CaCl2 and 1 mmol/L MgCl2; Mediatech, Inc.) were incubated with 100 nmol/L N-terminal glutamic acid plasminogen (glu-plasminogen) (American Diagnostica, Greenwich, CT) for 1 hour at 4°C. Then rabbit polyclonal anti-annexin II (Santa Cruz Biotechnology, Santa Cruz, CA), rabbit IgG (60 μg/mL; Jackson ImmunoResearch Laboratories, West Grove, PA), or SLPI (1 to 25 μg/mL) was added for 45 minutes at 4°C. The cells were washed with buffer, and both tPA (12 nmol/L; Calbiochem) and fluorogenic plasmin substrate AFC-081(166 μmol/L, d-valine-leucine-lysine-7-amino-4-trifluoromethyl coumarin; Enzyme Systems Products, Aurora, OH) were added and substrate hydrolysis measured at 5-minute intervals (400-nm excitation and 505-nm emission).36
HN12, Tu1386, and NHEK cells in 12-well plates (2 × 10⁵ cells/mL) were incubated with SLPI (5 μg/mL) or ε-amino-caproic acid (ACA; Calbiochem) for 1 hour in phenol red–free and serum-free DMEM and 0.5 μmol/L purified glu-plasminogen added for 2 to 4 hours. Kinetics of constitutive cell-mediated plasminogen activation was determined by measuring amidolytic activity of plasmin after the reaction was initiated by addition of substrate H-d-norleucyl-hexahydrotyrosyl-lysine-p-nitroanilide (0.5 mmol/L) (Spectrozyme; American Diagnostica) to 200 μL of conditioned medium and monitored at 405 nm.
For direct assessment of SLPI on plasmin activity, plasmin was incubated with 50 μL of buffer (50 mmol/L Tris + 0.01% Tween 80), 50 μL of SLPI (10 μg/mL) or aprotinin [10 kallikrein inhibitor units (KIU)/mL; American Diagnostica], a plasmin inhibitor, for 15 minutes at 37°C and added to plasmin-specific amidolytic substrate (Spectrozyme PL) in a 96-well format. Increase in absorbance at 405 nm was directly proportional to the amount of plasmin generated.
Assay for Fibrinolytic Activity
Fibrin gels were prepared in 12-well plates (Corning Costar; Corning Life Sciences, Kennebunk, ME) as described.37 Briefly, bovine plasma fibrinogen (Sigma-Aldrich) was added to saline barbital buffer (0.05 mol/L sodium barbital, 0.093 mol/L NaCl, 1.66 mmol/L CaCl2, 0.69 mmol/L MgCl2, ionic strength 0.15, pH adjusted to 7.75) at a final concentration of 0.1% w/v and dispensed at 400 μL/well. The fibrinogen solution was clotted with 18 μL (20 NIH units/mL) bovine thrombin solution (Sigma) for 60 minutes. A 30-μL test sample in gelatin barbital buffer (containing 0.25% gelatin) was added to individual wells at 37°C for 17 hours37 in parallel with plasmin (0.0498 ng) and tPA (0.03 μg; Calbiochem). Aprotinin (1unit/mL) or PAI-1 (0.67 units/mL) was added to some wells at the onset of the experiment. For cell-dependent fibrinolysis, cells were pelleted, resuspended in gelatin barbital buffer, and 50 μL of cells/buffer were added to fibrin plates for 1 to 3 days. Wells were stained with Coomassie Blue, and replicate lysis diameters were quantified.
Small-Interfering RNA Inhibition of Annexin A2
Annexin A2 small-interfering (siRNA) was synthesized based on the sequence r(5′-CGGUGAUUUUGGGCCUAUUUU-3′)/r(5′-AAUAGGCCCAAAUCACCGUC-3′) and an unrelated control siRNA from Qiagen (Valencia, CA).23 siRNA was transfected into monocytes using Amaxa Human Dendritic Cell Nucleofector kit (Amaxa Biosystems, Köln, Germany) as described.23 The cells were incubated 6 days before analysis of annexin protein using Western blot and assay for fibrinolytic activity.
Transfection of Human Macrophages with SLPI
Adherent macrophages (6 × 10⁶/well in a six-well plate) were treated with adenovirus vector (1.46 × 10¹² viral particles/mL, 4 μL added to 1 mL of 10% FCS in DMEM), adenovirus-GFP, or adenovirus-SLPI (7.2 × 10¹¹ viral particles/mL, 8.3 μL in 1 mL). After 24 hours, medium was removed and replaced with 10% DMEM until days 3 to 7, when supernatants were tested for SLPI by ELISA (R&D Systems). Cells were detached, washed, and used in plasmin generation or fibrinolytic assays.
Immunofluorescence Microscopy
HN12 cells were cultured on coverslips in 24-well plates until 75% to 90% confluent, washed, and then fixed with 4% paraformaldehyde before incubation with 100 mmol/L glycine for 25 minutes. Cells were washed, permeabilized with ice-cold 100% methanol, and blocked with 2% donkey serum in PBS for 10 minutes before monoclonal anti-annexin A2, rabbit polyclonal anti-SLPI (Santa Cruz Biotechnology), and control antibodies were applied to cells at 4°C overnight. Fluorophore-labeled secondary antibodies (1 μL/200 μL of buffer; Invitrogen) were added for 1 hour at room temperature; cells were then washed and incubated with DAPI (Sigma-Aldrich) for 10 minutes. Slides were visualized microscopically (Zeiss Axioplan 2 Imaging; Carl Zeiss, Oberkochen, Germany) with filters for fluorescein isothiocyanate, tetramethyl rhodamine, and DAPI/HOECHST, and recorded with iVision-Mac Image Acquisition and Analysis software (BioVision Technologies, Exton, PA). Macrophages were rinsed with PBS, incubated in DMEM containing biotinylated rhSLPI,23 washed, and then stained 30 minutes at 4°C with neutravidin-FITC (Pierce Biotechnology, Rockford, IL).
Polymerase Chain Reaction Analysis
Frozen specimens from available HNSCC tumors (n = 10) and nonmalignant oral mucosa (n = 5) were homogenized using Miltenyi Biotech gentleMACS (Miltenyi Biotec, Auburn, CA) and RNA extracted (Trizol; Invitrogen). Total RNA (2 μg) was reverse transcribed using oligodeoxythymidylic acid primer and cDNA amplified by PCR using ABI7500 Sequence Detector (Applied Biosystems, Foster City, CA). Amplification was performed using Taqman expression assays for SLPI (Hs00268204_m1) and GAPDH (Hs99999905_m1).
HN12, Tu1386, and NHEK cells (2.0 × 10⁵) were cultured overnight in the presence or absence of SLPI, and the total RNA was extracted with RNeasy mini kit (Qiagen) in parallel with normal buccal mucosa RNA. First-strand cDNA synthesis and subsequent PCR were performed using Qiagen one-step conventional reverse transcription (cRT)-PCR kit. Primer sets for MMP9, 5′-CGCAGACATCGTCCAGT-3′ (sense), 5′-GGATTAGCCTTGGAAGATGA-3′ (antisense); MMP2, 5′-ACATCAAGGGCATTCAGGAG-3′ (sense), 5′-GCCTCGTATACCGCATCAAT-3′ (antisense); COX2, 5′-GCAGTTGTTCCAGAC AAGCA-3′ (sense), 5′-GAAAGGTGTCAGGCAGAAGG-3′ (antisense) and GAPDH, 5′-GTGAAGGTCGGGAGTCAACGGATTT-3′ (sense) and 5′-CACAGTCTTCTGGGTGGCAGTGAT-3′ (antisense). Samples were heated at 94°C for 10 minutes and amplified using cycles of 94°C for 30 seconds, 56°C for 30 seconds, 72°C for 30 seconds (GAPDH, 26 cycles; MMP-9, 32 cycles). PCR products were electrophoresed on 1% agarose gels and visualized by ethidium bromide. Quantitative real-time PCR (RT-PCR) was with cDNA as a template and primers for SLPI and GAPDH. For macrophages, total RNA was extracted, 2 μg was reverse transcribed by oligodeoxythymidylic acid primer (Promega, Madison, WI), and the resulting cDNA (1 μL) amplified by PCR. Primer set for annexin II was: 5′-ATGTCTACTGTTCACGAAATC-3′ (sense) and 5′-AATGAGAGAGTCCTCGTCGG-3′ (antisense).
Tumor Cell Invasion Assay
Cell invasion was analyzed with a QC-M 96-well cell invasion assay (Chemicon), and 5 × 10⁴ Tu1386 cells were seeded onto the rehydrated matrix in the presence or absence of SLPI (5 μg/mL). DMEM (150 μL) containing 10% FBS was added to the lower chambers as a chemoattractant. Cells were incubated for 48 hours at 37°C. Invaded cells on the bottom of the membranes were dissociated with 150 μL of cell detachment buffer and lysis buffer/dye solution (50 μL). A total of 200 μL was transferred to a 96-well plate, and fluorescence was detected by a 485-nm/535-nm filter set. For imaging of invasive cells, filters were fixed in methanol for 5 minutes at −20°C, incubated in DAPI (15000) for 10 minutes before placed on coverslips.
Statistical Analysis
Correlations between expression of studied proteins and histological parameters were tested using Spearman rank correlation coefficient or Pearson correlation. All statistical analyses were performed using SAS version 9.01 software (SAS Institute Inc., Cary, NC). Correlations between SLPI expression and tumor stage were obtained by Fisher's exact test. Exact P values were estimated by Monte Carlo Simulation or Monte Carlo using 100,000 samples, and a P value ≤0.05 was considered significant. The t-test was used for statistical analysis in in vitro studies, and a P value ≤0.05 was considered significant.
Results
Clinical and Histological Parameters
Patient clinical data were analyzed, with a mean patient age of 65 years (range, 45 to 86 years), 67% (16 cases) classified as tumor stage I (T1N0M0), and 33% as stage II (T2N0M0) at surgical diagnosis (Table 1).31 Among these patients, 10 (41.7%) specimens were from tongue and 14 (58.3%) from the floor of mouth. A total of eight patients (33.3%) developed delayed neck metastasis to regional LN following primary tumor resection at a mean interval of 19 months (range, 7 to 63) with 75% occurring within 2 years. DNM represents occult LN metastatic disease that is clinically and radiographically undetectable at the time of diagnosis and treatment, but later becomes apparent in 27% to 40% of oral cancers.31 The remaining 66.7% did not develop DNM within the interval of evaluation represented in this study. Results of histological tumor grading are summarized in Table 1 with emphasis on malignant morphological characteristics of tumor cells and tumor–host relationships. Additionally, mean tumor thickness was determined to be 2.43 mmol/L (Table 1).31 Composite grade representing six parameters ranged from 8 to 17 (n = 24) and ICG ranged from 6 to 15 (n = 24).
Table 1.
OSCC Tumor Characteristics
| Grade 1⁎ | Grade 2 | Grade 3 | Grade 4 | |
|---|---|---|---|---|
| Histopathological tumor grading | ||||
| Morphologic parameters, n (%) | ||||
| Degree of keratinization | 17 (70.8) | 4 (16.7) | 2 (8.3) | 1 (4.2) |
| Nuclear polymorphism | 10 (41.7) | 6 (25) | 5 (20.8) | 3 (12.5) |
| Number of mitoses | 9 (37.5) | 10 (41.7) | 3 (12.5) | 2 (8.3) |
| Tumor–host relationships | ||||
| Pattern of invasion | 3 (12.5) | 12 (50) | 5 (20.8) | 4 (16.7) |
| Stage of invasion | 2 (8.4) | 17 (70.8) | 5 (20.8) | 0 |
| Lymphocytic infiltration | 3 (12.5) | 8 (33.3) | 11 (45.8) | 2 (8.4) |
| Scores | Mean | Std Dev | Minimum | Maximum |
| CG score | 12.46 | 3.06 | 8.00 | 17.00 |
| ICG score | 10.33 | 2.82 | 6.00 | 15.00 |
| Tumor thickness† | Number | Mean | Minimum | Maximum |
| Tumor thickness, mm | 21 | 2.43 | 1 | 4.5 |
| Tumor stage (T stage) | Frequency | Percent | ||
| 1 | 16 | 66.67 | ||
| 2 | 8 | 33.33 | ||
| Delayed neck metastasis (DNM) | Frequency | Percent | ||
| 0 | 16 | 66.67 | ||
| 1 | 8 | 33.33 | ||
CG, composite grade; ICG, invasive cell grade; OSCC, oral squamous cell carcinoma.
The tumors were classified based on degree of keratinization, nuclear polymorphism, number of mitoses, invasive pattern, stage of invasion, and lymphoplasmacytic infiltration, paying particular attention to the most dysplastic area of the invasive front. Each of these six parameters was graded for individual tumor sections using a four-point rating scale, with a grade of 1 corresponding to a more differentiated presentation (eg, abundant keratinization), and a grade of 4 corresponding to the least differentiated presentation (eg, absence of keratinization).
Tumor thickness was measured microscopically in millimeters by measuring from the surface of the epithelium to the deepest invading tumor island or cell, using a reconstructed line excluding any exophytic component of the tumor and including the thickness of epithelium that is lost due to ulceration.
SLPI Expression in Normal and Tumor Epithelium
To address potential involvement of mucosal epithelium-derived SLPI in these characterized oral cancers, we first compared SLPI expression in OSCC with noninvolved surrounding mucosal epithelial tissues, as well as oral epithelial tissues from individuals without tumors (controls) (Figure 1). In control epithelium, the majority of cells were typically SLPI positive (≥76% positive; score = 4) (Figure 1). In comparison, tumor regions exhibited strikingly fewer SLPI-expressing cells (Figure 1), with the majority (67%) demonstrating a low percentage of SLPI+ cells (Figure 1E, score = 0 to 1), and in several tumors, SLPI could not be detected. Only 8% exhibited staining comparable to levels in nonmalignant epithelium, and a significant difference was evident between the SLPI score in normal epithelium and squamous carcinoma (P = 0.001). Even comparing SLPI staining in apparently noninvolved regions surrounding the tumor demonstrated a marked differential (Figure 1E, OSCC versus noninvolved, P < 0.001). This divergent staining pattern reflected discordant expression of SLPI detected by RT-PCR in control and HNSCC tissues (Figure 1E, inset). Inflammatory cell infiltrates were not positive for SLPI in tumor samples (Figure 1, C and D). When SLPI was examined relative to tumor stages (Figure 1F), a significant inverse correlation between SLPI in control and T1N0M0 (P = 0.003) and T2N0M0 (P = 0.002) tissue was evident (Figure 1G).
Figure 1.
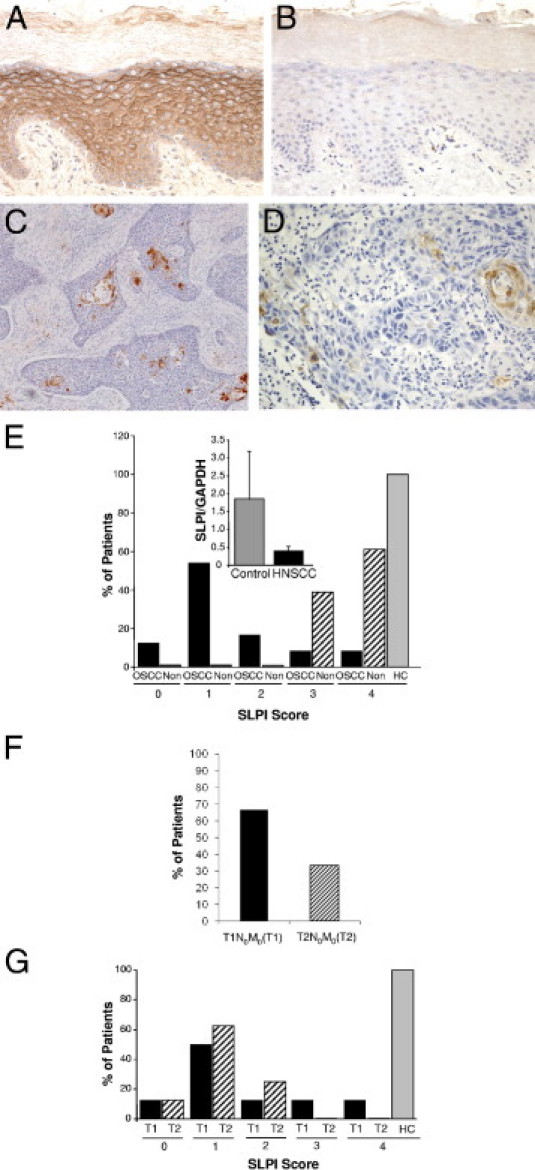
SLPI expression in OSCC. A–D: IHC staining for SLPI in representative tissue sections from control oral epithelium (A) with isotype control (B) at original magnification, ×20. C: SLPI staining of OSCC (×10) and (×20) (D) with limited SLPI-positive cells and without evidence of staining in inflammatory infiltrates. E: SLPI staining is categorized according to the percentage of positively stained cells, and the percentage of patients (OSCC) (n = 24), noninvolved (Non) surrounding tissues (n = 23), and healthy controls (HC) in each SLPI category are shown. P < 0.001 between SLPI staining in HC and OSCC by Fisher's exact test; OSCC versus noninvolved P < 0.001. Inset: RNA from healthy oral epithelium (control) and HNSCC tissue (n = 10) was probed for SLPI and GAPDH expression by RT-PCR and the ratio of SLPI to GAPDH shown. Mean ± SEM. F: Tumor stage: Percentage of patients categorized as T1N0M0(T1) and T2N0M0(T2) stages. G: OSCC (%) patients in T1N0M0(T1) and T2N0M0(T2) stages with SLPI expression levels (scores, 0 to 4). A comparison of SLPI expression in tumor stages to healthy control (HC) by Fisher's exact test showed a significant inverse correlation between SLPI and T1N0M0 (P = 0.003) and T2N0M0 (P = 0.002).
Correlation between SLPI and Tumor Parameters
Histopathological tumor grading (Table 1) and clinical staging are used to define extent of tumor load, predict prognosis, and determine treatment options for patients with intraoral SCC. Analysis of SLPI in relation to these parameters revealed interesting evidence of a link between levels of SLPI and parameters of invasion. Significant inverse correlations between SLPI+ staining in tumor cells and pattern of invasion (P = 0.04) (Figure 2A) and stage of invasion (SI) were detected (Table 2). When compared to tumor CG (r = 0.643; P = 0.001) (Figure 2B) or ICG (r = −0.62, P = 0.001) (Figure 2C, Table 2), SLPI was highly significantly inversely correlated with these histological malignancy traits. Interestingly, SLPI was also inversely correlated to number of mitoses (P = 0.004), but not tumor stage (Table 2). Although patients who developed DNM to regional LN (n = 8) exhibited the lowest levels of SLPI in their primary tumors, this was not statistically significant, possibly due to the small number of cases and/or to limited SLPI identified in either DNM− or DNM+ cases. Of DNM+ patients, five had ≤25% SLPI positive cells, whereas only one expressed >50% SLPI staining.
Figure 2.
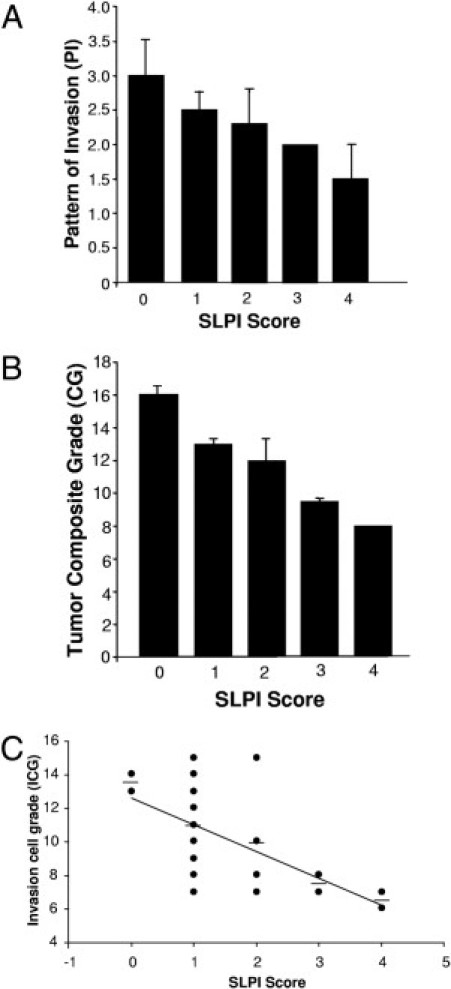
SLPI expression and parameters of tumor cell invasion. A: Tumor histopathological parameters relative to invasion were assessed using a four-point rating scale based on 1 = more differentiated and 4 = least differentiated. Means for pattern of invasion (PI) and correlation (r) between tumor parameters and SLPI expression are shown. PI, r = −0.42, P = 0.04. B: Mean tumor composite grades (CG) represent the sum of six individual grades. The CG and SLPI staining score are significantly inversely associated: r = −0.66, P < 0.001. C: Correlation between SLPI (0 to 4) and tumor invasive cell grade (ICG) calculated by Pearson correlation with r = −0.62, P = 0.001.
Table 2.
Correlations between Tumor Parameters and SLPI, Elastase, and Plasmim
| SLPI (n = 24) |
Elastase (n = 17) |
Plasmin (n = 22) |
||||
|---|---|---|---|---|---|---|
| r+ | P++ | r+ | P++ | r+ | P++ | |
| Ordinal variables⁎ | ||||||
| Degree of keratinization | −0.242 | 0.260 | 0.499 | 0.048 | 0.316 | 0.166 |
| Nuclear polymorphism | −0.352 | 0.092 | −0.359 | 0.160 | −0.152 | 0.512 |
| Number of mitoses | −0.570 | 0.004 | 0.139 | 0.601 | −0.113 | 0.615 |
| Pattern of invasion | −0.417 | 0.044 | 0.234 | 0.367 | 0.065 | 0.765 |
| Stage of invasion | −0.470 | 0.019 | 0.481 | 0.049 | 0.090 | 0.732 |
| Lymphocytic infiltration | −0.309 | 0.142 | 0.009 | 0.975 | −0.459 | 0.035 |
| Continuous variables† | ||||||
| Composite grade (CG) | −0.657 | 0.0003 | 0.207 | 0.435 | −0.059 | 0.826 |
| Tumor thickness (TT) | 0.120 | 0.626 | 0.127 | 0.682 | 0.511 | 0.026 |
| Invasive cell grade (ICG) | −0.624 | 0.001 | 0.120 | 0.658 | −0.083 | 0.740 |
| Dichotomous variables‡ | ||||||
| T stage | −0.218 | 0.344 | 0.451 | 0.098 | −0.023 | 1.000 |
| DNM | 0.055 | 0.853 | 0.040 | 1.000 | 0.402 | 0.078 |
Bold indicates significance. r+, correlation coefficient, P++, exact P value, bold numbers, significant.
For ordinal variables, the association between SLPI, elastase, plasmin, and tumor parameters (degree of keratinization, nuclear polymorphism, number of mitoses, pattern of invasion, stage of invasion, and lymphocytic infiltration) was measured by Spearman correlation coefficient. Exact P values were estimated by Monte Carlo Simulation.
For continuous variables, the association between SLPI, elastase, plasmin, and tumor parameters (composite score, tumor thickness/depth of invasion, and invasive cell grade score) was measured by Pearson linear correlation coefficient. Exact P values were estimated by Monte Carlo Simulation.
For dichotomous variables, the association between proteins (SLPI, elastase, and plasmin) and tumor parameters [tumor stage (T stage) and delayed neck metastasis (DNM)] was measured by point biserial correlation.
Elastase Correlation with OSCC Invasion
One known target of SLPI is elastase, which has multiple proteolytic activities, including activation of tPA and pro-uPA. In OSCC tissues, elastase was not detected in tumor cells, but was localized to inflammatory cell infiltrates (Figure 3, A and C), whereas little or no elastase was evident in control tissues (Figure 3B). In tumor-bearing sections, we observed that tissues displaying weaker SLPI staining typically demonstrated stronger staining for elastase (Figure 3E, r = −0.369), albeit not significant. Multiple factors may influence this relationship, most notably that elastase and SLPI are not produced by the same cell populations, and inhibition of elastase activity may not be reflected at the level of protein staining. Nonetheless, when comparing elastase staining with stage of invasion (r = 0.481, P = 0.049), as well as with degree of keratinization (r = 0.499, P = 0.048), a significant correlation was evident (Figure 3D, Table 2). Furthermore, the finding that a positive, but not significant, correlation existed between elastase+ cells and T stage (Table 2) implicated elastase in OSCC progression and the paucity of SLPI with potential failure to inhibit its activity.
Figure 3.

Elastase expression in OSCC. A and B: IHC staining for elastase in OSCC (A) and HC (B) tissue sections. Original magnification, ×10. C: Elastase-stained tumor-bearing tissue demonstrating that infiltrating inflammatory cells, but not tumor cells, are elastase positive. Original ×40. D: Mean ± SEM elastase+ staining was associated with stage of tumor invasion (SI). r = 0.481; P = 0.049. E: Elastase and SLPI staining was graded on an expanded scale according to percentage of positively stained cells (0 to 6); by Spearman's correlation, r = −0.369; P > 0.05.
SLPI Inhibition of MMP
The finding that reduced SLPI was accompanied by an enhanced potential for oral cancer invasion suggested that SLPI influences this process through inhibition of elastase and/or proteolytic events beyond elastase. In myeloid cells, SLPI reportedly inhibits MMP via a prostaglandin E2-cAMP–dependent pathway,18 although this has not yet been examined in tumor cells. As anticipated, expression of MMPs was evident in OSCC tissues, not only associated with tumor cells, but also with stromal cells, including infiltrating leukocytes (Figure 4, MMP9 shown). To further explore potential links between reduced SLPI and increased MMP in tumor progression, we used two HNSCC cell lines, HN12 and Tu1386, in parallel with a nonmalignant keratinocyte line, NHEK. As monitored by RT-PCR (Figure 4C), both cell lines constitutively expressed significantly lower SLPI levels than NHEK cells (P < 0.002), consistent with reduced SLPI protein and RNA in OSCC. By comparison, NHEK constitutively expressed less MMP activity than tumor cell lines as monitored using a gelatinase activity assay. Moreover, exogenously added SLPI significantly inhibited MMP2 activity in tumor cells, but not the limited constitutive levels in NHEK (Figure 4D). Comparable results were obtained by zymographic analysis (data not shown). Suppression of MMP2 activity may reflect effects at multiple steps, so we next evaluated mRNA after cells were treated with SLPI. In HN12 cells, SLPI exhibited dose-dependent inhibitory effects on MMP2 by conventional RT-PCR (Figure 4D, inset). Moreover, COX2, coordinately expressed and regulatory for MMP in macrophages18 and overexpressed in OSCC,38 is a target of SLPI,18,22 and COX2 was diminished by SLPI in parallel with MMP2 (Figure 4D, inset). In addition, when we monitored the effect of SLPI on MMP9 in confluent and nonconfluent HN12 cells, SLPI blunted expression of this protease (Figure 4E), consistent with abundant expression of MMP9 (Figure 4A) under conditions of diminished SLPI expression. These data indicate that SLPI interferes with both MMP synthesis and likely, proteolytic conversion of its zymogen form.
Figure 4.
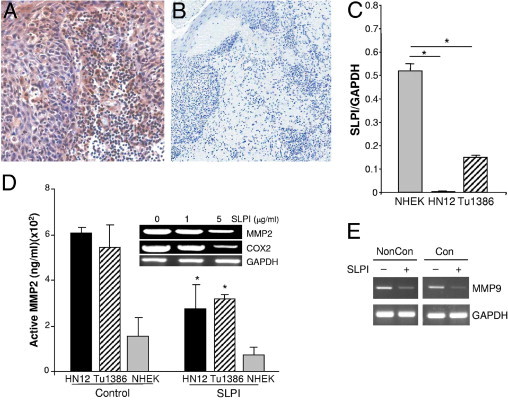
Effect of SLPI on metalloproteinase-2 and COX-2. A and B: IHC staining for MMP9 on OSCC sections revealed MMP9 immunoreactivity associated with tumor cells and stromal cells (original magnification, ×40) (A) and isotype control; original magnification, ×10 (B). C: RNA from Tu1386, HN12, and NHEK was probed for SLPI and GAPDH expression by RT-PCR and the ratio of SLPI to GAPDH shown. Mean ± SEM, *P ≤ 0.002. D: Tumor cell lines and control NHEK cells were cultured without (control) or with SLPI (5 μg/mL), and 24-hour supernatants tested for MMP2 activity. *P < 0.01, Student's t-test. Inset: Total RNA was extracted from HN12 cells treated with SLPI (0 to 5 μg/mL) overnight for cRT-PCR for MMP2, COX2, and GAPDH. E: HN12 cells under nonconfluent (noncon) and confluent (con) were treated with SLPI (10 μg/mL) overnight and total RNA extracted for cRT-PCR for MMP9 and GAPDH.
Plasmin Expression in OSCC
Plasmin is known to activate zymogens of several MMPs, providing the cells with enzymatic machinery to break down and invade surrounding tissue structures.39 Tumor sections were variably positive for plasmin, with 60% (13/22) exhibiting >75% positive cells and highest plasmin staining was typically accompanied by lowest SLPI staining (Figure 5, A–C). Positive staining included tumor cells as well as infiltrating inflammatory cell populations (Figure 5, D and E), and when analyzing staining intensity, significant positive correlations were identified between plasmin intensity and tumor thickness/depth of invasion (r = 0.51, P < 0.03) (Figure 5F, Table 2). In patients with DNM, 71% displayed evidence of strong plasmin intensity, two with moderately intense staining. None of the DNM+ subjects had weak or negative staining compared to those without DNM (Figure 5G). Point biserial correlation revealed a positive, but not significant, correlation between intensity of plasmin and DNM (Figure 5G, Table 2).
Figure 5.
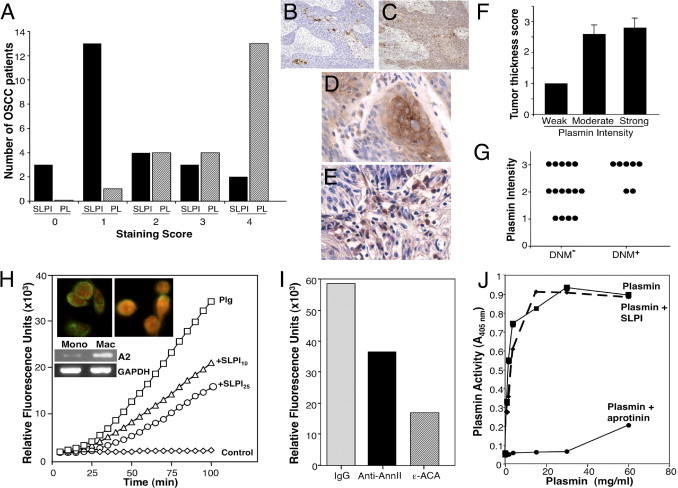
Plasmin expression in OSCC and SLPI regulation of macrophage plasminogen activation. A: Plasmin staining was classified according to percentage positively staining cells (0 to 4). Number of patients in each plasmin category is shown in parallel with SLPI staining. B and C: IHC staining for SLPI (B) and plasmin (C) in tumor sections. Original magnification, ×10. D and E: IHC staining for plasmin in tumor (D) and in inflammatory cell infiltrate (E) in OSCC tissue sections. Original magnification, ×40. F: Plasmin staining was semiquantitatively classified according to intensity of staining: W (weak = 1), M (moderate = 2), and S (strong = 3) and mean grade for tumor thickness (TT) related to these staining categories. TT r = 0.511, P < 0.03. G: Relationship between plasmin stain intensity and DNM (n = 7). By point biserial correlation, r = 0.402, P = 0.07, showing positive, but not significant correlation between intensity of plasmin stain and DNM. H: Monocytes (1 × 10⁶ cells/mL) in incubation buffer (100 μL of Hepes-buffered saline containing 3 mmol/L CaCl2 and 1 mmol/L MgCl2) were incubated with 100 nmol/L glu- plasminogen for 1 hour at 4°C. Then SLPI (10 to 25 μg/mL) was added for 45 minutes at 4°C, the cells washed, tPA (12 nmol/L) and the fluorogenic plasmin substrate AFC-081 (166 μmol/L) were added. Control represents cells with substrate and tPA, but no plasminogen. Substrate hydrolysis was measured at 5-minute intervals. Inset: For fluorescence microscopy, macrophages cultured in four-chamber glass slides were incubated with biotinylated rhSLPI (left)23 or without (right) for 5 minutes at 37°C, washed with PBS, and incubated with neutravidin-FITC (green) in PBS for 30 minutes at 4°C. Slides were rinsed, fixed in 2% paraformaldehyde, incubated with propidium iodide (red) for 5 minutes, rinsed, and mounted with SlowFade reagent before fluorescence microscopy. Inset: Parallel unstimulated monocyte and macrophage RNA from three donors was probed for annexin II and GAPDH by RT-PCR. I: Monocytes were incubated with plasminogen as described in A and then rabbit polyclonal anti-annexin II IgG, rabbit IgG (60 μg/mL) and ε-ACA at 10 mmol/L were added for 45 minutes before tPA and AFC-081 were added and hydrolysis measured (100 minutes shown) (n = 4). J: Plasmin was incubated with 50 μL of buffer, SLPI, or aprotinin (10 KIU/mL) for 15 minutes at 37°C before addition of Spectrozyme PL. Plasmin generation/activity was directly proportional to the increase in absorbance at 405 nm.
Effect of SLPI on Plasmin Generation
Although no prior connection existed between SLPI and plasmin activity, our recent evidence that SLPI can bind to annexin A2 on macrophages23 provided a clue. Exogenous SLPI binds to human macrophages (Figure 5H, inset), consistent with enhanced expression of annexin A2 in these cells relative to immature monocytes (Figure 5H, inset bottom).23 Since annexin A2 expression on mononuclear phagocytes has been linked to the plasminogen activation system,36,40 we examined whether SLPI, via its interaction with annexin A2, could influence this membrane proteolytic event. Annexin A2 on the cell surface binds and colocalizes both tPA and plasminogen,40 and in this configuration, tPA, a highly specific serine protease, cleaves a single peptide bond in plasminogen, converting it to the activated enzyme plasmin. Pretreatment of human mononuclear phagocytes with SLPI blunts the ability of the cells to catalytically drive plasmin production (Figure 5H). Cells (1 × 10⁶ cells/mL) were incubated with 100 nmol/L glu-plasminogen for 1 hour at 4°C in the presence of SLPI (0 to 25 μg/mL), washed, and tPA and the fluorogenic plasmin substrate AFC-081 were added before substrate hydrolysis was measured fluorometrically. SLPI was as effective at attenuating cellular plasmin generation as treating the cells with an antibody directed at annexin A2 or ε-amino-caproic acid a selective inhibitor of plasminogen activation (Figure 5I).
Once activated, plasmin itself is a serine protease and potentially susceptible to suppression by SLPI. To determine whether the mechanism of action of SLPI was as an anti-plasmin, a cell-free system was next evaluated. The addition of active plasmin to its chromogenic substrate in the absence of macrophages resulted in substrate cleavage (Figure 5J). Inclusion of SLPI in the assay demonstrated no direct inhibitory activity of SLPI on plasmin proteolysis, whereas the plasmin inhibitor aprotinin nearly totally suppressed substrate degradation (Figure 5J). SLPI was clearly active in that it blocked elastase-specific substrate cleavage (data not shown). These data indicate that the site of SLPI suppression of plasmin involved macrophages and was most likely associated with plasminogen activation on the macrophage membrane. To further define the site of SLPI action in suppressing plasmin, we used RNA interference–mediated silencing of the annexin A2 gene, which attenuates annexin A2 expression without affecting α-tubulin (Figure 6A, inset), and dramatically suppresses macrophage-dependent plasminogen activation (Figure 6A). These data support the evidence that the mechanism of suppressing plasmin by SLPI is not through direct blocking of its proteolytic activity, but rather by binding to annexin A2. SLPI disrupts the macrophage annexin A2–dependent assemblage and/or activity of tPA and plasminogen at the cell surface, resulting in suppression of the proteolytic cleavage of plasminogen into plasmin, and potentially is instrumental in blocking matrix remodeling and/or macrophage migration at sites of inflammation20 and/or tumorigenesis.
Figure 6.
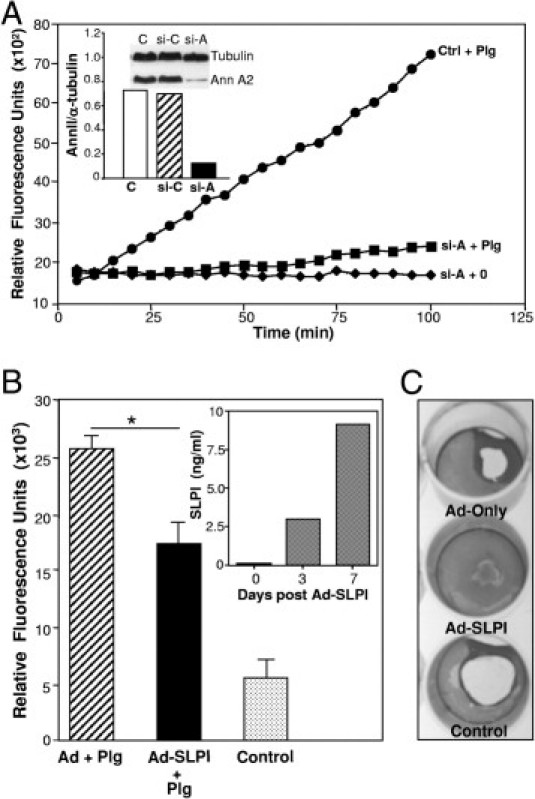
Loss of annexin A2 and overexpression of SLPI alter plasminogen activation. A: Annexin II siRNA (si-A) and an unrelated control siRNA (si-C) were transfected into monocytes using the Amaxa Human Dendritic Cell Nucleofector kit.23 The cells were incubated 6 days before analysis of annexin II and α-tubulin (control) protein using Western blot (inset) and plasmin proteolytic activity in parallel with control (ctrl) cells. B: Adherent macrophages were treated with adenovirus vector (Ad), adenovirus-SLPI (Ad-SLPI), or no treatment. After 24 hours incubation, medium was removed and replaced with 10% DMEM. Day 3 to 7 supernatants were tested for SLPI by ELISA (inset, n = 2). Cells were detached, washed in PBS, and tested for plasminogen (Plg) activation (relative fluorescent units × 103) in parallel with control cells. *P < 0.05. C: Fibrin gels were prepared in 12-well plates and the transfected (Ad-only, Ad-SLPI) and control macrophages were resuspended in gelatin barbital buffer and 50 μL (2 × 10⁶ cells) added to fibrin plates for 1 to 3 days at 37°C. The 3-day wells were then stained with Coomassie Blue (n = 2) and areas of degradation visualized.
Expression of SLPI by Human Macrophages Inhibits Plasmin
Since human macrophages, in contrast to murine macrophages,16,20,41 are not a ready source of SLPI, negating a causative role for this antiprotease in an autocrine regulation of the fibrinolytic pathway, we converted these SLPI-negative cells into SLPI producers with adenovirus-SLPI. After 3 days, cells transfected with adeno-SLPI, but not adenoviral vector, only actively produced SLPI, as detected by ELISA (Figure 6B, inset). Treated macrophages were then tested for their ability to activate the plasminolytic pathway and dissolve fibrin gels. As evident in Figure 6B, macrophages transfected with adeno-SLPI exhibited significantly less plasmin-dependent cleavage of substrate than macrophages receiving vector only (P < 0.05). Control cell cultures not receiving plasminogen were minimally active. Moreover, in a fibrin gel assay, adeno-SLPI–transfected macrophages were inhibited in their ability to degrade matrix (Figure 6C), compared to adenovector-treated or untreated control populations. Thus, these data further support SLPI-dependent suppression of macrophage plasminogen activation resulting in reduced plasmin. Since collectively, our data on macrophages demonstrate that SLPI binds to membrane annexin A2 and thereby blocks plasminogen activation, this may represent a defective antagonistic mechanism in HNSCC, where SLPI expression is down-regulated and unable to blunt plasmin activation in infiltrating inflammatory cells.
Plasminogen Activation in OSCC and in Tumor Cell Lines
We subsequently examined annexin A2 expression on the two HNSCC cell lines, to determine whether parallel mechanisms were operative in tumor cells, which are also a source of matrix degrading plasmin. First, annexin A2 was evident on these cells as detected by immunofluorescence imaging, and addition of exogenous SLPI demonstrated colocalization with annexin A2 (Figure 7). For functional assessment, cell lines were treated with SLPI for 1 hour before adding precursor plasminogen. Plasmin formation was monitored by cleavage of a colorimetric plasmin substrate. SLPI significantly inhibited plasmin generation in both HN12 and Tu1386 (Figure 7E; P = 0.02, P = 0.001, respectively), but not NHEK, which constitutively express SLPI (Figure 4C), relative to ACA.
Figure 7.
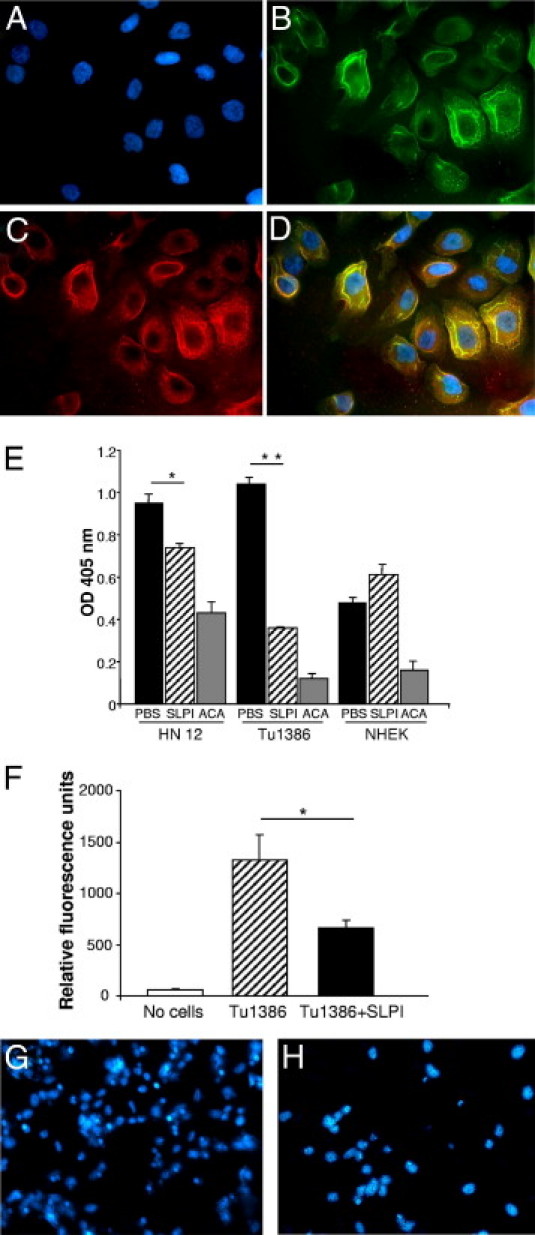
Annexin A2 in tumor cell lines and modulation of plasminogen activation and cell invasion by SLPI. A–D: HN12 cultured on coverslips in 24-well plates were stained for DAPI (blue nuclei) (A), annexin A2 (FITC secondary antibody) (B), and SLPI(TRITC secondary antibody) (C), and the images overlaid (D). Yellow indicates colocalization. E: HN12, Tu1386, and NHEK cells (2 × 10⁵) were cultured in 12-well plates with SLPI (5 μg/mL), ε-amino-caproic acid (ACA) (0.5 M), and PBS for 1 hour in phenol red–free medium, incubated with 0.5 μmol/L plasminogen for 4 hours at 37°C and the cellular plasmin generated from plasminogen monitored by measuring amidolytic activity. The reaction was initiated by adding colorimetric substrate H-d-norleucyl-hexahydrotyrosyl-lysine-p-nitroanilide to 200 μL of conditioned medium and monitored at 405 nm on a microplate reader. *P = 0.02; **P < 0.001. F: Tu1386 cells were incubated in the absence or presence of SLPI (5 μg/mL) in the invasive cell assay for 48 hours. Invasive cells were lysed and stained with CyQuant GR dye. Fluorescence was quantified using a 480-nm/530-nm filter set. *P = 0.003, Student's t-test. Results are representative of three experiments. G and H: After Tu1386 cells incubated in the absence (G) or presence (H) of SLPI (5 μg/mL) migrated in the invasive cell assay for 48 hours, the filters were fixed, incubated in DAPI, mounted, and photographed.
SLPI Inhibition of Cancer Cell Migration and Invasion
The intriguing association of SLPI with OSCC tumor pattern, stage of invasion and proteolytic pathways in vivo and in vitro, implicates SLPI in coordination of events underlying migration and/or invasion. Therefore, to establish a functional correlate, we monitored the ability of the invasive HNSCC line Tu1386, which expresses minimal levels of SLPI (Figure 4C), to migrate and invade a matrix substrate. Cells were seeded in the top of an invasion chamber with exogenous SLPI, and the number of cells that traversed the matrix-coated membrane into the lower chamber was determined using a fluorescent dye. SLPI significantly reduced the ability of tumor cells to invade the extracellular matrix and migrate to the opposite side of membranes, as shown by staining of nuclei with DAPI (Figure 7, G and H) and by fluorescence quantification (Figure 7F, P = 0.003; n = 3). These in vitro data are consistent with the inverse correlation between tumor SLPI expression and parameters of invasion.
Discussion
Our continuing efforts to identify aberrant pathways underlying tumor progression in OSCC, one of the most intractable of cancers, have revealed repressed SLPI expression. Correlative data demonstrated reduced SLPI RNA levels in HNSCC cell lines relative to normal epithelium or to a nonmalignant keratinocyte cell line. Moreover, SLPI expression was significantly inversely correlated with multiple tumor invasion parameters, including stage of invasion, pattern of invasion, ICG, and CG, which collectively implicate SLPI in a protective role against oral cancer cell invasion. Since “invasion pattern” represents a prognostic factor in OSCC,42 and the ICG may enable correct identification of 90% of T1-T2 patients with occult metastasis,33 the finding of inverse correlations between SLPI and these parameters may not only reflect an inhibitory function of SLPI in tumor invasion, but may also represent a potential biomarker in evaluating prognosis and treatment planning.
Proteolytic cleavage of pericellular and surrounding extracellular matrices is a prerequisite for tumor cell detachment, motility, and invasion. Our dissection of potential pathways intersected by SLPI in OSCC invasion revolved around its expanding antiproteolytic repertoire. Significant positive correlations were evident between inflammatory cell elastase and stage of invasion, as well as with degree of keratinization. In addition to elastase, localization and concentration of multiple proteases, including cathepsin B, plasminogen/plasmin, tPA/uPA, and tenascin-C in the pericellular microenvironment favor tumor cell migration. Our emerging data define a role for SLPI in regulation of plasminolysis, not by directly inhibiting plasmin, but rather by interfering with elastolytic cleavage of plasminogen17 and with plasminogen activation on the cell surface. Plasmin is highly expressed in tumor tissues, such as in OSCC,3 as are uPA and tPA,4 along with facilitators, annexin A2 and uPAR/CD87. Annexin A2, with multiple functions, is positively associated with malignant progression in almost all cancers,43–45 and increased uPA/urokinase-type PA receptor activity is also correlated with tumor invasiveness,6,46 although inhibiting uPA has not been as therapeutically effective as anticipated.47 Plasmin, when bound to cells, is protected from inhibition by α2-antiplasmin,48 focusing attention on blocking its conversion, rather than its proteolytic activity, as orchestrated by SLPI, which binds to annexin A223 and interferes with plasminogen activation. Nonetheless, plasminogen binds to multiple cell surface receptors48,49 and dissecting out relative roles of each of these in the activation sequelae represents a complex problem. Interestingly, with pancreatic tumor progression, a switch from cytoplasmic to cell surface annexin A2 occurred50 with colocalization of tPA, such that disruption of this interaction decreased invasive capacity.11
Plasminogen activation to plasmin has a negative influence on multiple aspects of HNSCC tumorigenesis, including migration, proteolytic activation of pro-MMPs, metastatic behavior, TGF-β activation, and immune surveillance.51 Annexin A2 also binds cathepsin B, a cysteine protease often up-regulated in tumors at the invasive edge, which not only orchestrates degradation of collagen IV and laminin, but also activates uPA precursor.43 The ability of annexin A2 to function as a coordinating center to support interactions between proteases and their substrates in initiation of proteolytic cascades may be pivotal to detachment, invasion, and metastasis. Enhanced elastase and plasmin, in turn, activate MMP proenzymes, and MMP2 and MMP9 are predictors of poor prognosis in OSCC.52 Moreover, inhibiting COX2 reportedly suppresses OSCC invasiveness through down-regulation of MMP2,53 partnering these two molecules. With repression of SLPI, tumor cells may lose control of this proteolytic onslaught and in fact, take advantage of this loss of antiprotease activity to commence invasion tactics.
Prevailing evidence indicates that SLPI behaves differently depending on the anatomical origin of the tumor. In experimental models, evidence also exists for disparate roles of SLPI in tumorigenesis, both supportive and suppressive.29,54 This may reflect, in part, the ability of rodent, in contrast to human inflammatory cells to generate SLPI20,21,41 as a component of the tumor microenvironment. Moreover, the ability of SLPI to regulate cell growth via protection of growth-promoting proepithelin from elastase21 may be distinct from regulation of proteolytic events linked to invasion. Up-regulation, rather than repression of SLPI, has been noted, particularly in ovarian cancers,14 and ovarian cancer cell lines overexpressing SLPI fail to cleave proepithelin/progranulin, which in its intact form is a tumor growth factor.30 Although not explored further in our study, the inverse correlation between SLPI and number of mitoses (P = 0.004) in OSCC remains an intriguing finding, as is the dichotomous SLPI expression in oral versus ovarian cancers, perhaps influenced by hormonal regulation of the SLPI promoter by estrogen and progesterone.55–57 Elucidation of regulatory mechanisms associated with SLPI over- and underexpression can conceivably provide insight into restoration of levels to a nontumorigenic phenotype. Another possible influential factor to be considered is human papillomavirus (HPV), detected in a subset of OSCC,58 and also seen in gynecological tumors.59 Although human papillomavirus has not yet been shown to regulate SLPI, other viruses, such as herpes simplex virus, down-regulate SLPI.60
The role played by SLPI in tumor development appears increasingly complex, impacted by species, tumor location, endocrine effects, infectious agents, cell type, and stage of differentiation/progression. Nonetheless, it may be informative that in recent studies to pinpoint genes linked to tumor progression, four genes were identified that synergistically promote progression, notably, epiregulin, MMP1, MMP2, and COX2,61 co-opted from vascular remodeling, inflammation, and wound healing events. Several of these pivotal molecules represent SLPI targets, and although additional mechanisms, including its ability to attenuate inflammation and inhibit NFκB,19,20 may be operative in influencing tumor cell progression, reduced levels of SLPI in OSCC appear to tilt the protease–antiprotease balance to foster tumor cell escape from its local boundaries.
Acknowledgments
We thank Dr. Robert Ord (University of Maryland, Baltimore, MD) for patient data, Dr. J. Silvio Gutkind [National Institute of Dental and Craniofacial Research (NIDCR), National Institutes of Health (NIH) Bethesda, MD] for HN12 cells and oral epithelial RNA, Dr. Peter Sacks (New York University College of Dentistry, New York, NY) for Tu1386 cells, Dr. Alfredo A. Molino and Dr. Sofia Rekka (NIDCR, NIH) for histopathology and IHC expertise, and Rick Dreyfuss for photographic assistance.
Footnotes
Supported in part by the Intramural Research Program of the National Institutes of Health, National Institute of Dental and Craniofacial Research.
Current address of N.G.N., Department of Oral Medicine and Pathology; Dental School, University of Athens, Greece; of G.W., Department of Oral-Maxillofacial Surgery, University of Maryland Medical Center, Baltimore, MD.
References
- 1.Jemal A., Siegel R., Ward E., Hao Y., Xu J., Murray T., Thun M.J. Cancer statistics, 2008. CA Cancer J Clin. 2008;58:71–96. doi: 10.3322/CA.2007.0010. [DOI] [PubMed] [Google Scholar]
- 2.Fukano H., Matsuura H., Hasegawa Y., Nakamura S. Depth of invasion as a predictive factor for cervical lymph node metastasis in tongue carcinoma. Head Neck. 1997;19:205–210. doi: 10.1002/(sici)1097-0347(199705)19:3<205::aid-hed7>3.0.co;2-6. [DOI] [PubMed] [Google Scholar]
- 3.Curino A., Patel V., Nielsen B.S., Iskander A.J., Ensley J.F., Yoo G.H., Holsinger F.C., Myers J.N., El-Nagaar A., Kellman R.M., Shillitoe E.J., Molinolo A.A., Gutkind J.S., Bugge T.H. Detection of plasminogen activators in oral cancer by laser capture microdissection combined with zymography. Oral Oncol. 2004;40:1026–1032. doi: 10.1016/j.oraloncology.2004.05.011. [DOI] [PubMed] [Google Scholar]
- 4.Ranson M., Andronicos N.M. Plasminogen binding and cancer: promises and pitfalls. Front Biosci. 2003;8:S294–S304. doi: 10.2741/1044. [DOI] [PubMed] [Google Scholar]
- 5.Tang C.H., Wei Y. The urokinase receptor and integrins in cancer progression. Cell Mol Life Sci. 2008;65:1916–1932. doi: 10.1007/s00018-008-7573-9. [DOI] [PMC free article] [PubMed] [Google Scholar]
- 6.Duffy M.J. The urokinase plasminogen activator system: role in malignancy. Curr Pharm Des. 2004;10:39–49. doi: 10.2174/1381612043453559. [DOI] [PubMed] [Google Scholar]
- 7.Sharma M.C., Sharma M. The role of annexin II in angiogenesis and tumor progression: a potential therapeutic target. Curr Pharm Des. 2007;13:3568–3575. doi: 10.2174/138161207782794167. [DOI] [PubMed] [Google Scholar]
- 8.Kwon M., MacLeod T.J., Zhang Y., Waisman D.M. S100A10, annexin A2, and annexin a2 heterotetramer as candidate plasminogen receptors. Front Biosci. 2005;10:300–325. doi: 10.2741/1529. [DOI] [PubMed] [Google Scholar]
- 9.Brownstein C., Falcone D.J., Jacovina A., Hajjar K.A. A mediator of cell surface-specific plasmin generation. Ann N Y Acad Sci. 2001;947:143–155. discussion 155–146. [PubMed] [Google Scholar]
- 10.Shi Z., Stack M.S. Urinary-type plasminogen activator (uPA) and its receptor (uPAR) in squamous cell carcinoma of the oral cavity. Biochem J. 2007;407:153–159. doi: 10.1042/BJ20071037. [DOI] [PubMed] [Google Scholar]
- 11.Diaz V.M., Hurtado M., Thomson T.M., Reventos J., Paciucci R. Specific interaction of tissue-type plasminogen activator (t-PA) with annexin II on the membrane of pancreatic cancer cells activates plasminogen and promotes invasion in vitro. Gut. 2004;53:993–1000. doi: 10.1136/gut.2003.026831. [DOI] [PMC free article] [PubMed] [Google Scholar]
- 12.Pepper M.S. Role of the matrix metalloproteinase and plasminogen activator-plasmin systems in angiogenesis. Arterioscler Thromb Vasc Biol. 2001;21:1104–1117. doi: 10.1161/hq0701.093685. [DOI] [PubMed] [Google Scholar]
- 13.Mantovani A., Sica A., Allavena P., Garlanda C., Locati M. Tumor-associated macrophages and the related myeloid-derived suppressor cells as a paradigm of the diversity of macrophage activation. Hum Immunol. 2009;70:325–330. doi: 10.1016/j.humimm.2009.02.008. [DOI] [PubMed] [Google Scholar]
- 14.Devoogdt N., Revets H., Ghassabeh G.H., De Baetselier P. Secretory leukocyte protease inhibitor in cancer development. Ann N Y Acad Sci. 2004;1028:380–389. doi: 10.1196/annals.1322.044. [DOI] [PubMed] [Google Scholar]
- 15.Bouchard D., Morisset D., Bourbonnais Y., Tremblay G.M. Proteins with whey-acidic-protein motifs and cancer. Lancet Oncol. 2006;7:167–174. doi: 10.1016/S1470-2045(06)70579-4. [DOI] [PubMed] [Google Scholar]
- 16.Song X., Zeng L., Jin W., Thompson J., Mizel D.E., Lei K., Billinghurst R.C., Poole A.R., Wahl S.M. Secretory leukocyte protease inhibitor suppresses the inflammation and joint damage of bacterial cell wall-induced arthritis. J Exp Med. 1999;190:535–542. doi: 10.1084/jem.190.4.535. [DOI] [PMC free article] [PubMed] [Google Scholar]
- 17.Kelly E., Greene C.M., McElvaney N.G. Targeting neutrophil elastase in cystic fibrosis. Expert Opin Ther Targets. 2008;12:145–157. doi: 10.1517/14728222.12.2.145. [DOI] [PubMed] [Google Scholar]
- 18.Zhang Y., DeWitt D.L., McNeely T.B., Wahl S.M., Wahl L.M. Secretory leukocyte protease inhibitor suppresses the production of monocyte prostaglandin H synthase-2, prostaglandin E2, and matrix metalloproteinases. J Clin Invest. 1997;99:894–900. doi: 10.1172/JCI119254. [DOI] [PMC free article] [PubMed] [Google Scholar]
- 19.Taggart C.C., Cryan S.A., Weldon S., Gibbons A., Greene C.M., Kelly E., Low T.B., O'Neill S.J., McElvaney N.G. Secretory leucoprotease inhibitor binds to NF-kappaB binding sites in monocytes and inhibits p65 binding. J Exp Med. 2005;202:1659–1668. doi: 10.1084/jem.20050768. [DOI] [PMC free article] [PubMed] [Google Scholar]
- 20.Ashcroft G.S., Lei K., Jin W., Longenecker G., Kulkarni A.B., Greenwell-Wild T., Hale-Donze H., McGrady G., Song X.Y., Wahl S.M. Secretory leukocyte protease inhibitor mediates non-redundant functions necessary for normal wound healing. Nat Med. 2000;6:1147–1153. doi: 10.1038/80489. [DOI] [PubMed] [Google Scholar]
- 21.Zhu J., Nathan C., Jin W., Sim D., Ashcroft G.S., Wahl S.M., Lacomis L., Erdjument-Bromage H., Tempst P., Wright C.D., Ding A. Conversion of proepithelin to epithelins: roles of SLPI and elastase in host defense and wound repair. Cell. 2002;111:867–878. doi: 10.1016/s0092-8674(02)01141-8. [DOI] [PubMed] [Google Scholar]
- 22.Angelov N., Moutsopoulos N., Jeong M.J., Nares S., Ashcroft G., Wahl S.M. Aberrant mucosal wound repair in the absence of secretory leukocyte protease inhibitor. Thromb Haemost. 2004;92:288–297. doi: 10.1160/TH03-07-0446. [DOI] [PubMed] [Google Scholar]
- 23.Ma G., Greenwell-Wild T., Lei K., Jin W., Swisher J., Hardegen N., Wild C.T., Wahl S.M. Secretory leukocyte protease inhibitor binds to annexin II, a cofactor for macrophage HIV-1 infection. J Exp Med. 2004;200:1337–1346. doi: 10.1084/jem.20041115. [DOI] [PMC free article] [PubMed] [Google Scholar]
- 24.McNeely T.B., Dealy M., Dripps D.J., Orenstein J.M., Eisenberg S.P., Wahl S.M. Secretory leukocyte protease inhibitor: a human saliva protein exhibiting anti-human immunodeficiency virus 1 activity in vitro. J Clin Invest. 1995;96:456–464. doi: 10.1172/JCI118056. [DOI] [PMC free article] [PubMed] [Google Scholar]
- 25.Malamud D., Wahl S.M. The mouth: a gateway or a trap for HIV? AIDS. 2010;24:5–16. doi: 10.1097/QAD.0b013e328333525f. [DOI] [PMC free article] [PubMed] [Google Scholar]
- 26.Sallenave J.M. Secretory leukocyte protease inhibitor and elafin/trappin-2: versatile mucosal antimicrobials and regulators of immunity. Am J Respir Cell Mol Biol. 2010;42:635–643. doi: 10.1165/rcmb.2010-0095RT. [DOI] [PubMed] [Google Scholar]
- 27.Tian X., Shigemasa K., Hirata E., Gu L., Uebaba Y., Nagai N., O'Brien T.J., Ohama K. Expression of human kallikrein 7 (hK7/SCCE) and its inhibitor antileukoprotease (ALP/SLPI) in uterine endocervical glands and in cervical adenocarcinomas. Oncol Rep. 2004;12:1001–1006. [PubMed] [Google Scholar]
- 28.Wang N., Thuraisingam T., Fallavollita L., Ding A., Radzioch D., Brodt P. The secretory leukocyte protease inhibitor is a type 1 insulin-like growth factor receptor-regulated protein that protects against liver metastasis by attenuating the host proinflammatory response. Cancer Res. 2006;66:3062–3070. doi: 10.1158/0008-5472.CAN-05-2638. [DOI] [PubMed] [Google Scholar]
- 29.Sugino T., Yamaguchi T., Ogura G., Kusakabe T., Goodison S., Homma Y., Suzuki T. The secretory leukocyte protease inhibitor (SLPI) suppresses cancer cell invasion but promotes blood-borne metastasis via an invasion-independent pathway. J Pathol. 2007;212:152–160. doi: 10.1002/path.2156. [DOI] [PMC free article] [PubMed] [Google Scholar]
- 30.Simpkins F.A., Devoogdt N.M., Rasool N., Tchabo N.E., Alejandro E.U., Kamrava M.M., Kohn E.C. The alarm anti-protease, secretory leukocyte protease inhibitor, is a proliferation and survival factor for ovarian cancer cells. Carcinogenesis. 2008;29:466–472. doi: 10.1093/carcin/bgm212. [DOI] [PubMed] [Google Scholar]
- 31.Warburton G., Nikitakis N.G., Roberson P., Marinos N.J., Wu T., Sauk J.J., Jr., Ord R.A., Wahl S.M. Histopathological and lymphangiogenic parameters in relation to lymph node metastasis in early stage oral squamous cell carcinoma. J Oral Maxillofac Surg. 2007;65:475–484. doi: 10.1016/j.joms.2005.12.074. [DOI] [PubMed] [Google Scholar]
- 32.Anneroth G., Batsakis J., Luna M. Review of the literature and a recommended system of malignancy grading in oral squamous cell carcinomas. Scand J Dent Res. 1987;95:229–249. doi: 10.1111/j.1600-0722.1987.tb01836.x. [DOI] [PubMed] [Google Scholar]
- 33.Russolo M., Giacomarra V., Papanikolla L., Tirelli G. Prognostic indicators of occult metastases in oral cancer. Laryngoscope. 2002;112:1320–1323. doi: 10.1097/00005537-200207000-00035. [DOI] [PubMed] [Google Scholar]
- 34.Sacks P.G. Cell, tissue and organ culture as in vitro models to study the biology of squamous cell carcinomas of the head and neck. Cancer Metastasis Rev. 1996;15:27–51. doi: 10.1007/BF00049486. [DOI] [PubMed] [Google Scholar]
- 35.Yeudall W.A., Miyazaki H., Ensley J.F., Cardinali M., Gutkind J.S., Patel V. Uncoupling of epidermal growth factor-dependent proliferation and invasion in a model of squamous carcinoma progression. Oral Oncol. 2005;41:698–708. doi: 10.1016/j.oraloncology.2005.03.004. [DOI] [PubMed] [Google Scholar]
- 36.Hajjar K.A., Jacovina A.T., Chacko J. An endothelial cell receptor for plasminogen/tissue plasminogen activator. I. Identity with annexin II. J Biol Chem. 1994;269:21191–21197. [PubMed] [Google Scholar]
- 37.Paul-Brent P.A., Cattley T.N., Myers S.P., Brooks L., Cheras P.A. A rapid microtitre plate screening method for in vitro assessment of fibrinolysis: a preliminary report. Blood Coagul Fibrinolysis. 2004;15:273–278. doi: 10.1097/00001721-200404000-00014. [DOI] [PubMed] [Google Scholar]
- 38.Bergmann C., Strauss L., Zeidler R., Lang S., Whiteside T.L. Expansion of human T regulatory type 1 cells in the microenvironment of cyclooxygenase 2 overexpressing head and neck squamous cell carcinoma. Cancer Res. 2007;67:8865–8873. doi: 10.1158/0008-5472.CAN-07-0767. [DOI] [PubMed] [Google Scholar]
- 39.Kwaan H.C., McMahon B. The role of plasminogen-plasmin system in cancer. Cancer Treat Res. 2009;148:43–66. doi: 10.1007/978-0-387-79962-9_4. [DOI] [PubMed] [Google Scholar]
- 40.Brownstein C., Deora A.B., Jacovina A.T., Weintraub R., Gertler M., Khan K.M., Falcone D.J., Hajjar K.A. Annexin II mediates plasminogen-dependent matrix invasion by human monocytes: enhanced expression by macrophages. Blood. 2004;103:317–324. doi: 10.1182/blood-2003-04-1304. [DOI] [PubMed] [Google Scholar]
- 41.Jin F.Y., Nathan C., Radzioch D., Ding A. Secretory leukocyte protease inhibitor: a macrophage product induced by and antagonistic to bacterial lipopolysaccharide. Cell. 1997;88:417–426. doi: 10.1016/s0092-8674(00)81880-2. [DOI] [PubMed] [Google Scholar]
- 42.Sawair F.A., Irwin C.R., Gordon D.J., Leonard A.G., Stephenson M., Napier S.S. Invasive front grading: reliability and usefulness in the management of oral squamous cell carcinoma. J Oral Pathol Med. 2003;32:1–9. doi: 10.1034/j.1600-0714.2003.00060.x. [DOI] [PubMed] [Google Scholar]
- 43.Mai J., Waisman D.M., Sloane B.F. Cell surface complex of cathepsin B/annexin II tetramer in malignant progression. Biochim Biophys Acta. 2000;1477:215–230. doi: 10.1016/s0167-4838(99)00274-5. [DOI] [PubMed] [Google Scholar]
- 44.Sharma M.R., Koltowski L., Ownbey R.T., Tuszynski G.P., Sharma M.C. Angiogenesis-associated protein annexin II in breast cancer: selective expression in invasive breast cancer and contribution to tumor invasion and progression. Exp Mol Pathol. 2006;81:146–156. doi: 10.1016/j.yexmp.2006.03.003. [DOI] [PubMed] [Google Scholar]
- 45.Singh P. Role of Annexin-II in GI cancers: interaction with gastrins/progastrins. Cancer Lett. 2007;252:19–35. doi: 10.1016/j.canlet.2006.11.012. [DOI] [PMC free article] [PubMed] [Google Scholar]
- 46.Dass K., Ahmad A., Azmi A.S., Sarkar S.H., Sarkar F.H. Evolving role of uPA/uPAR system in human cancers. Cancer Treat Rev. 2008;34:122–136. doi: 10.1016/j.ctrv.2007.10.005. [DOI] [PubMed] [Google Scholar]
- 47.Tang C.H., Wei Y. Cell Mol Life Sci. 2008. The urokinase receptor and integrins in cancer progression. [DOI] [PMC free article] [PubMed] [Google Scholar]
- 48.Miles L.A., Hawley S.B., Baik N., Andronicos N.M., Castellino F.J., Parmer R.J. Plasminogen receptors: the sine qua non of cell surface plasminogen activation. Front Biosci. 2005;10:1754–1762. doi: 10.2741/1658. [DOI] [PubMed] [Google Scholar]
- 49.Gonzalez-Gronow M., Kaczowka S., Gawdi G., Pizzo S.V. Dipeptidyl peptidase IV (DPP IV/CD26) is a cell-surface plasminogen receptor. Front Biosci. 2008;13:1610–1618. doi: 10.2741/2785. [DOI] [PubMed] [Google Scholar]
- 50.Esposito I., Penzel R., Chaib-Harrireche M., Barcena U., Bergmann F., Riedl S., Kayed H., Giese N., Kleeff J., Friess H., Schirmacher P. Tenascin C and annexin II expression in the process of pancreatic carcinogenesis. J Pathol. 2006;208:673–685. doi: 10.1002/path.1935. [DOI] [PubMed] [Google Scholar]
- 51.Moutsopoulos N.M., Wen J., Wahl S.M. TGF-beta and tumors: an ill-fated alliance. Curr Opin Immunol. 2008;20:234–240. doi: 10.1016/j.coi.2008.04.003. [DOI] [PMC free article] [PubMed] [Google Scholar]
- 52.Bindhu O.S., Ramadas K., Sebastian P., Pillai M.R. High expression levels of nuclear factor kappa B and gelatinases in the tumorigenesis of oral squamous cell carcinoma. Head Neck. 2006;28:916–925. doi: 10.1002/hed.20437. [DOI] [PubMed] [Google Scholar]
- 53.Kinugasa Y., Hatori M., Ito H., Kurihara Y., Ito D., Nagumo M. Inhibition of cyclooxygenase-2 suppresses invasiveness of oral squamous cell carcinoma cell lines via down-regulation of matrix metalloproteinase-2 and CD44. Clin Exp Metastasis. 2004;21:737–745. doi: 10.1007/s10585-005-1190-x. [DOI] [PubMed] [Google Scholar]
- 54.Devoogdt N., Revets H., Kindt A., Liu Y.Q., De Baetselier P., Ghassabeh G.H. The tumor-promoting effect of TNF-alpha involves the induction of secretory leukocyte protease inhibitor. J Immunol. 2006;177:8046–8052. doi: 10.4049/jimmunol.177.11.8046. [DOI] [PubMed] [Google Scholar]
- 55.Ace C.I., Okulicz W.C. Microarray profiling of progesterone-regulated endometrial genes during the rhesus monkey secretory phase. Reprod Biol Endocrinol. 2004;2:54. doi: 10.1186/1477-7827-2-54. [DOI] [PMC free article] [PubMed] [Google Scholar]
- 56.King A.E., Morgan K., Sallenave J.M., Kelly R.W. Differential regulation of secretory leukocyte protease inhibitor and elafin by progesterone. Biochem Biophys Res Commun. 2003;310:594–599. doi: 10.1016/j.bbrc.2003.08.151. [DOI] [PubMed] [Google Scholar]
- 57.Velarde M.C., Iruthayanathan M., Eason R.R., Zhang D., Simmen F.A., Simmen R.C. Progesterone receptor transactivation of the secretory leukocyte protease inhibitor gene in Ishikawa endometrial epithelial cells involves recruitment of Kruppel-like factor 9/basic transcription element binding protein-1. Endocrinology. 2006;147:1969–1978. doi: 10.1210/en.2005-1419. [DOI] [PubMed] [Google Scholar]
- 58.Termine N., Panzarella V., Falaschini S., Russo A., Matranga D., Lo Muzio L., Campisi G. HPV in oral squamous cell carcinoma vs head and neck squamous cell carcinoma biopsies: a meta-analysis (1988–2007) Ann Oncol. 2008;19:1681–1690. doi: 10.1093/annonc/mdn372. [DOI] [PubMed] [Google Scholar]
- 59.Monk B.J., Tewari K.S. The spectrum and clinical sequelae of human papillomavirus infection. Gynecol Oncol. 2007;107:S6–S13. doi: 10.1016/j.ygyno.2007.07.076. [DOI] [PubMed] [Google Scholar]
- 60.Fakioglu E., Wilson S.S., Mesquita P.M., Hazrati E., Cheshenko N., Blaho J.A., Herold B.C. Herpes simplex virus downregulates secretory leukocyte protease inhibitor: a novel immune evasion mechanism. J Virol. 2008;82:9337–9344. doi: 10.1128/JVI.00603-08. [DOI] [PMC free article] [PubMed] [Google Scholar]
- 61.Gupta G.P., Nguyen D.X., Chiang A.C., Bos P.D., Kim J.Y., Nadal C., Gomis R.R., Manova-Todorova K., Massague J. Mediators of vascular remodelling co-opted for sequential steps in lung metastasis. Nature. 2007;446:765–770. doi: 10.1038/nature05760. [DOI] [PubMed] [Google Scholar]