

Abstract
Autophagy is a regulated process that can be involved in the elimination of intracellular microorganisms and in antigen presentation. Some in vitro studies have shown an altered autophagic response in hepatitis C virus infected hepatocytes. The present study aimed at evaluating the autophagic process in the liver of chronic hepatitis C (CHC) patients. Fifty-six CHC patients and 47 control patients (8 with nonalcoholic steatohepatitis or alcoholic liver disease, 18 with chronic heptatitis B virus infection, and 21 with no or mild liver abnormalities at histological examination) were included. Autophagy was assessed by means of electron microscopy and microtubule-associated protein light chain 3 immunoblotting. Using light chain 3 immunoblotting, the form present on autophagic vesicle (light chain 3-II) was significantly higher in CHC patients than in controls (P < 0.05). Using quantitative electron microscopy analysis, the median number of autophagic vesicles observed in hepatocytes from CHC patients was sixfold higher than in overall controls (P < 0.001). In contrast, there was no difference between CHC patients and controls in the number of mature lysosomes with electron-dense contents arguing in favor of a lack of fusion between autophagosome and lysosome. Neither genotype nor viral load influenced the autophagy level. In conclusion, autophagy is altered in hepatocytes from CHC patients, likely due to a blockade of the last step of the autophagic process.
Autophagy is a major cellular pathway for the degradation of long-lived proteins, constituents of cytoplasm and organelles.1,2 During autophagy, double-membrane vesicles form to sequester part of the cytoplasm. These double-membrane vesicles, also known as autophagosomes, subsequently fuse with lysosomes to form autolysosomes for the degradation of their contents for recycling. Several gene products required for the formation of autophagosomes have been identified. Among them is microtubule-associated protein light chain 3 (LC3), whose covalent linkage to phosphatidylethanolamine is necessary for the formation of autophagosomes.1
Autophagy is emerging as a central component of antimicrobial host defense against diverse viral, bacterial, and parasitic infections. In addition to pathogen degradation, autophagy serves other functions during infection, such as innate and adaptive immune activation.3 As an important host defense pathway, microbes have also evolved mechanisms to evade, subvert, or exploit autophagy.3
Hepatitis C virus (HCV) is a major cause of chronic liver disease with 170 million people infected worldwide.4 Several recent in vitro studies have suggested that the autophagic pathway is involved in HCV replication in cultured cells.5–11 However, the relevance of such findings in vivo remains unknown because autophagy has never been assessed in chronic hepatitis C (CHC) patients.2,4
The aims of the present study were to evaluate the autophagic response in CHC patients, and to identify factors influencing the autophagy level in such patients.
Materials and Methods
Patients
Fifty-six untreated CHC patients who underwent liver biopsy between June 2003 and February 2010 were retrospectively analyzed. Electron microscopy, LC3 immunoblotting, lysosome-associated membrane protein 2 (LAMP2) immunoblotting and LC3 mRNA assessment were performed in 23, 15, 8, and 10 patients, respectively. All CHC patients had antibodies against HCV (AxSYM, Anti-HCV; Abbott, Chicago, IL) and detectable serum HCV RNA (transcription-mediated amplification; Bayer's Versant HCV RNA Qualitative Assay; Bayer Corp. Diagnostics Division, Tarrytown, NY). HCV genotyping was performed (sequencing) in all patients. None of these patients had the following conditions: excessive drinking (daily alcohol intake of ≥30 g in males and ≥20 g in female), positive hepatitis B surface antigen (as measured using Abbott Laboratories, Abbott Park, IL), HIV infection, autoimmune hepatitis, hemochromatosis, α1-antitrypsin deficiency, or Wilson's disease.
Clinical and Laboratory Assessment
The following data were collected at liver biopsy: sex, age, body weight (kg), and height (meters). Body mass index was calculated as weight divided by the square of the height (kg/m2). Overweight was defined as a body mass index ranging from 25 to 30 and obesity as a body mass index >30. After an overnight fast of 12 hours, venous blood was taken to determine serum levels of alanine aminotransferase, aspartate aminotransferase, γ-glutamyltransferase, triglyceride, cholesterol, and glucose.
Controls
Twenty-one patients with elevated serum aminotransferase and/or γ-glutamyltransferase level without markers of infection for hepatitis B or C viruses or for HIV and with no or mild abnormalities at liver histological examination were used as controls. Eight of them were controls for electron microscopy, five for LC3 immunoblotting, four for LAMP2 immunoblotting, and four for real-time quantitative RT-PCR. Three of the eight controls used for electron microscopy have been included in a previous study.12
Eighteen other patients with chronic heptatitis B virus (HBV) infection were also included as controls (seven for electron microscopy, six for LC3 immunoblotting, and five for LAMP2 immunoblotting). These patients had positive hepatitis B surface antigen, detectable serum HBV DNA (Bayer's Versant HBV DNA 3.0 Assay; Bayer Corp.), and were left untreated.
Finally, an additional eight patients with alcoholic liver disease (n = 5) or nonalcoholic steatohepatitis (n = 3) were also included (four for electron microscopy and four for LC3 immunoblotting).
No CHC or control patient had clinical evidence of hepatic decompensation. All patients gave their informed consent before liver biopsy. The study conformed to the ethical guidelines of the 1975 Declaration of Helsinki.
Histology
Tissue specimens from all CHC patients and controls were fixed in formalin-fixed, paraffin-embedded tissue. Sections (5 mm-thick) were cut from paraffin blocks and stained with H&E, Mallory trichrome, Picrosirius red, and Perls. Liver biopsy specimens were analyzed by a single experienced pathologist (DCH) who was blinded to the clinical and laboratory data. Necroinflammation and fibrosis were assessed using the METAVIR score.13 Necroinflammation activity (A) was graded as A0 (absent), A1 (mild), A2 (moderate), or A3 (severe). Fibrosis stage (F) was scored as F0 (absent), F1 (portal fibrosis), F2 (portal fibrosis with few septa), F3 (septal fibrosis), and F4 (cirrhosis). Steatosis was assessed as the percentage of hepatocytes containing macrovesicular fat droplets.
Transmission Electron Microscopy
Part of the liver specimen from 23 CHC patients and 19 controls in the study population was fixed in a 2% solution of glutaraldehyde buffered with 0.2 mol/L cacodylate and postfixed in osmium tetroxide before embedding in epoxy resin for electron microscopy. Ultra-thin sections stained with uranyl acetate and lead citrate were examined with an electron microscope JEOL 10 10 (JEOL Ltd., Tokyo, Japan). For morphometric analysis, a minimum of 10 random fields per patient were taken and examined in blinded manner at ×20,000 (>333 μm2 per patient). Electron microscopy findings were assessed by two readers (GF and PER) unaware of clinical and laboratory data. The term autophagic vesicle refers to autophagosome or autolysosome.14
Western Blotting Analysis
Frozen liver biopsies were homogenized in a lysis buffer (50 mmol/L Tris-HCl, pH 7.2, 250 mmol/L NaCl, 0.1% NP-40, 2 mmol/L EDTA, 10% glycerol) containing protease inhibitor cocktail tablet (Roche Diagnostic, Mannheim, Germany). Homogenates were centrifuged at 12,000 × g for 5 minutes at 4°C. The supernatant was used to determine LC3 and LAMP2 protein. Total protein concentrations were quantified by the Bradford method.15 The sample was mixed with an equal volume of Laemmli buffer. Equal amounts of total protein were then subjected to sodium dodecyl sulfate–polyacrylamide gel electrophoresis. The proteins were blotted to a nitrocellulose membrane at 1 mA/cm2 for 1 hour in a semi-dry transfer system (transfer buffer: 25 mmol/L Tris, 190 mmol/L glycine, 20% methanol). To reduce nonspecific binding, the membrane was placed in 10% nonfat dry milk (in PBS, pH 7.2) overnight at 4°C. The membrane was incubated for 1 hour with specific antibodies that recognize LC3 (MBL International Corp., Woburn, MA) or LAMP2 (Santa Cruz Biotechnology). Blots were washed with 0.05% Tween-20 in PBS and incubated for 1 hour at room temperature with a secondary antibody (horseradish peroxidase-conjugated anti-rabbit IgG). Blots were washed again with 0.05% Tween-20 in PBS, and immunoreactivity was assessed using an enhanced Western blot detection system. The immunoreactive bands were quantified by video densitometry. Values were expressed as optic density.
RT-PCR
Total RNA was reversed transcribed before real-time PCR amplification.16 All of the PCR reactions were performed using the Light Cycler 480 Real-Time PCR System, and the LightCycler 480 SYBR Green I Master mix (Roche Diagnostics, Mannheim, Germany).
The precise amount of total RNA added to each reaction mix (based on optical density) and its quality (ie, lack of extensive degradation) are both difficult to assess. Therefore, we also quantified transcripts of two endogenous RNA control genes involved in two cellular metabolic pathways, namely PPIA (GenBank accession NM_021130) which encodes Homosapiens peptidylpropyl isomerase A, and TBP (GenBank accession NM_003194), which encodes the TATA box-binding protein (a component of the DNA-binding protein complex TFIID). Each sample was normalized on the basis of its TBP or PPIA content.
Results were expressed as the N-fold differences in target gene expression relative to the TBP or PPIA gene, and termed Ntarget, which was determined as Ntarget = 2ΔCpsample, where the ΔCp value of the sample was determined by substracting the average Cp value of the target gene from the average Cp value of the TBP or PPIA gene.
Primers for endogenous RNA controls and the two target genes were chosen with the assistance of the Oligo 5.0 computer program (National Biosciences, Plymouth, MN). We conducted searches in the dbEST and nr databases to confirm the total gene specificity of the nucleotide sequences chosen as primers, and the absence of single nucleotide polymorphisms. In particular, the primer pairs were selected to be unique in relation to the sequences of closely related family member genes or of the corresponding retropseudogenes. To avoid amplification of contaminating genomic DNA, if possible, one of the two primers was placed at the junction between two exons. In general, amplicons were between 70 and 120 nucleotides long. For each primer pair, no-template controland no-reverse transcriptase control (reverse transcriptase negative) assays were performed and produced negligible signals (usually >40 in Cp value), suggesting that primer dimer formation and genomic DNA contamination effects were negligible. The oligonucleotide primer sequences that were used are listed in Table 1. RNA extraction, cDNA synthesis, and PCR reactions have been previously described.16
Table 1.
Oligonucleotide Primer Sequences Used
| Symbol | Name | Oligonucleotide | Sequence |
|---|---|---|---|
| PPIA | Homosapiens peptidylpropyl isomerase A | Upper primer | 5′-GTCAACCCCACCGTGTTCTT–3′ |
| Lower primer | 5′-GGAACCCTTATAACCAAATCCTTTC-3′ | ||
| TBP | TATA Box binding protein | Upper primer | 5′-TGCACAGGAGCCAAGAGTGAA-3′ |
| Lower primer | 5′-CACATCACAGCTCCCCACCA-3′ | ||
| MAP1LC3A | Microtubule associated protein 1 light chain 3 alpha | Upper primer | 5′-GCCGACCGCTGTAAGGAGGTA-3′ |
| Lower primer | 5′-CACCCTTGTAGCGCTCGATGAT-3′ | ||
| MAP1LC3B (ATGF8) | Microtubule associated protein 1 light chain 3 beta | Upper primer | 5′-ACGGCATGGTGTGGGGATCT-3′ |
| Lower primer | 5′-CGGCGCACCTTCGAACAAA-3′ |
Statistical Analysis
Quantitative variables were expressed as median with range, and categorical variables as absolute and relative frequencies. Comparisons between groups of quantitative and qualitative variables were performed using the Mann-Whitney U-test and Fisher's exact test, respectively. Spearman correlation coefficient was used to test the correlation between the number of autophagic vesicles and the clinical and laboratory data. All tests were two-sided and used a significance level of 0.05. Statistical analyses were performed using SPSS 12.0 software (SPSS Inc., Chicago, IL).
Results
Patients' Characteristics
The characteristics of the 56 CHC patients are listed in Table 2. Forty-four patients (79%) were older than 40 years of age. Median (range) plasma levels of creatinine, albumin, and bilirubin were respectively 80 (52 to 103) μmol/L, 45 (26 to 53) g/L, and 15 (5 to 38) μmol/L. Median prothrombin time was 94% (72% to 110%).
Table 2.
Characteristics of CHC Patients with Electron Microscopy Analysis, LC3 Immunoblotting or LC3A and LC3B mRNA Assessment
| Patients with electron microscopy analysis (n = 23) | Patients with LC3 immunoblotting (n = 15) | Patients with LC3A and LC3B mRNA assessment (n = 10) | Patients with LAMP2 immunoblotting (n = 8) | |
|---|---|---|---|---|
| Sex (male) | 15 (65) | 11 (73) | 4 (40) | 5 (63) |
| Age (years) | 48 (23–74) | 48 (20–74) | 51 (33–66) | 57 (33–69) |
| Body mass index (kg/m2) | 24.7 (19.0–36.4) | 25.3 (17.3–34.8) | 24.7 (20.5–36.3) | Not available |
| Serum levels at liver biopsy | ||||
| AST (×ULN) | 1.7 (0.7–6.2) | 1.4 (0.7–7.1) | 2.1 (0.9–5.4) | 1.8 (0.8–2.7) |
| ALT (×ULN) | 2.2 (0.6–8.4) | 1.9 (0.8–9.4) | 2.7 (1.1–5.6) | 2.3 (1–4.3) |
| γ-GT (×ULN) | 1.5 (0.2–4.7) | 1.8 (0.4–5.9) | 1.8 (0.3–5.3) | Not available |
| Total cholesterol (mmol/L) | 4.7 (2.5–7.2) | 4.4 (2.9–6.5) | 4.5 (3.1–5.1) | Not available |
| Triglycerides (mmol/L) | 1.1 (0.4–3.7) | 0.9 (0.5–1.8) | 1.3 (0.5–1.8) | Not available |
| Glucose (mmol/L) | 5.5 (4.2–16.3) | 5.1 (3.4–7.2) | 5.0 (3.8–6.4) | Not available |
| HCV RNA (log) | 6.06 (4.94–7.77) | 6.39 (4.37–7.38) | 6.11 (5.79–7.17) | Not available |
| HCV genotype (1-2-3-4) | 10-2-7-4 | 11-2-1-1 | 5–0-5–0 | 5-0-1-0 (two not availables) |
| Histological analysis | ||||
| Activity grade | 0-9-11-3 | 0-9-5-1 | 0-6-3-1 | 1-5-2–0 |
| (METAVIR A0, A1, A2, A3) | ||||
| Fibrosis stage | 8-6-3-6 | 9-3-1-2 | 3-2-2-3 | 3-4-1–0 |
| (METAVIR F1, F2, F3, F4) | ||||
| Steatosis (% of hepatocytes) | 20 (0–40) | 10 (0–90) | 45 (0–75) | 15 (0–80) |
Data are median (range) or frequency (%).
Fibrosis stage (METAVIR): F0 (absent); F1 (portal fibrosis), F2 (portal fibrosis with few septa), F3 (septal fibrosis), F4 (cirrhosis).
Necroinflammation grade (METAVIR): A0 (absent), A1 (mild), A2 (moderate), A3 (severe).
For ALT level, upper limit of normal is 34 IU/L in women and 45 IU/L in men. For AST level, upper limit of normal is 31 IU/L in women and 35 IU/L in men. For γ-GT level, upper limit of normal is 38 UI/L in women and 55 UI/L in men.
γ-GT, γ-glutamyl transferase; ALT, alanine aminotransferase; AST, aspartate aminotransferase; CHC, chronic hepatitis C; LAMP2, lysosome-associated membrane protein 2; LC3, light chain 3; ULN, upper limit of normal.
According to the METAVIR score, necroinflammation was moderate to severe (A2 to A3) in 26 patients (46%). The fibrosis grade was significant (F2 to F4) in 33 patients (59%), among whom 11 patients had cirrhosis (F4). Steatosis was mild (5% to 30%) in 18 patients (32%) and moderate or severe (>30%) in 7 patients (13%).
The characteristics of the 47 controls are given in Table 3. In HBV-infected patients, the median viral load was 108 copies/mL (range, 0.9 × 10⁵ to 2.5 × 10⁹).
Table 3.
Characteristics of Control Patients
| Controls with no or mild abnormalities at liver histological examination (n = 21) | Alcoholic liver disease or NASH (n = 8) | Chronic hepatitis B patients (n = 18) | |
|---|---|---|---|
| Sex (male) | 12 (57) | 6 (75) | 14 (77) |
| Age (years) | 43 (20–68) | 45 (22–55) | 43 (22–73) |
| Serum levels at liver biopsy | |||
| AST (×ULN) | 1.0 (0.4–2.2) | 1.2 (0.8–3.0) | 1.4 (0.4–32.2) |
| ALT (×ULN) | 1.1 (0.2–3.4) | 1.0 (0.4–3.0) | 2.0 (0.5–40.5) |
| Serum γ-GT (×ULN) | 2.5 (0.3–14.7) | 1.5 (0.5–3.6) | 0.9 (0.3–5.8) |
| Total cholesterol (mmol/L) | Not available | Not available | 4.5 (3.3–6.2) |
| Triglyceride (mmol/L) | Not available | Not available | 0.9 (0.4–1.7) |
| Histological analysis | |||
| Inflammation | Absent, n = 20; mild, n = 1 | Absent, n = 4; mild, n = 4 | Activity grade (METAVIR): |
| A0, n = 1; A1, n = 9; A2, n = 7; A3, n = 1 | |||
| Fibrosis | Absent, n = 14; portal fibrosis, n = 7 | Absent, n = 3; portal fibrosis, n = 1; septal fibrosis, n = 1; cirrhosis, n = 3 | Fibrosis stage (METAVIR): F1, n = 9; F2, n = 3; F3, n = 3; F4, n = 3 |
| Steatosis (% of hepatocytes) | 5 (0–45) | 15 (0–80) | 0 (0–70) |
Data are median (range) or frequency (%).
Fibrosis stage (METAVIR): F0 (absent), F1 (portal fibrosis), F2 (portal fibrosis with few septa), F3 (septal fibrosis), F4 (cirrhosis).
Necroinflammation grade (METAVIR): A0 (absent), A1 (mild), A2 (moderate), A3 (severe).
For ALT level, upper limit of normal is 34 IU/L in women and 45 IU/L in men. For AST level, upper limit of normal is 31 IU/L in women and 35 IU/L in men. For γ-GT level, upper limit of normal is 38 UI/L in women and 55 UI/L in men.
γ-GT, γ-glutamyl transferase; ALT, alanine aminotransferase; AST, aspartate aminotransferase; ULN, upper limit of normal.
Autophagic Vesicles Accumulate in Hepatocytes from CHC Patients
Using LC3 immunoblotting, the level of LC3-II, was significantly higher in CHC patients than in controls, suggesting an increased autophagy level in CHC patients (Figure 1, A and B). Indeed, the conversion of the cytoplasmic form of LC3 (LC3-I) to its form conjugated with phosphatidylethanolamine and present on autophagic vesicles (LC3-II), reflects the autophagy level.17
Figure 1.
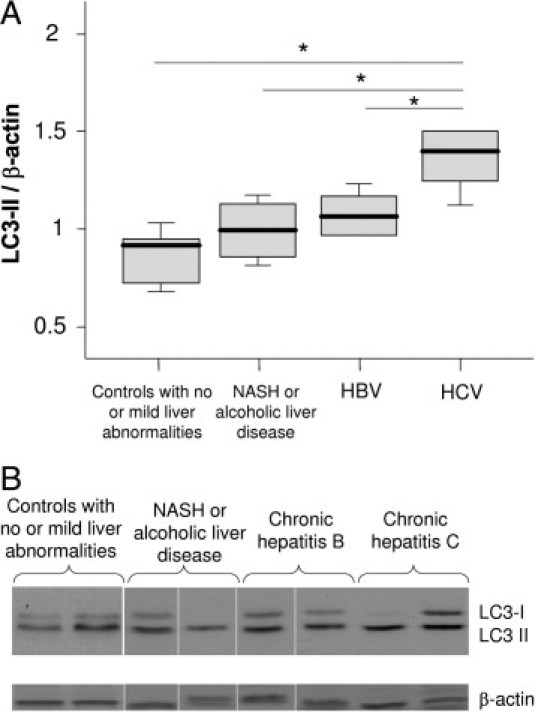
A: Immunoblots for LC3 in liver lysates obtained from controls with no or mild abnormalities at liver histological examination (n = 5), from patients with nonalcoholic steatohepatitis (NASH) or alcoholic liver disease (n = 4; no fibrosis, n = 3; septal fibrosis, n = 1), with chronic hepatitis B (n = 6; fibrosis stage according to the METAVIR score: F1, n = 4; F2, n = 1; F4, n = 1), and with chronic hepatitis C (n = 5; fibrosis stage according to METAVIR score: F1, n = 3; F2, n = 2). The protein expression was normalized with β-actin. Box plots represent median, quartiles, and ranges. *P < 0.05. Fibrosis stage (METAVIR): F0 (absent), F1 (portal fibrosis), F2 (portal fibrosis with few septa), F3 (septal fibrosis), F4 (cirrhosis). B: Representative LC3 immunoblots.
To confirm the accumulation of autophagosomes in the liver of CHC patients, we performed electron microscopy. Typical aspects of autophagic vesicles were observed in hepatocytes from CHC patients (Figure 2, A and B).Ultrastructural morphometry showed that the median number of autophagic vesicles was 6 times higher in the 23 CHC patients than in the 19 controls (Figure 3). In median, 36% (range, 10% to 82%) of hepatocytes in CHC patients contained autophagic vesicles, as compared with 16% (range, 0% to 55%) in overall controls (P < 0.001). In CHC patients, hepatocytes containing autophagic vesicles were often solitary, but were occasionally found in clusters of three to six hepatocytes (Figure 2C). There was no difference between the 23 CHC patients and the 19 controls in the number of mature lysosomes with electron-dense contents or the percentage of hepatocytes containing such mature lysosomes (P = 0.42 and P = 0.40, respectively; data not shown) suggesting an incomplete autophagic process. As a decrease in LAMP2 level, a major constituent of the lysosomal membrane, has been reported as inhibiting the last step of autophagy (ie, the fusion between autophagosome and lysosome), we assessed this protein in the liver of CHC patients and in controls.18 However, as shown in Figure 4, no significant difference was observed.
Figure 2.
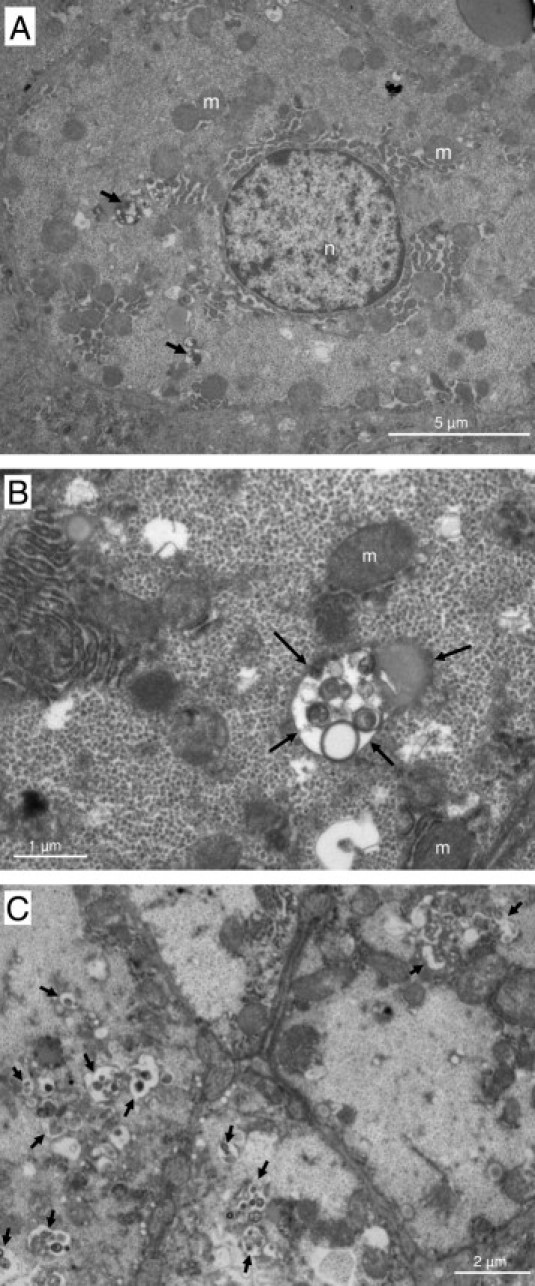
Electron micrographs showing ultrastructure of hepatocytes from chronic hepatitis C patients. Arrows point to autophagic vesicles. A: Low-magnification image showing a hepatocyte containing several autophagic vesicles (original magnification, ×6000). B: Partial view of a hepatocyte containing an autophagic vesicle (original magnification, ×20000). C: View of a cluster of hepatocytes containing autophagic vesicles (original magnification, ×8000). m, mitochondria; n, nucleus.
Figure 3.
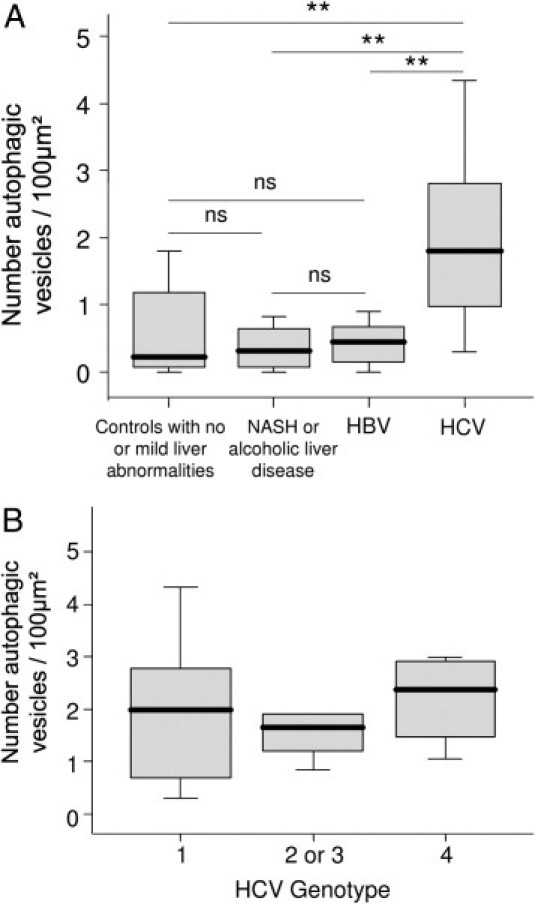
A: Quantitative assessment, using ultrastructural morphometry, of autophagic vesicles in hepatocytes from controls with no or mild abnormalities at liver histological examination (n = 8), patients with nonalcoholic steatohepatitis (NASH) or alcoholic liver disease (n = 4), chronic hepatitis B (n = 7), or chronic hepatitis C (n = 23). B: HCV genotype did not influence the number autophagic vesicles (n = 23). Box plots represent median, quartiles, and ranges. **P < 0.01. ns, not significant.
Figure 4.
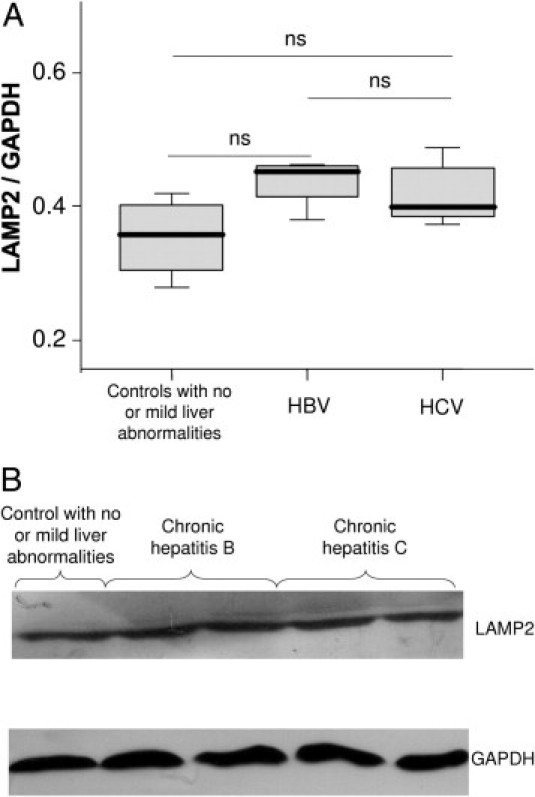
A: Immunoblots for lysosome-associated membrane protein 2 (LAMP2) in liver lysates obtained from controls with no or mild abnormalities at liver histological examination (n = 4), from patients with chronic hepatitis B (n = 5), and chronic hepatitis C (n = 8). The protein expression was normalized with glyceraldehyde-3-phosphate dehydrogenase (GAPDH). Box plots represent median, quartiles, and ranges. ns, not significant. B: Representative lysosome-associated membrane protein 2 (LAMP2) immunoblots.
As the induction of autophagy is sometimes accompanied by increased LC3 mRNA levels, RT-PCR was performed.17 However, there was no difference between CHC patients and controls with no or mild abnormalities at liver histological examination in MAP1LC3A mRNA levels [median MAP1LC3A/TBP level (range), 0.115 (0.02 to 0.40) versus 0.145 (0.09 to 0.18), respectively; P = 0.832] or MAP1LC3B mRNA levels [median MAP1LC3A/TBP level (range), 0.230 (0.05 to 0.81) versus 0.245 (0.16 to 0.60), respectively; P = 0.723]. Similar results were obtained with a second endogenous control, PPIA (data not shown).
The Number of Autophagic Vesicles Does Not Correlate with HCV Genotype or Viral Load
In the 23 CHC patients in whom electron microscopy analysis was performed, there were no significant correlations between the number of autophagic vesicles and the following variables: age, body mass index, serum aspartate aminotransferase, alanine aminotransferase, γ-glutamyl transferase, bilirubin, albumin, creatinine, triglyceride, cholesterol, prothrombin index, fibrosis stage, activity grade, or liver steatosis (data not shown). The number of autophagic vesicles correlated only weakly with fasting serum glucose (r = 0.494; P = 0.019). Neither did HCV RNA levels (r = −0.230; P = 0.344) nor HCV genotype (Figure 3B) influence the number of autophagic vesicles. Similarly, LC3-II level did not correlate with HCV RNA levels (r = −0.03; P = 0.934).
Discussion
This study shows an increased autophagic response in the liver of CHC patients as compared to a wide spectrum of controls, namely patients with no or mild liver abnormalities, patients with nonalcoholic steatohepatitis or alcoholic liver disease, and patients with chronic hepatitis B infection.
The present data have been obtained using two widely used and complementary approaches to autophagy: electron microscopy, which allows for identifying and quantifying autophagic vesicles, the hallmark of autophagy, at the cellular level; and LC3 immunoblotting, which is a more global approach, at the tissue level.17 The results of both approaches were consistent, showing an increase number of autophagic vesicles in the liver of CHC patients as compared to all types of controls evaluated. The number of autophagic vesicles did not correlate with HCV genotype or viral load.
To have an overview of the autophagic process, LC3 mRNA was also assessed in the present study, although its level most often does not significantly change when autophagy is induced.17 Therefore, the absent of increase in LC3 mRNA level observed here is not surprising and compatible with an increased autophagic response in CHC patients.
The accumulation of autophagic vesicles in the liver of CHC patients observed in the present series is in the line with the results of several recent in vitro studies using Huh 7.5 cells or immortalized human hepatocytes.5–11 In vitro, HCV induced autophagosome formation but was not able to enhance autophagic protein degradation suggesting an inefficient fusion between autophagosomes and lysosomes.2,6 The results of ultrastructural morphometry obtained in the present study could indirectly support this view. Indeed, in the liver of CHC patients, we observed a strong increase in the number of autophagic vesicles without augmentation in the number of mature lysosomes that could attest such a blockade of the last step of autophagy. Indeed, mature lysosomes are the final product of the autophagic process. However, we cannot provide a mechanism for this blockade. In particular, a decrease in the lysosomal membrane protein LAMP2, reported as a possible cause for autophagosome accumulation, was not observed in CHC patients in the present study.18 Performing confocal microscopy for assessing co-localization of HCV and autophagy proteins in the liver of CHC patients would be interesting. However, the low abundance of HCV proteins expressed within the liver, together with the nearly uniform presence of tissue autofluorescence in liver specimens, make a reliable detection of HCV in human liver tissue highly difficult.19
The present data show that the ability of HCV to increase autophagic vesicles is not limited to one HCV genotype. This is in accordance with data obtained in vitro showing induction of autophagic vesicles in cells harboring the genotype 2a HCV JFH1 strain, or the genotype 1b Con1 virus subgenomic RNA replicon.6–9 Another important finding in this study was the absence of influence of the viral load on the autophagy level, as assessed by means of LC3 immunoblotting or electron microscopy. In in vitro studies, knocking-down autophagy-related genes decreased HCV replication.6–9 Therefore, a correlation between the level of autophagy and the HCV viral load would have been expected. Several recent studies reconcile the results of in vitro and in vivo studies.7,10,11 Indeed, they show that autophagy proteins are required for translation and/or delivery of incoming HCV RNA to the cell translation apparatus.7 However, autophagy proteins are not needed for translation of progeny HCV once replication is established, because down-regulation of autophagy proteins 10 days after transduction had no effect on HCV replication.7,10,11 Therefore, autophagy proteins are required only for initial steps of HCV replication, but not once replication is established.
In the present study, autophagy level assessed both using electron microscopy and LC3 immunoblotting was not different between the three groups of control patients. In contrast, some studies performed in vitro or in animal models have suggested that autophagy is increased in HBV infection and decreased in alcoholic liver disease and nonalcoholic steatohepatitis.1,2 Dedicated studies are required to clarify this point. However, our results suggest that, if any, the difference in autophagy level between these groups of patients must be mild.
In conclusion, this study shows in vivo evidence for changes in the autophagic pathway in hepatocytes in CHC patients. Autophagic vesicles accumulate in hepatocytes independently of the HCV genotype. The absence of increased number of mature lysosome in CHC patients may be related to a lack of fusion between autophagosome and lysosome, supporting the view that the autophagic process is incomplete in HCV infection.
Acknowledgments
We thank Dr. Nathalie Boyer for her help in identifying patients, Sylvie Mosnier for expertise in electron microscopy, and Anne-Clémence Vion for Western blotting analysis.
Footnotes
Supported by a “poste d'accueil INSERM” (P.E.R.) and an Interface INSERM-AP-HP fellowship (R.M.).
References
- 1.Levine B., Kroemer G. Autophagy in the pathogenesis of disease. Cell. 2008;132:27–42. doi: 10.1016/j.cell.2007.12.018. [DOI] [PMC free article] [PubMed] [Google Scholar]
- 2.Rautou P.E., Mansouri A., Lebrec D., Durand F., Valla D., Moreau R. Autophagy in liver diseases. J Hepatol. 2010;53:1123–1134. doi: 10.1016/j.jhep.2010.07.006. [DOI] [PubMed] [Google Scholar]
- 3.Orvedahl A., Levine B. Eating the enemy within: autophagy in infectious diseases. Cell Death Differ. 2009;16:57–69. doi: 10.1038/cdd.2008.130. [DOI] [PMC free article] [PubMed] [Google Scholar]
- 4.Asselah T., Bieche I., Sabbagh A., Bedossa P., Moreau R., Valla D., Vidaud M., Marcellin P. Gene expression and hepatitis C virus infection. Gut. 2009;58:846–858. doi: 10.1136/gut.2008.166348. [DOI] [PMC free article] [PubMed] [Google Scholar]
- 5.Ait-Goughoulte M., Kanda T., Meyer K., Ryerse J.S., Ray R.B., Ray R. Hepatitis C virus genotype 1a growth and induction of autophagy. J Virol. 2008;82:2241–2249. doi: 10.1128/JVI.02093-07. [DOI] [PMC free article] [PubMed] [Google Scholar]
- 6.Sir D., Chen W.L., Choi J., Wakita T., Yen T.S., Ou J.H. Induction of incomplete autophagic response by hepatitis C virus via the unfolded protein response. Hepatology. 2008;48:1054–1061. doi: 10.1002/hep.22464. [DOI] [PMC free article] [PubMed] [Google Scholar]
- 7.Dreux M., Gastaminza P., Wieland S.F., Chisari F.V. The autophagy machinery is required to initiate hepatitis C virus replication. Proc Natl Acad Sci USA. 2009;106:14046–14051. doi: 10.1073/pnas.0907344106. [DOI] [PMC free article] [PubMed] [Google Scholar]
- 8.Mizui T., Yamashina S., Tanida I., Takei Y., Ueno T., Sakamoto N., Ikejima K., Kitamura T., Enomoto N., Sakai T., Kominami E., Watanabe S. Inhibition of hepatitis C virus replication by chloroquine targeting virus-associated autophagy. J Gastroenterol. 2010;45:195–203. doi: 10.1007/s00535-009-0132-9. [DOI] [PMC free article] [PubMed] [Google Scholar]
- 9.Tanida I., Fukasawa M., Ueno T., Kominami E., Wakita T., Hanada K. Knockdown of autophagy-related gene decreases the production of infectious hepatitis C virus particles. Autophagy. 2009;5:937–945. doi: 10.4161/auto.5.7.9243. [DOI] [PubMed] [Google Scholar]
- 10.Guevin C., Manna D., Belanger C., Konan K.V., Mak P., Labonte P. Autophagy protein ATG5 interacts transiently with the hepatitis C virus RNA polymerase (NS5B) early during infection. Virology. 2010;405:1–7. doi: 10.1016/j.virol.2010.05.032. [DOI] [PMC free article] [PubMed] [Google Scholar]
- 11.Ke P.Y., Chen S.S. Activation of the unfolded protein response and autophagy after hepatitis C virus infection suppresses innate antiviral immunity in vitro. J Clin Invest. 2011;121:37–56. doi: 10.1172/JCI41474. [DOI] [PMC free article] [PubMed] [Google Scholar]
- 12.Rautou P.E., Cazals-Hatem D., Moreau R., Francoz C., Feldmann G., Lebrec D., Ogier-Denis E., Bedossa P., Valla D., Durand F. Acute liver cell damage in patients with anorexia nervosa: a possible role of starvation-induced hepatocyte autophagy. Gastroenterology. 2008;135:840–848. doi: 10.1053/j.gastro.2008.05.055. [DOI] [PubMed] [Google Scholar]
- 13.Bedossa P., Poynard T. An algorithm for the grading of activity in chronic hepatitis C. The METAVIR Cooperative Study Group Hepatology. 1996;24:289–293. doi: 10.1002/hep.510240201. [DOI] [PubMed] [Google Scholar]
- 14.Eskelinen E.L. Maturation of autophagic vacuoles in Mammalian cells. Autophagy. 2005;1:1–10. doi: 10.4161/auto.1.1.1270. [DOI] [PubMed] [Google Scholar]
- 15.Bradford M.M. A rapid and sensitive method for the quantitation of microgram quantities of protein utilizing the principle of protein-dye binding. Anal Biochem. 1976;72:248–254. doi: 10.1016/0003-2697(76)90527-3. [DOI] [PubMed] [Google Scholar]
- 16.Asselah T., Bieche I., Laurendeau I., Paradis V., Vidaud D., Degott C., Martinot M., Bedossa P., Valla D., Vidaud M., Marcellin P. Liver gene expression signature of mild fibrosis in patients with chronic hepatitis C. Gastroenterology. 2005;129:2064–2075. doi: 10.1053/j.gastro.2005.09.010. [DOI] [PubMed] [Google Scholar]
- 17.Mizushima N., Yoshimori T., Levine B. Methods in mammalian autophagy research. Cell. 2010;140:313–326. doi: 10.1016/j.cell.2010.01.028. [DOI] [PMC free article] [PubMed] [Google Scholar]
- 18.Fortunato F., Burgers H., Bergmann F., Rieger P., Buchler M.W., Kroemer G., Werner J. Impaired autolysosome formation correlates with Lamp-2 depletion: role of apoptosis, autophagy, and necrosis in pancreatitis. Gastroenterology. 2009;137:350–360. doi: 10.1053/j.gastro.2009.04.003. [DOI] [PubMed] [Google Scholar]
- 19.Liang Y., Shilagard T., Xiao S.Y., Snyder N., Lau D., Cicalese L., Weiss H., Vargas G., Lemon S.M. Visualizing hepatitis C virus infections in human liver by two-photon microscopy. Gastroenterology. 2009;137:1448–1458. doi: 10.1053/j.gastro.2009.07.050. [DOI] [PubMed] [Google Scholar]