

Abstract
Redox-sensitive GFPs with engineered disulphide bonds have been used previously to monitor redox status in the cytosol and mitochondria of living cells. The usefulness of these redox probes depends on the reduction potential of the disulphide, with low values suiting the cytosol and mitochondrion, and higher values suiting the more oxidising environment of the endoplasmic reticulum (ER). Here, we targeted a modified redox-sensitive GFP (roGFP1-iL), with a relatively high reduction potential, to the ER of mammalian cells. We showed that the disulphide is partially oxidised, allowing roGFP1-iL to monitor changes in ER redox status. When cells were treated with puromycin, the redox balance became more reducing, suggesting that the release of nascent chains from ribosomes alters the ER redox balance. In addition, downregulating Ero1α prevented normal rapid recovery from dithiothreitol (DTT), whereas downregulating peroxiredoxin IV had no such effect. This result illustrates the contribution of the Ero1α oxidative pathway to ER redox balance. This first report of the use of roGFP to study the ER of mammalian cells demonstrates that roGFP1-iL can be used to monitor real-time changes to the redox status in individual living cells.
Key words: Redox monitoring, Disulphide formation, Live-cell imaging, Ero1, Peroxiredoxin IV
Introduction
The ability to monitor the redox status within live cells has become a reality over the past few years thanks to the development of redox-sensitive GFP molecules (roGFP) (Meyer and Dick, 2010). Formation of a disulphide bond alters the fluorescent properties of roGFP, resulting in a reciprocal change in the intensity of emission following excitation at two different wavelengths (Dooley et al., 2004). The ratio of emission intensities correlates with the changing redox state of roGFP. As the measurements are ratiometric, they are independent of expression levels and so can be used to gain an accurate measurement of redox status. Crucially, as the probes are non-invasive, changes to the redox status within individual mammalian cells can be followed by fluorescent microscopy (Gutscher et al., 2008). Such probes have been used to study redox conditions within the cytosol (Ostergaard et al., 2001) and mitochondria (Hanson et al., 2004; Hu et al., 2008), and at later stages of the secretory pathway (Austin et al., 2005). These initial studies used roGFP variants containing a disulphide with relatively low reduction potentials (Dooley et al., 2004), suited to the cytosol and mitochondria, and are, therefore, not able to monitor redox changes that occur within the more oxidising environment of the ER (Delic et al., 2010). However, recently, it has been established that a variant of roGFP (roGFP1-iL) with a redox potential much closer to that found within the ER lumen (Lohman and Remington, 2008) can be used to monitor the redox state within the ER. When roGFP1-iL was localised to the ER of yeast cells and the fluorescent properties of cell populations monitored using a standard fluorimeter, the probe was shown to be neither fully oxidised nor fully reduced, thereby ensuring its dynamic response to changes in redox status (Delic et al., 2010). These studies have paved the way for roGFP1-iL to be used in mammalian cells for real-time monitoring of changes to the ER redox status of individual live cells.
The ability to monitor redox changes in the ER would enable an evaluation of the role of low molecular weight thiols and oxidoreductases in regulating ER redox balance. Previous work on roGFP in vitro and in mammalian, yeast and plant cells indicates that it equilibrates with a glutathione buffer (Meyer and Dick, 2010). Other redox-active compounds, such as NADPH and ascorbate, and enzyme systems, such as thioredoxin and protein disulphide isomerase (PDI), do not affect the redox status of roGFP, at least in vitro (Meyer and Dick, 2010).
Changes to the ratio of reduced glutathione (GSH) to oxidized glutathione (GSSG) (GSH:GSSG) in the ER have been postulated to occur through the activity of oxidoreductases during disulphide bond formation (Chakravarthi et al., 2006). Introduction of disulphides into proteins occurs de novo by the action of sulphydryl oxidases such as Ero1α, Ero1β or quiescin sulphydryl oxidase, which couple disulphide formation to the reduction of oxygen to form hydrogen peroxide (Gross et al., 2006; Thorpe and Coppock, 2007). The hydrogen peroxide produced has recently been shown to be efficiently metabolised by the ER-localised enzyme peroxiredoxin IV (PrxIV) (Tavender and Bulleid, 2010a). This enzyme becomes oxidised by hydrogen peroxide and, in the process, forms a disulphide that can be reduced by members of the PDI family of oxidoreductases (Tavender et al., 2010). Members of the PDI family are efficient exchangers of disulphides and will become rapidly reduced by either GSH to form GSSG or by secretory proteins entering the ER lumen (Jessop and Bulleid, 2004). Hence, the pathway for disulphide formation is one mechanism by which the ratio of GSH:GSSG might change. In addition, several other less-well-characterised systems exist that might cause a change in the ER GSH:GSSG ratio. These systems include the reduction of dehydroascorbate by dithiol (Saaranen et al., 2010), as well as the oxidation of dithiol during the vitamin K cycle (Wajih et al., 2007; Schulman et al., 2010) and the production of hydrogen peroxide by the NADPH oxidase Nox4 (Van Buul et al., 2005). Any hydrogen peroxide produced following Nox4 activation can be metabolised by PrxIV, leading to the oxidation of dithiol. The relative contributions of each of these pathways to the ER GSH:GSSG balance are currently unknown. Hence, the development of simple probes that can measure changes following the modulation of each system would be an important advance.
To develop such a probe, we targeted the roGFP1-iL variant to the ER lumen and evaluated its use as a real-time monitor of changes in redox state. Using live-cell imaging, we demonstrated that this variant can be used as an efficient reporter of real-time changes to the ER redox state in individual cells. We tested the hypothesis that downregulating enzymes involved in forming disulphides de novo would affect the regulation of ER redox status. Our results show a dramatic effect on downregulation of Ero1α, highlighting its role in the generation of GSSG. The ability to monitor changes in ER redox status in real time will allow a variety of experiments to be considered, including the roles of individual systems in generating GSH or GSSG, as well as an evaluation of changes to ER redox status following cellular stress.
Results
Expression of roGFP1-1L in the mammalian ER
To establish a system to monitor redox changes in the ER of live mammalian cells, we fused roGFP1-iL at the N terminus with the signal peptide of the ER-resident protein ERp57 and at the C terminus with the ER retrieval sequence KDEL. The resulting roGFP1-iL–KDEL construct was stably transfected into HT1080 cells. The expressed roGFP was shown to colocalise with the ER-resident protein PDI following immunofluorescence microscopy, indicating that roGFP1-iL–KDEL was correctly targeted to the ER (Fig. 1A). To generate reduced or fully oxidised roGFP1-iL–KDEL, cells were treated with the membrane-permeable reagents DTT (dithiothreitol) or DPS (2,2′-dipyridyl disulphide), respectively. Further disulphide exchange was prevented by the addition of NEM (N-ethyl maleimide) prior to cell lysis. When the cell lysates were separated by non-reducing SDS-PAGE and roGFP1-iL–KDEL visualised by western blotting, three distinct species were separated (Fig. 1B, lanes 2–4). The fastest migrating species had a relative molecular weight corresponding to a monomer. The two slower migrating species had a relative molecular weight corresponding to dimers (Fig. 1B, lanes 2–4, highlighted with a single asterisk). All species were fully reduced when DTT was added to the samples prior to electrophoresis (Fig. 1B, lanes 6–8).
Fig. 1.

Expression and redox state of roGFP1-iL in the ER. (A) HT1080 roGFP1-iL–KDEL cells were fixed in methanol and immunostained with anti-GFP and anti-PDI. The cells were imaged by confocal laser scanning microscopy. Scale bar: 20 μm. (B) HT1080 cells expressing roGFP1-iL–KDEL were mock treated or treated with 10 mM DTT or with 1 mM DPS for 5 minutes (lanes 2–4, 6–8). Untransfected HT1080 cell lysates were included as a control (lanes 1 and 5). The cells were washed in PBS with 20 mM NEM, before lysis in the presence of 20 mM NEM. The lysates were analysed by reducing (R) (lanes 5–8) or non-reducing (NR) (lanes 1–4) SDS-PAGE and western blotting (WB) with anti-GFP. A single asterisk indicates roGFP dimers; a double asterisk indicates aggregates.
When GFP is targeted to the secretory pathway, it is known to form interchain disulphide-bonded dimers (Jain et al., 2001). There are two cysteines in GFP (C49 and C71) that can independently form interchain disulphides. The roGFP1-iL–KDEL contains a C49S mutation, but still contains C71 as well as the two introduced cysteines. The faster migrating of the two potential dimeric species is likely to be disulphide bonded through C71. This conclusion can be drawn from the fact that there is a difference in mobility between species isolated from cells treated with either DTT or DPS (Fig. 1B, lanes 3 and 4), indicating the breaking or formation, respectively, of an intrachain disulphide between the introduced cysteines. The slowest migrating species is either GFP with a disulphide between C71 and one of the introduced cysteines or a disulphide-bonded complex between roGFP1-iL–KDEL and another unidentified protein. Interestingly, the addition of DTT to cells has no effect on the amount of either slower migrating species (Fig. 1B, compare lanes 2 and 3), suggesting that any interchain disulphides formed are solvent inaccessible.
By contrast, the intrachain disulphide between the introduced cysteines is solvent accessible and responds to the addition of either reducing or oxidising agent. This is best illustrated with the monomeric species. Fully reduced monomer had a slightly slower mobility than the fully oxidised monomer (Fig. 1B, lanes 3 and 4). Non-treated cells contained a mix of reduced and oxidised monomeric roGFP1-iL (Fig. 1B, lane 2), demonstrating that, at steady state, roGFP1-iL–KDEL was neither fully reduced nor fully oxidised. Treating cells with DPS caused a reduction of the amount of monomeric species, possibly due to the formation of high molecular weight aggregates (Fig. 1B, see smear at top of gel, double asterisk, lane 4). Overall, these results show that roGFP1-iL–KDEL was localised to the ER and that the introduced cysteines formed an intrachain disulphide that has a redox balance that enables it to respond to both oxidising and reducing challenges.
Measuring real-time redox changes in the ER of living cells
Previously, it has been shown that oxidation of purified roGFP1-iL results in an increase in fluorescence intensity following excitation at 395 nm, with a concomitant decrease in intensity when excited at 465 nm (Lohman and Remington, 2008). We confirmed that the optimal excitation wavelengths were the same for roGFP-iL–KDEL expressed in cells as purified roGFP-iL (Lohman and Remington, 2008) by determining excitation spectra for live cells following treatment with a reducing or oxidising agent (supplementary material Fig. S1). In this case, the fluorescence emission at different excitation wavelengths was measured on cell populations using a 96-well plate reader. As with the purified protein, the increase in the 395:465 nm emission ratio reflects oxidation of the roGFP, whereas a decrease in ratio reflects reduction. These results demonstrate that roGFP1-iL–KDEL, present in live cells, responds to changes in redox status, validating its use as a redox probe.
To visualise ER redox changes in individual living cells, roGFP1-iL–KDEL-expressing cells were incubated in a perfusion chamber, excited sequentially at 405 and 465 nm, and images collected at the emission wavelength of 510 nm by fluorescent microscopy. The excitation wavelengths are close to the maximal excitation wavelengths of roGFP1-iL. An excitation wavelength of 405 nm was used instead of 395 nm because of the higher efficiency of the light source at 405 nm. The ratios of emissions (405:465 nm) were calculated and displayed as false-colour ratio images to indicate real-time changes in redox status (Fig. 2A,B). In addition, the ratios can be presented over time for individual cells selected from the field of view (Fig. 2C,D). Perfusion of cells with DPS resulted in a rapid 405:465 nm ratio increase (Fig. 2A,C), showing that roGFP became oxidised in living cells. The cells were able to recover only very slowly and had returned to approximately 50% of its steady-state ratio value 25 minutes after washout of DPS (data not shown). When cells were perfused with DTT, the ratio values rapidly decreased (Fig. 2B,D). In contrast to DPS, the cells recovered to steady-state ratio values within a few minutes upon removal of DTT. The dynamic range of roGFP-iL–KDEL, the difference in ratio values between fully oxidised and fully reduced, was between 4.5 and 5. Similar values were obtained for the dynamic range of purified recombinant roGFP1-iL immobilised on Ni-agarose beads using the same microscope set-up with the beads suspended in a drop of buffer on the microscope stage (data not shown). This range compares well with a maximal dynamic range of 7.2 measured with purified recombinant roGFP1-iL (Lohman and Remington, 2008) at the optimal excitation wavelengths, and a range of 3.5 for cytosol-localised roGFP1 measured as a cell suspension in a fluorimeter (Delic et al., 2010). Thus, the roGFP1-iL–KDEL can report changes to the redox status in the ER of individual living cells and in real time.
Fig. 2.

Real-time imaging of dynamic changes in ER redox state. (A,B) HT1080 roGFP1-iL–KDEL cells were imaged using live-cell microscopy. The cells were excited sequentially at 405 and 465 nm, with emission detected at 510 nm. After background subtraction, a false-colour ratio image was created by dividing the 405 nm image by the 465 nm image. The cells were treated with DPS (A) or DTT (B) as indicated. (C,D) Ratio traces of indicated selected cells from A and B (arrows), respectively.
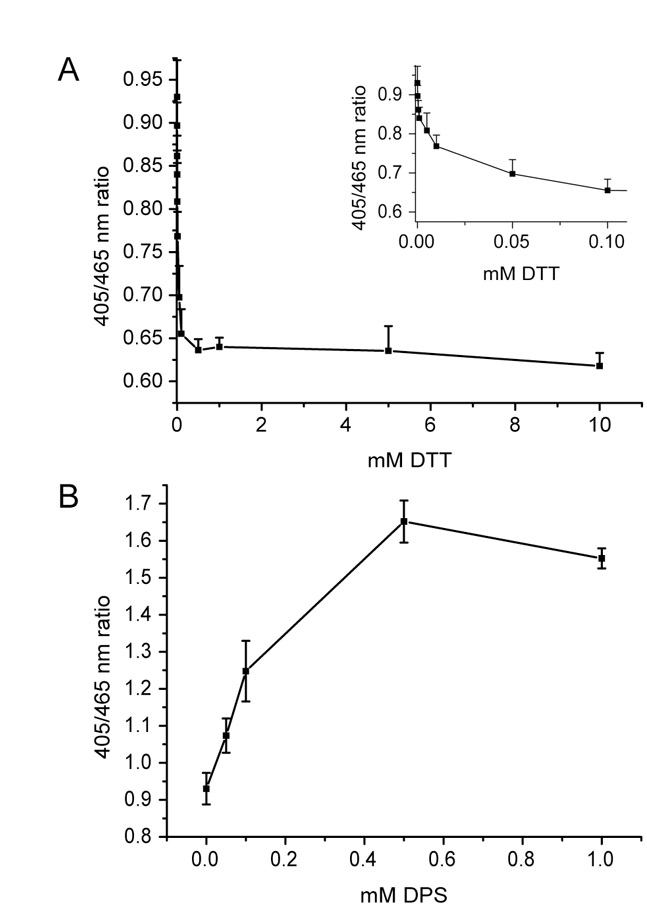
To further evaluate the effect of oxidising or reducing agent on the 405:465 nm ratio and to determine the sensitivity of roGFP-iL–KDEL in live cells, we carried out titrations of reagents in a 96-well plate and measured fluorescent ratios using a plate reader. The roGFP-iL–KDEL-expressing cells remained fully reduced at concentrations of DTT>0.1 mM (supplementary material Fig. S2A). Such concentrations of DTT are known to be required to prevent the formation of disulphides in newly synthesised proteins entering the secretory pathway (Chakravarthi and Bulleid, 2004), indicating that concentrations below 0.1 mM are buffered by the ER. Concentrations of DPS>0.5 mM were required to fully oxidise roGFP-iL–KDEL (supplementary material Fig. S2B). The higher concentration of DPS required to oxidise ER proteins reflects the reducing environment of the cell. High concentrations of cellular reduced glutathione would need to be quenched before the added oxidising agent could bring about an effect.
Light-induced roGFP1-iL–KDEL oxidation
During the course of these initial imaging experiments, we noticed that there was variation in the steady-state ratio of fluorescence between individual experiments (compare Fig. 2C,D and see Fig. 3B). These variations might reflect genuine biological variation, such as differences in local cell density or cell-cycle phase, as both these parameters have been shown to affect the cellular redox status (Gutscher et al., 2008). In addition, we consistently saw an initial increase in the 405:465 nm ratio over the first few seconds of imaging. The ability to determine the redox status of cells at steady state was clearly compromised by this initial increase in ratio. To see whether illuminating the cells with light was having an effect on the 405:465 nm ratio, we illuminated the cells as previously described (250 ms every 5 seconds) for a total of 2 minutes and then closed the shutter, thereby deflecting the light source. Following closure for two minutes, the shutter was opened again and the 405:465 nm ratio recorded (Fig. 3A). Following two minutes in the dark, the cells recovered their initial steady-state ratio, but over the next 120 seconds the ratio increased to the same value as prior to the shutter being closed (Fig. 3A, 240–420 seconds). Thus, exposure of the cells to 405:465 nm light induced a reversible increase in the 405:465 nm ratio.
Fig. 3.
Light-induced oxidation of roGFP in living cells. HT1080 roGFP1-iL–KDEL cells were imaged and analysed as in Fig. 2. (A) After stabilisation of the ratio, the shutter was closed for 2 minutes. The shutter was opened again and the ratio was allowed to stabilise before perfusion with 10 mM DTT as indicated. While in DTT, the shutter was closed for 2 minutes and opened again. The cells were then treated with 1 mM DPS as indicated, followed by closing the shutter for 2 minutes and opening again. (B) Initially, the shutter was closed for 2 minutes and opened as in A. Next, the shutter was closed for 4 minutes. One minute before opening the shutter, 20 mM NEM was perfused over the cells. Bars below the traces indicate the times the shutter was closed. For one cell, the individual data points are shown. In A, dashed lines visualise ratio changes of the last data point before shutter closing and the first data point after shutter opening. In B, an additional dashed line joins the first data point following the dark period with and without NEM.
To further investigate the light-induced change to roGFP1-iL–KDEL, we determined whether the 405:465 nm ratio of the fully reduced or oxidised protein was affected by light. Cells were treated with DTT followed by shutter closure for two minutes before reopening. Cells were also treated with DPS, followed by shutter closing and reopening (Fig. 3A). For both DTT and DPS treatments, there was no change in the 405:465 nm ratio after the two-minute period in the dark. In the presence of DTT, the small amount of oxidation caused by illumination might be insufficient to cause a change in the redox status, whereas in the presence of DPS, the roGFP probe is already fully oxidised, thereby precluding further oxidation.
To demonstrate that light causes genuine oxidation of the ER, rather than being an intrinsic property of roGFP, we repeated the closing and opening of the shutter with non-treated cells as before (Fig. 3B, 0–380 seconds). The second time, the shutter was closed for 4 minutes and 20 mM NEM perfused over the cells 1 minute before opening the shutter. Now, no increase in 405:465 nm ratio was observed following light illumination, with the ratio being maintained at the same level following the initial dark period (Fig. 3B, 620 versus 240 seconds). NEM treatment freezes the redox status of roGFP1-iL–KDEL. The fact that no light-induced increase in the 405:465 nm ratio occurs following NEM treatment suggests that the ratio changes are due to an alteration in the redox status of roGFP. The 405:465 nm ratio following a 3 minute dark period and NEM treatment was identical to that seen immediately following a 2 minute dark period (Fig. 3B, dashed line). This result shows that the ER redox status fully recovers from the light-induced oxidation within 2 minutes in the dark. Hence, we were able to estimate the reduction potential of the ER to be −231±1.87 mV, based on the 405:465 ratio immediately following a 2 minute dark period. The amount of roGFP in a reduced form at steady state using this approach equates to approximately 58%. Finally, we determined the 405:465 ratio of purified recombinant roGFP1-iL. When the 405:465 nm ratios were recorded, there was no light-induced increase (data not shown). As the light-induced changes to the ratio only occur in cells, the increase reflects a genuine alteration of the redox status of the ER following illumination. These redox changes are reversed rapidly in the dark, indicating that illumination induces a reversible change to the ER redox status.
Puromycin-mediated release of nascent chains induces rapid reduction of roGFP
Having established that cells expressing roGFP1-iL–KDEL were able to respond to extreme changes in ER redox status, we then assessed treatments that might cause a more subtle effect. Inhibition of the translocation of proteins across the ER membrane might well cause a change to ER redox status through a decrease in the presence of polypeptides containing free thiol groups. Cells were perfused with either the protein elongation inhibitor cycloheximide or puromycin, which causes the premature release of nascent polypeptides from the ribosome. The addition of cycloheximide had no dramatic effect on the 405:465 nm ratio (data not shown), suggesting that inhibiting translation by itself does not significantly affect the balance of GSH:GSSG in the ER lumen. When cells were treated with puromycin, no change in the 405:465 nm ratio occurred during the first ~40 seconds, but was then followed by a sharp decrease (Fig. 4). The redox status of the ER showed a steady but incomplete recovery. Puromycin causes the premature release of polypeptide chains from the ribosome (Azzam and Algranati, 1973). The effect of puromycin on the 405:465 nm ratio suggests that the sudden increase in the concentration of nascent polypeptides in the ER caused by their release from the ribosome resulted in a more reducing redox status.
Fig. 4.
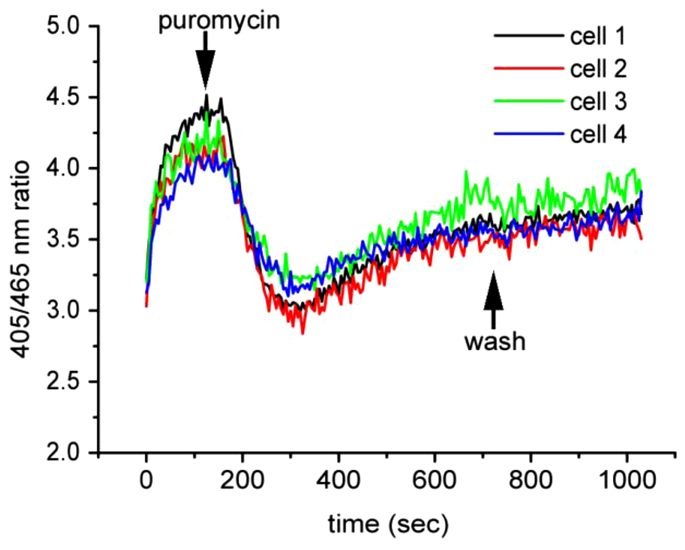
Inhibition of protein synthesis by puromycin rapidly causes the ER to become more reducing. HT1080 roGFP1-iL–KDEL cells were imaged and analysed as in Fig. 2. At 120 seconds, the cells were perfused with 1 mM puromycin followed by a washout of puromycin at 720 seconds.
Ero1α is essential for reoxidation of the ER after treatment with DTT
The formation of disulphide bonds in the mammalian ER is driven by at least two pathways involving the enzymes PrxIV and Ero1 (Tavender and Bulleid, 2010b; Tavender et al., 2010; Zito et al., 2010). Both these pathways are capable of affecting the ER redox status by causing the net oxidation of GSH. To determine the relative effects of PrxIV and Ero1α on redox homeostasis, we investigated the consequence of knocking down each enzyme on the steady-state redox status, as well as the ability of cells to recover from reduction following treatment with DTT. Stable cell lines expressing short hairpin RNA (shRNA) specific for PrxIV or Ero1 α were created, with each enzyme being reduced by between 85 and 95% (Fig. 5A,B). Comparison of the initial 405:465 nm ratios of control and shRNA-treated cells demonstrated that depleting either PrxIV or Ero1α had no significant effect on the steady-state redox status (Fig. 5C,D,E). In addition, there was no affect of the knockdown of Ero1α on the relative amounts of dimeric and monomeric roGFP-iL–KDEL (supplementary material Fig. S3).
Fig. 5.

Ero1α is essential for reoxidation after DTT challenge. (A) HT1080 cells stably transfected with a PrxIV shRNA construct were analysed for PrxIV expression by western blotting. The relative expression levels were determined by densitometry and corrected for tubulin levels. (B) HT1080 roGFP1-iL–KDEL cells stably transfected with scrambled or Ero1α shRNA constructs were analysed for Ero1α expression by western blotting. (C–E) Control (C), PrxIV (D) and Ero1α (E) shRNA cells were imaged and analysed as in Fig. 2. PrxIV shRNA cells were transiently transfected with roGFP1-iL–KDEL for 24 hours prior to image collection. The cells were treated with 10 mM DTT followed by a washout and 1 mM DPS, as indicated. Note that the traces for the PrxIV knockdown were derived from cells taken from two different experiments in which DPS was added at slightly different time points.
The ability of cells transfected with a scrambled shRNA to recover from treatment with DTT was similar to that of untreated cells (compare Fig. 2D and Fig. 5C). The 405:465 nm ratio dropped dramatically following DTT treatment, but upon removal of DTT fully recovered within 5 minutes. The cells were still sensitive to oxidation with DPS following the recovery period, demonstrating that the redox balance within the ER had been re-established. A very similar pattern of recovery from DTT treatment to that of the control cells was observed when the PrxIV-depleted cells were analysed (Fig. 5D). Recovery from DTT was seen within 5 minutes, suggesting that recovery is not compromised by the depletion of PrxIV. When the same experiment was carried out with the Ero1α-depleted cell line, the cells were fully reduced by treatment with DTT (Fig. 5E). However, the 405:465 nm ratio only barely recovered when DTT was removed. The cells still responded to oxidation with DPS, demonstrating that roGFP1-iL–KDEL still had the same dynamic range in these cells as in the controls. It should be noted that HT1080 cells contain barely detectable levels of Ero1β (results not shown). Hence, depletion of Ero1α severely compromised the ability to recover from treatment with DTT.
Discussion
The ability to monitor changes to intracellular conditions in live cells has been made possible by the development of reporter GFP molecules that change their fluorescence properties upon changes in calcium concentration (Zhang et al., 2002) or redox status (Meyer and Dick, 2010). Here, we show that one such modified GFP, roGFP1-iL–KDEL, can be used to monitor changes to the redox status within the ER of mammalian cells and is suited to real-time microscopy in living cells. This reporter monitors dynamic changes to the ER redox conditions, thereby allowing the effect of either specific reagents or modulation of the levels of individual proteins to be evaluated. The dynamic range of the reporter is sufficient to follow subtle changes in the ER redox status, as well as recovery from challenges with either reducing or oxidising agents. In contrast to the previously developed roGFP probe (roGFP2) used to study changes in redox status on the ER (Merksamer et al., 2008), roGFP1-iL–KDEL has a redox balance that allows more oxidising as well as more reducing changes to be monitored. The roGFP2 used previously is fully oxidised in the ER because of its more negative reduction potential than roGFP1-iL–KDEL. The disulphide bond within roGFP1 is thought to primarily equilibrate with the GSH:GSSG buffer within cells (Meyer and Dick, 2010). Hence, the ability to monitor the redox status of roGFP1-iL–KDEL provides a sensitive measurement of changes to the glutathione buffer within the ER.
The value of this approach lies in the ability to measure real-time changes in ER redox homeostasis, rather than accurately determining the reduction potential within the ER. Any absolute measurements of the steady-state redox status have to take into account the variability between different cells and experiments, as well as redox changes induced by light illumination. The variability between individual cells can be explained simply by changes to the redox status during the cell cycle, differences in cell density and differences between experiments caused by subtle changes to the culture conditions (Gutscher et al., 2008). The light-induced changes that we consistently observed were clearly not a consequence of an intrinsic property of the roGFP, as no such effect was seen with purified protein. No such light-induced changes were seen previously when roGFP2 was targeted to the cytosol, suggesting that it could be an ER-specific phenomenon. Alternatively, there might be differences in the level of sample illumination between previous studies and those reported here. The light-induced oxidation of roGFP1-il–KDEL could be due to the photo-oxidation of flavoproteins such as Ero1α, Ero1β, quiescin sulphydryl oxidase or ERFAD (ER flavoprotein associated with degradation) (Riemer et al., 2009). It should be noted, however, that photo-oxidation of Ero1α alone is unlikely to explain the phenomenon, because cells depleted of this protein still showed light-induced oxidation within the first few seconds of illumination (Fig. 5D). It is of interest to note that, following the initial light-induced oxidation, in all experiments carried out the redox equilibrium is re-established with no further changes occurring despite the continued illumination. In addition, the original redox status was re-established rapidly following a brief period in the dark. This observation is in contrast to the recovery following oxidation with DPS and suggests that the ER has the capacity to balance mild oxidative stress. Although the exact reasons behind the light-induced effect are not known, it does highlight the ability of the roGFP1-iL–KDEL to respond to subtle changes in redox status and demonstrates reduction of the probe following oxidation.
The response to the addition of DTT or DPS to cells was rapid, and resulted in a consistent difference between fully reduced and fully oxidised 405:465 nm ratio for all cells tested. Removal of DTT resulted in the recovery of the redox homeostasis after approximately 5 minutes. When recovery from DTT treatment was measured by directly determining the cellular GSSG:total cellular glutathione ratio, a similar time course of recovery was observed (Appenzeller-Herzog et al., 2010). DTT treatment of cells will reduce all solvent-exposed disulphides, as well as prevent the formation of disulphides in newly synthesised proteins. Recovery from DTT will require the formation of disulphide bonds by either Ero1 or other Ero1-independent pathways, such as the PrxIV-driven oxidation of PDI (Tavender et al., 2010). In addition, Ero1 can directly metabolise DTT (Baker et al., 2008), potentially accelerating the recovery. We show that the recovery from DTT is severely affected by Ero1α depletion, highlighting the crucial role played by this enzyme in this recovery. Such a dramatic effect on the rate of recovery of cells from DTT in cells deficient in Ero1α and Ero1β was not seen previously when the ratio of GSSG:total glutathione was measured directly (Appenzeller-Herzog et al., 2010). However, recovery of the redox status of ER proteins such as members of the PDI family was compromised following Ero1 depletion. These discrepancies might simply reflect differences in the approaches taken; roGFP1-iL–KDEL will report changes specific to the ER, whereas the GSSG:total glutathione ratio could change if GSSG was produced in a non-ER compartment following DTT treatment. Clearly, further work needs to be carried out to clarify these issues. However, it was clear from our results that PrxIV depletion had no effect on the ability of cells to recover from treatment with DTT, suggesting that the presence of Ero1α is sufficient to affect the recovery.
Although the recovery of cells from DTT treatment was rapid and complete, the recovery from DPS was very slow and incomplete. The recovery from oxidation of roGFP targeted to the cytosol does occur and is sensitive to inhibition of thioredoxin reductase (Dooley et al., 2004). The cytosol contains several pathways to ensure that the reducing environment is maintained, including the glutathione and thioredoxin reductase pathways. No equivalent reductive pathway has been characterised in the ER, so it is an open question as to whether one exists. Less drastic oxidative stress than DPS treatment could be provided by the production of glutathione disulphide under normal physiological conditions by the reduction of PDI family members by GSH (Chakravarthi and Bulleid, 2004; Jessop and Bulleid, 2004; Molteni et al., 2004). The absence of an ER-localised glutathione reductase would suggest that the reduction of any GSSG produced might occur following transfer to the cytosol or by direct oxidation of polypeptides as they enter the ER lumen. The direct oxidation of newly synthesised secretory proteins by GSSG is supported by the observations that several ER proteins are glutathionylated (Fratelli et al., 2002) and that a significant amount of the ER glutathione is present as mixed disulphides with proteins (Bass et al., 2004). However, it remains a possibility that an ER-localised glutathione transporter could shuttle GSSG into the cytosol for reduction.
The ability of roGFP1-iL–KDEL to respond to subtle changes in ER redox status was exemplified by the response to puromycin. A decrease in the 405:465 ratio occurred, indicating a shift to a more reducing environment. The release of nascent chains from the ribosome would result in a pulse of chains containing free thiols entering the ER lumen. These might well react with GSSG, resulting in an increase in the GSH:GSSG ratio. Such an effect would be short lived, with the redox balance being quickly restored. An alternative explanation for the release of nascent chains causing a shift in redox balance would be that the displacement of the membrane-associated ribosomes following puromycin treatment would allow leakage of small molecules through the Sec61 translocon. The leakage of the translocon to small molecules has been suggested previously (Le Gall et al., 2004), although other work has demonstrated that, whereas puromycin treatment of microsomes makes them permeable to small anions, they do not become permeable to GSH (Lizak et al., 2006). In contrast to the effect of puromycin, inhibiting protein synthesis with cycloheximide had little effect on the ER redox status. This result suggests that it is not inhibition of protein synthesis per se that affects redox status. Presumably the ER can adapt rapidly to a lack of reducing equivalents supplied by translocation of nascent chains.
In conclusion, we have demonstrated that modified forms of roGFP with a reduction potential more suited to the ER can be used to monitor changes to the ER redox status of individual cells in real time. The development of this probe will allow evaluation of both the function of individual proteins in regulating ER redox homeostasis and any changes that occur during cellular stress.
Materials and Methods
Constructs
The roGFP1-iL construct was a gift from Jim Remington (University of Oregon, OR). To direct ER expression, the roGFP-coding sequence was fused at the 5′ end with a nucleotide sequence encoding the ERp57 signal sequence and at the 3′ end with a KDEL-coding sequence by PCR. The resulting fusion fragment was cloned into the mammalian expression vector pcDNA3.1 (Invitrogen). The Ero1α and PrxIV shRNA constructs were from Origene.
Cell lines and antibodies
The human fibroblast cell line HT1080 was maintained in DMEM supplemented with 2 mM glutamine, 100 U/ml penicillin, 100 μg/ml streptomycin (Invitrogen) and 10% fetal calf serum. HT1080 cells stably expressing ER-localised roGFP1-iL were generated by transfection with roGFP1-iL–KDEL and selection with 200 μg/ml hygromycin B (Roche). roGFP-positive colonies were identified by western blotting. For Ero1α knockdown experiments, HT1080 roGFP1-iL–KDEL cells were transfected with an Ero1α shRNA construct and selected with 1 μg/ml puromycin (InvivoGen). Colonies were screened for low Ero1α expression by western blotting. The cells were grown in medium without selection 24 hours prior to an experiment. The generation of the PrxIV shRNA knockdown cell line has been described previously (Tavender et al., 2008).
The Ero1α monoclonal antibody (mAb) 2G4 was a gift from Roberto Sitia (San Raffaele Scientific Institute, Italy) (Ronzoni et al., 2010). The sheep anti-GFP antiserum was a gift from Martin Lowe (University of Manchester, UK), rabbit anti-GFP from Santa Cruz and the TAT-1 anti-tubulin mAb was a gift from Keith Gull (University of Oxford, UK). The 1D3 mAb that recognises PDI has been described (Vaux et al., 1992).
Immunostaining
Subconfluent HT1080 roGFP1-iL–KDEL cells were grown on cover slips. The cells were washed twice with PBS followed by fixing in ice-cold methanol for 10 minutes. The cover slips were washed with PBS, blocked in 0.2% BSA and PBS for 30 minutes, and incubated with primary antibodies in 0.2% BSA for 1 hour. After washing twice with PBS, the cover slips were incubated with the relevant FITC (Sigma) and Texas Red (Abcam) secondary antibodies. The cells were washed twice with PBS before mounting on slides with Mowiol (Calbiochem) containing the anti-fading agent DABCO. The slides were analysed with a Zeiss laser-scanning microscope (LSM 5 Exciter).
SDS-PAGE and western blotting
The cells were washed once in PBS, followed by lysis in buffer (50 mM Tris-HCl pH 8.0, containing 1% Triton X100, 150 mM NaCl, 50 mM EDTA) supplemented with protease inhibitor cocktail (Roche) and 20 mM NEM. Nuclei and cell debris were removed by centrifugation (15,000 g). Samples were diluted in 2× SDS sample buffer with (reducing) or without (non-reducing) 50 mM DTT. After electrophoresis, proteins were transferred to LiCOR nitrocellulose membranes. After blocking in 8% milk in TBST, the membranes were incubated with primary antibodies, washed three times with TBST and incubated with secondary antibodies (LiCOR). After two washes with TBST, the membranes were scanned on an Odyssey IR imaging system (LiCOR).
DTT and DPS sensitivity and excitation spectra analysis
HT1080 and HT1080 roGFP1-iL–KDEL cells were grown to confluency in black-walled, clear-bottom 96-well plates (Greiner Bio-One). The cells were washed twice with HEPES buffer followed by treatment in triplicate with various concentrations of DTT and DPS in HEPES buffer. Fluorescence intensities were measured on a FlexStation II (Molecular Devices, Sunnydale, CA) with excitation at 405 or 465 nm and emission at 510 nm. The 405:465 nm ratios were determined after subtraction of background fluorescence measured with non-transfected HT1080 cells.
The excitation spectra of roGFP1-iL–KDEL in living cells were obtained on a FlexStation II as above, with an excitation range from 350 to 485 nm at 1 nm intervals.
Live-cell microscopy and image analysis
Cells grown on cover slips were rinsed with HEPES buffer (20 mM Hepes pH 7.4, containing 130 mM NaCl, 5 mM KCl, 1 mM CaCl2, 1 mM MgCl2, 10 mM D-glucose) and transferred to a microscope chamber where the cells were superfused (5 ml min−1) with HEPES buffer at room temperature. Reagents were superfused into the chamber through solenoid valves. A Nikon TE2000-E inverted microscope equipped with a 40× oil immersion Fluor lens (numerical aperture=1.3) was used to image the cells. Fluorescence excitation light was generated by an ultra high point intensity 103-Watt/2 Osram Hg Arc lamp (OptoSource, Cairn Research, Faversham, Kent, UK) coupled to a computer-controlled Optoscan monochromator (Cairn Research), which alternated the excitation wavelength between 405±7 and 465±7 nm. Fluorescence emission at 510 nm was detected using a high-resolution interline-transfer cooled digital CCD camera (Cool Snap-HQ, Roper Scientific/Photometrics, Tucson, AZ). MetaFluor (MF) imaging software (version 7.7.2; Molecular Devices, Sunnydale, CA) was used to control the monochromator and CCD camera, and to process the cell image data. Sequential 12 bit images (3×3 binning) were collected every 5 seconds and exposure to excitation light was 200–300 ms/image. Images were analysed with ImageJ software (http://rsb.info.nih.gov/ij/). After background subtraction and setting thresholds to avoid low signal ratio artefacts, false-colour ratio images were created by dividing the 405 nm image by the 465 nm image on a pixel per pixel basis. Alternatively, 405:465 nm ratios were determined from average intensities of regions of interest from background-subtracted images with similar results.
Reduction potential calculation
The reduction potential of the roGFP was determined essentially as described previously (Lohman and Remington, 2008; Meyer and Dick, 2010) using the 405:465 nm fluorescent ratios immediately following a 2 minute dark period. The following equations were used to first calculate the ratio of reduced to oxidised roGFP1-iL–KDEL:
 where F, Fox and Fred are the 405:465 nm fluorescence ratios at steady state, fully oxidised and fully reduced, respectively. Iox and Ired are the fluorescence intensities at 465 nm for the fully oxidised and fully reduced samples, respectively.
The reduction potential can then be calculated by substitution into the Nernst equation, where RT/nF has been evaluated at 298K:
 where Eo′ for roGFP1-iL–KDEL was taken to be −229 mV (Lohman and Remington, 2008). Values were calculated for 12 individual cells and an average given ±s.d.
Supplementary Material
Acknowledgments
We acknowledge all our colleagues who provided reagents for this work and in particular Jim Remington (University of Oregon). We also thank Francis Burton (University of Glasgow) for help and advice on image processing, and Adam Benham (University of Durham) for help with the Ero1α knockdowns. The work presented in this paper was supported by the Wellcome Trust (grant numbers 088053 and 070185) and the MRC (grant number G0900050). Deposited in PMC for release after 6 months.
Footnotes
Supplementary material available online at http://jcs.biologists.org/cgi/content/full/124/14/2349/DC1
References
- Appenzeller-Herzog C., Riemer J., Zito E., Chin K. T., Ron D., Spiess M., Ellgaard L. (2010). Disulphide production by Ero1alpha-PDI relay is rapid and effectively regulated. EMBO J. 29, 3318-3329 [DOI] [PMC free article] [PubMed] [Google Scholar]
- Austin C. D., Wen X., Gazzard L., Nelson C., Scheller R. H., Scales S. J. (2005). Oxidizing potential of endosomes and lysosomes limits intracellular cleavage of disulfide-based antibody-drug conjugates. Proc. Natl. Acad. Sci. USA 102, 17987-17992 [DOI] [PMC free article] [PubMed] [Google Scholar]
- Azzam M. E., Algranati I. D. (1973). Mechanism of puromycin action: fate of ribosomes after release of nascent protein chains from polysomes. Proc. Natl. Acad. Sci. USA 70, 3866-3869 [DOI] [PMC free article] [PubMed] [Google Scholar]
- Baker K. M., Chakravarthi S., Langton K. P., Sheppard A. M., Lu H., Bulleid N. J. (2008). Low reduction potential of Ero1alpha regulatory disulphides ensures tight control of substrate oxidation. EMBO J. 27, 2988-2997 [DOI] [PMC free article] [PubMed] [Google Scholar]
- Bass R., Ruddock L. W., Klappa P., Freedman R. B. (2004). A major fraction of endoplasmic reticulum-located glutathione is present as mixed disulfides with protein. J. Biol. Chem. 279, 5257-5262 [DOI] [PubMed] [Google Scholar]
- Chakravarthi S., Bulleid N. J. (2004). Glutathione is required to regulate the formation of native disulfide bonds within proteins entering the secretory pathway. J. Biol. Chem. 279, 39872-39879 [DOI] [PubMed] [Google Scholar]
- Chakravarthi S., Jessop C. E., Bulleid N. J. (2006). The role of glutathione in disulphide bond formation and endoplasmic-reticulum-generated oxidative stress. EMBO Rep. 7, 271-275 [DOI] [PMC free article] [PubMed] [Google Scholar]
- Delic M., Mattanovich D., Gasser B. (2010). Monitoring intracellular redox conditions in the endoplasmic reticulum of living yeasts. FEMS Microbiol. Lett. 306, 61-66 [DOI] [PubMed] [Google Scholar]
- Dooley C. T., Dore T. M., Hanson G. T., Jackson W. C., Remington S. J., Tsien R. Y. (2004). Imaging dynamic redox changes in mammalian cells with green fluorescent protein indicators. J. Biol. Chem. 279, 22284-22293 [DOI] [PubMed] [Google Scholar]
- Fratelli M., Demol H., Puype M., Casagrande S., Eberini I., Salmona M., Bonetto V., Mengozzi M., Duffieux F., Miclet E., et al. (2002). Identification by redox proteomics of glutathionylated proteins in oxidatively stressed human T lymphocytes. Proc. Natl. Acad. Sci. USA 99, 3505-3510 [DOI] [PMC free article] [PubMed] [Google Scholar]
- Gross E., Sevier C. S., Heldman N., Vitu E., Bentzur M., Kaiser C. A., Thorpe C., Fass D. (2006). Generating disulfides enzymatically: reaction products and electron acceptors of the endoplasmic reticulum thiol oxidase Ero1p. Proc. Natl. Acad. Sci. USA 103, 299-304 [DOI] [PMC free article] [PubMed] [Google Scholar]
- Gutscher M., Pauleau A. L., Marty L., Brach T., Wabnitz G. H., Samstag Y., Meyer A. J., Dick T. P. (2008). Real-time imaging of the intracellular glutathione redox potential. Nat. Methods 5, 553-559 [DOI] [PubMed] [Google Scholar]
- Hanson G. T., Aggeler R., Oglesbee D., Cannon M., Capaldi R. A., Tsien R. Y., Remington S. J. (2004). Investigating mitochondrial redox potential with redox-sensitive green fluorescent protein indicators. J. Biol. Chem. 279, 13044-13053 [DOI] [PubMed] [Google Scholar]
- Hu J., Dong L., Outten C. E. (2008). The redox environment in the mitochondrial intermembrane space is maintained separately from the cytosol and matrix. J. Biol. Chem. 283, 29126-29134 [DOI] [PMC free article] [PubMed] [Google Scholar]
- Jain R. K., Joyce P. B., Molinete M., Halban P. A., Gorr S. U. (2001). Oligomerization of green fluorescent protein in the secretory pathway of endocrine cells. Biochem. J. 360, 645-649 [DOI] [PMC free article] [PubMed] [Google Scholar]
- Jessop C. E., Bulleid N. J. (2004). Glutathione directly reduces an oxidoreductase in the endoplasmic reticulum of mammalian cells. J. Biol. Chem. 279, 55341-55347 [DOI] [PubMed] [Google Scholar]
- Le Gall S., Neuhof A., Rapoport T. (2004). The endoplasmic reticulum membrane is permeable to small molecules. Mol. Biol. Cell 15, 447-455 [DOI] [PMC free article] [PubMed] [Google Scholar]
- Lizak B., Czegle I., Csala M., Benedetti A., Mandl J., Banhegyi G. (2006). Translocon pores in the endoplasmic reticulum are permeable to small anions. Am. J. Physiol. Cell Physiol. 291, C511-C517 [DOI] [PubMed] [Google Scholar]
- Lohman J. R., Remington S. J. (2008). Development of a family of redox-sensitive green fluorescent protein indicators for use in relatively oxidizing subcellular environments. Biochemistry 47, 8678-8688 [DOI] [PubMed] [Google Scholar]
- Merksamer P. I., Trusina A., Papa F. R. (2008). Real-time redox measurements during endoplasmic reticulum stress reveal interlinked protein folding functions. Cell 135, 933-947 [DOI] [PMC free article] [PubMed] [Google Scholar]
- Meyer A. J., Dick T. P. (2010). Fluorescent protein-based redox probes. Antioxid. Redox Signal. 13, 621-650 [DOI] [PubMed] [Google Scholar]
- Molteni S. N., Fassio A., Ciriolo M. R., Filomeni G., Pasqualetto E., Fagioli C., Sitia R. (2004). Glutathione limits Ero1-dependent oxidation in the endoplasmic reticulum. J. Biol. Chem. 279, 32667-32673 [DOI] [PubMed] [Google Scholar]
- Ostergaard H., Henriksen A., Hansen F. G., Winther J. R. (2001). Shedding light on disulfide bond formation: engineering a redox switch in green fluorescent protein. EMBO J. 20, 5853-5862 [DOI] [PMC free article] [PubMed] [Google Scholar]
- Riemer J., Appenzeller-Herzog C., Johansson L., Bodenmiller B., Hartmann-Petersen R., Ellgaard L. (2009). A luminal flavoprotein in endoplasmic reticulum-associated degradation. Proc. Natl. Acad. Sci. USA 106, 14831-14836 [DOI] [PMC free article] [PubMed] [Google Scholar]
- Ronzoni R., Anelli T., Brunati M., Cortini M., Fagioli C., Sitia R. (2010). Pathogenesis of ER storage disorders: modulating Russell body biogenesis by altering proximal and distal quality control. Traffic 11, 947-957 [DOI] [PubMed] [Google Scholar]
- Saaranen M. J., Karala A. R., Lappi A. K., Ruddock L. W. (2010). The role of dehydroascorbate in disulfide bond formation. Antioxid. Redox Signal. 12, 15-25 [DOI] [PubMed] [Google Scholar]
- Schulman S., Wang B., Li W., Rapoport T. A. (2010). Vitamin K epoxide reductase prefers ER membrane-anchored thioredoxin-like redox partners. Proc. Natl. Acad. Sci. USA 107, 15027-15032 [DOI] [PMC free article] [PubMed] [Google Scholar]
- Tavender T. J., Bulleid N. J. (2010a). Peroxiredoxin IV protects cells from oxidative stress by removing H2O2 produced during disulphide formation. J. Cell Sci. 123, 2672-2679 [DOI] [PMC free article] [PubMed] [Google Scholar]
- Tavender T. J., Bulleid N. J. (2010b). Molecular mechanisms regulating oxidative activity of the ero1 family in the endoplasmic reticulum. Antioxid. Redox Signal. 13, 1177-1187 [DOI] [PubMed] [Google Scholar]
- Tavender T. J., Sheppard A. M., Bulleid N. J. (2008). Peroxiredoxin IV is an endoplasmic reticulum-localized enzyme forming oligomeric complexes in human cells. Biochem. J. 411, 191-199 [DOI] [PMC free article] [PubMed] [Google Scholar]
- Tavender T. J., Springate J. J., Bulleid N. J. (2010). Recycling of peroxiredoxin IV provides a novel pathway for disulphide formation in the endoplasmic reticulum. EMBO J. 29, 4185-4197 [DOI] [PMC free article] [PubMed] [Google Scholar]
- Thorpe C., Coppock D. L. (2007). Generating disulfides in multicellular organisms: emerging roles for a new flavoprotein family. J. Biol. Chem. 282, 13929-13933 [DOI] [PubMed] [Google Scholar]
- Van Buul J. D., Fernandez-Borja M., Anthony E. C., Hordijk P. L. (2005). Expression and localization of NOX2 and NOX4 in primary human endothelial cells. Antioxid. Redox Signal. 7, 308-317 [DOI] [PubMed] [Google Scholar]
- Vaux D., Tooze J., Fuller S. (1992). Identification by anti-idiotype antibodies of an intracellular membrane protein that recognizes a mammalian endoplasmic reticulum retention signal. Nature 360, 372 [DOI] [PubMed] [Google Scholar]
- Wajih N., Hutson S. M., Wallin R. (2007). Disulfide-dependent protein folding is linked to operation of the vitamin K cycle in the endoplasmic reticulum. A protein disulfide isomerase-VKORC1 redox enzyme complex appears to be responsible for vitamin K1 2,3-epoxide reduction. J. Biol. Chem. 282, 2626-2635 [DOI] [PubMed] [Google Scholar]
- Zhang J., Campbell R. E., Ting A. Y., Tsien R. Y. (2002). Creating new fluorescent probes for cell biology. Nat. Rev. Mol. Cell. Biol. 3, 906-918 [DOI] [PubMed] [Google Scholar]
- Zito E., Melo E. P., Yang Y., Wahlander Å., Neubert T., Ron D. (2010). Oxidative protein folding by an endoplasmic reticulum-localized peroxiredoxin. Mol. Cell. 40, 787-797 [DOI] [PMC free article] [PubMed] [Google Scholar]
Associated Data
This section collects any data citations, data availability statements, or supplementary materials included in this article.