

Abstract
Pharmacophore search is a key component of many drug discovery efforts. Pharmer is a new computational approach to pharmacophore search that scales with the breadth and complexity of the query, not the size of the compound library being screened. Two novel methods for organizing pharmacophore data, the Pharmer KDB-tree and Bloom fingerprints, enable Pharmer to perform an exact pharmacophore search of almost two million structures in less than a minute. In general, Pharmer is more than an order of magnitude faster than existing technologies. The complete source code is available under an open-source license at http://pharmer.sourceforge.net.
Introduction
The identification of novel leads is a major challenge in modern drug discovery. High-throughput screening (HTS), the physical screening of a large chemical compound library against a biological target, is an established technology for lead identification, but is limited by its expense and the quality and diversity of the screened compound library.1 Virtual screening, the computational identification of possible lead compounds, is a complementary technology to HTS.2 Virtual screening improves hit rates and reduces costs by generating small, highly-enriched subsets of compound libraries that are then physically screened.3
Pharmacophore search is an established and effective mechanism of virtual screening4-8 (for an excellent recent review see Leach et al.9). A pharmacophore describes the structural arrangement of the essential features of an interaction. Common pharmacophore features include hydrophobic, charged, or hydrogen bond features and may include additional information, such as the direction of hydrogen bonds. A pharmacophore query is defined by the spatial arrangement of features and a search radius around each feature. Automated tools can derive a pharmacophore query either from a known structure or a set of known ligands.9 Once an interaction pharmacophore has been elucidated, it is used to search a database of compounds for matches.
Most pharmacophore search technologies either use a fingerprint-based or an alignment-based approach. Fingerprint-based approaches are often used as a similarity metric10 and discretize the search space by assigning distances between sets of three or four11,12 pharmacophore features to a limited number of bins. Each bin is represented by a bit in a binary fingerprint. Once pharmacophore fingerprints have been computed for a compound database, querying a single compound for the presence of a specific pharmacophore is an efficient bitwise comparison. However, the discretization of the search space reduces the accuracy of the search, and queries do not automatically result in an alignment to the query pharmacophore. Alternatively, FLAP fingerprints13 represent the rounded distances of a four point pharmacophore directly, resulting in a less discretized representation that is less efficient to query.
Alignment-based approaches align each database compound against the pharmacophore query resulting in more accurate and structurally meaningful results, but at the cost of more computation.5,14,15 If the compound database does not contain explicit conformations, a flexible pharmacophore alignment must be performed for an additional computational cost.16 The resulting pharmacophore alignment should exactly match the specifications of the query and the resulting poses can serve as starting points for docking and scoring.
Most pharmacophore search implementations must query all compounds in the database and, as a result, their computational performance is directly proportional to the size of the database. Two noteworthy exceptions are inverted-key fingerprint screening17 and Recore.18 Inverted-key search requires a highly reduced and discretized search space so that search features can be represented by a small set of keys. Recore is limited to the scaffold hopping domain and stores pharmacophore features relative to the exit vectors of potential scaffolds in a spatial index, a data structure that supports the efficient storage and retrieval of data indexed by spatial coordinates.
In this paper we describe Pharmer, a new computational approach to pharmacophore search that scales with the breadth and complexity of the query, not the size of the database, and returns all matching compounds aligned to the query pharmacophore. Pharmer is inspired by, but distinct from, two object recognition methods from computer vision: geometric hashing19 and the generalized Hough transform.20 By adapting these methods to pharmacophore search and through the use of the novel Pharmer KDB-tree data structure, Pharmer is capable of searching a library of millions of structures for a specific pharmacophore in seconds, unlocking new applications for pharmacophore search.
Methods
Pharmer stores the pharmacophore features of virtual library compounds using a novel database organization that supports efficient queries. A compound pharmacophore is decomposed into coordinate-frame independent triangles that are stored as exact coordinates in a spatial index. A query pharmacophore is similarly decomposed into triangles and the results of range queries on the spatial index are reconstructed into an alignment of virtual compounds to the query pharmacophore. A novel Bloom filter21 approach for representing molecular fingerprints is used to improve the scalability of the search.
Database Construction
Pharmacophore Feature Perception
Pharmacophore features are identified using user-configurable SMARTS22 expressions. The coordinates of a feature are determined by averaging the coordinates of all atoms matched by the SMARTS expression. Optionally, features of the same type may be clustered in order to combine spatially close features. More complex pharmacophore identification routines can easily be implemented programmatically.
A default set of pharmacophore features includes expressions to match hydrogen bond donors and acceptors, positive and negative ions, aromatic rings, and hydrophobic regions. Hydrophobic features contained within a distance of 2Å are combined into a single feature. This clustering greatly simplifies the formulation of SMARTS expressions for certain hydrophobic nonplanar polycyclic functional groups: simple SMARTS expressions recognize the sub-cycles of the group and then the resulting features are combined into a single feature representing the entire functional group.
Pharmacophore Representation
After identifying the pharmacophore features of a library compound, as shown in Figure 1, all possible triangles between these features are enumerated. Together with the point correspondence, these triangles define the spatial relationship between the pharmacophore features independent of a coordinate-frame. The three lengths of each triangle, once sorted into a canonical order, define a unique point in 3-space. In Pharmer, these exact values are used to store meta-data associated with this triangle and molecule in a spatial index. The meta-data includes the length values, the point correspondences for each vertex, the original Cartesian coordinates of each vertex, molecular data such as molecular weight and the number of rotatable bonds, and a Bloom fingerprint that represents the complete pharmacophore. All of this data can be stored in a single 64 byte Triplet-Data structure, the layout of which is shown in Table 1. Coordinates and lengths are rounded to fit within 16 bits. Since the lengths between points are stored, two feature coordinates can be stored as spherical coordinates relative to the first coordinate, requiring the storage of only two values, θ and ϕ angles, for these features. A few bits are reserved for feature-specific meta-data. These may be used to store the size, charge, or directionality of a feature.
Figure 1.
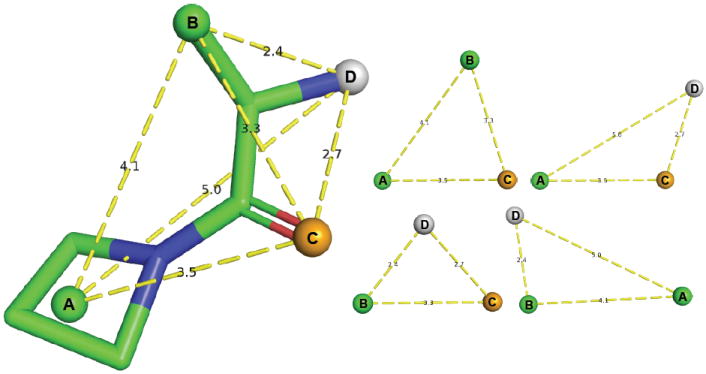
Pharmacophore features (spheres) are identified in library compounds using user-configurable SMARTs expressions. The collection of compound features is decomposed into coordinate-frame independent triangles. These triangles, along with associated molecular data including a Bloom fingerprint, are stored in a spatial index using a canonical ordering of the three lengths of the triangle.
Table 1.
The layout of the TripletData structure.
| Data | Size (bits) | Description |
|---|---|---|
| molPtr | 40 | location of full molecule |
| i1 | 8 | index of first feature |
| i2 | 8 | index of second feature |
| i3 | 8 | index of third feature |
| l1 | 16 | length of first triangle side |
| l2 | 16 | length of second triangle side |
| l3 | 16 | length of third triangle side |
| x | 16 | x-coordinate of first feature |
| y | 16 | y-coordinate of first feature |
| z | 16 | z-coordinate of first feature |
| theta2 | 16 | θ angle of spherical coordinate of second feature |
| phi2 | 16 | ϕ angle of spherical coordinate of second feature |
| theta3 | 16 | θ angle of spherical coordinate of third feature |
| phi3 | 16 | ϕ angle of spherical coordinate of third feature |
| extra1 | 6 | meta-data for first feature |
| extra2 | 6 | meta-data for second feature |
| extra3 | 6 | meta-data for third feature |
| Weight | 10 | molecular weight (rounded) |
| nrot | 4 | number of rotatable bonds |
| fingerprint | 256 | Bloom fingerprint |
|
| ||
| Total | 512 | 64 bytes |
Spatial Index
A spatial index is a data structure that supports the efficient storage and retrieval of data indexed by spatial coordinates. The spatial index used by Pharmer is a variant of a balanced KDB-tree.23 This choice of data structure is particularly well suited for performing efficient range searches over point data that is stored on disk (a necessity with large virtual libraries). Each node in the KDB-tree represents a bounding box and is an ancestor to all points, in this case coordinates derived from triangle lengths, within the box. The immediate children of a node are determined by finding a cutting plane across the largest dimension of the bounding box that equally splits the points, resulting in a balanced structure with a guaranteed logarithmic depth. The tree structure is mapped onto sequential 8KB pages to maximize disk access performance. As a result, even in an index that contains billions of points, a single-point query incurs only a handful of input/output operations.
The Pharmer KDB-tree, an example of which is shown in Figure 2, is designed to efficiently support range queries, which search for all points within a specified bounding box or more complex spatial volume. In contrast to a traditional KDB-tree, in Pharmer, each node stores an explicit bounding box to support accurate checking of range overlaps. The bounding box of each node is shrunk to exactly fit the underlying points, as shown in Figure 2(a). This is an adaption of the sliding-midpoint rule24 that results in a balanced tree with good range-query properties. For example, despite intersecting several cutting planes, the range query around point q in Figure 2 only traverses a single branch of the search tree since the embedded bounding boxes of the other branches do not overlap the query.
Figure 2.
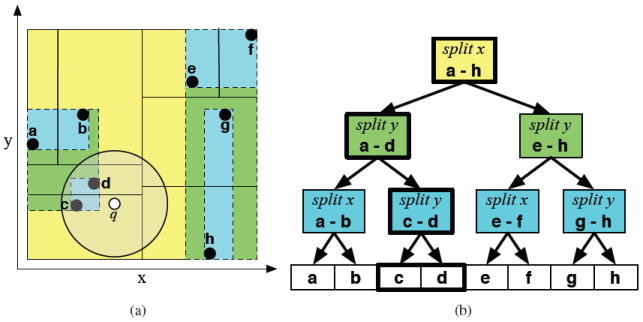
A simple 2D example of the Pharmer KDB-tree. (a) The area surrounding the point set is divided with cutting planes (solid lines) and bounding boxes (dashed lines) to form (b) a search tree. Because of the explicit bounding boxes, a range query around q (white point), despite intersecting several cutting planes, only need traverse a single branch of the tree, shown as thick-lined nodes in (b), and the search terminates early when it is determined that the points of node c-d are completely contained within the query range.
Additionally, the TripletData structures, the leaves of the tree, are laid out in a separate file that matches the hierarchy of the KDB-tree. This allows every node in the KDB-tree to contain a reference to the TripletDatas contained in its bounding box. Consequently, when performing range queries, when the bounding box of the tree node is contained within the query range, traversal of the KDB-tree can be short-circuited by a single sequential read of all the matching TripletDatas. For example, in Figure 2, the query would stop early at node c-d. In practice, we find that the performance of range queries is essentially proportional to the number of points returned, not to the size of the index.
Pharmer generates a separate spatial index for every possible triplet of pharmacophore features. For example, a triangle containing one hydrogen acceptor and two hydrophobic features (such as triangle ABC in Figure 1) would be stored in a separate index from a triangle containing one hydrogen donor and two hydrophobic features (such as triangle ABD).
Bloom Fingerprints
A Pharmer pharmacophore search decomposes a query into a set of triangles, performs range queries around these triangles according to the query tolerances, and assembles the results to find compounds that match all the triangles of the query. Since most queries are expected to have more than three points, it is desirable to quickly screen out any TripletDatas that belong to compounds with no hope of matching the remaining points of the query. To achieve this we developed Bloom fingerprints: a tetrahedral pharmacophore fingerprint stored in a multi-resolution Bloom filter.
A Bloom filter21 is a space-efficient probabilistic data structure for performing set membership testing. A set of k hash functions is used to set bits in a bit vector of size m. When testing membership, all k bits must be set in the bit vector. False negatives are never returned while false positives are returned with a probability that depends on k, m, and n, the number of elements stored in the filter. In Pharmer, every TripletData has a Bloom filter that stores the locations and and feature types of all the remaining pharmacophore features of the molecule. Very little space is required to store typical numbers of features with a high accuracy. For example, every TripletData of a molecule with 25 features will store 22 features in the Bloom fingerprint (omitting the three contained in the triangle itself). Using eight hash functions (each feature sets 8 bits) and a bit vector of 256 bits (32 bytes), the probability of a single query of the filter returning a false positive is approximately 0.43%.
As shown in Figure 3, each feature position is computed relative to the triangle of the Triplet-Data using the distances to the triangle vertices and a chirality bit. Only three distances are necessary to fully specify the geometry of the tetrahedron defined by the triangle of the TripletData and an additional point. Distances are discretized into bins to support querying with a search radius around a point. When searching, all sets of distances and chiralities that are feasible for the specified search radius of a point must be checked in the Bloom filter. A finer discretization more precisely stores locations, but results in a larger set of distances that must be checked against the filter. To reduce the overhead of querying the fingerprint, our Bloom fingerprints store points at multiple resolutions using different numbers of hash functions. For example, six hash functions may be used to store a point at a 4Å resolution (at lower resolutions there are fewer unique distances reducing the need for more hash functions) and eight hash functions to store the same point at a 1Å resolution. The Bloom fingerprint is first queried at the lowest resolution, and only if a positive is returned are the appropriate high resolution points checked.
Figure 3.

The generation of a Bloom fingerprint. (a) The position of pharmacophore features relative to a given triangle l1l2l3 are exactly represented using the distances to the triangle vertices (i.e., d1d2d3) and a chirality bit, which specifies which side of the plane defined by the triangle the point is in. (b) This positional information and the feature type of the point are provided to a set of k hash functions, in this case three, that set k bits in a bitvector, the Bloom filter.
Bloom fingerprints allow Pharmer to perform a spatial query of a single triplet of features while taking the entire context of a many-point pharmacophore query into account. The more features in a query, the more TripletDatas can be eliminated, improving the scalability of the search as the size of the query increases.
Database Search
A pharmacophore query is specified by a spatial arrangement of pharmacophore features each with a specified tolerance in the form of a search radius. An example pharmacophore query derived from a kinase inhibitor is shown in Figure 4(a). Pharmer decomposes a pharmacophore query into triplets of features, performs a range query in the appropriate spatial database for all triangles that can match a each triplet, assembles the results to generate all possible correspondences between the query and database compounds, and then uses these correspondences to produce compound poses that are aligned to the query.
Figure 4.
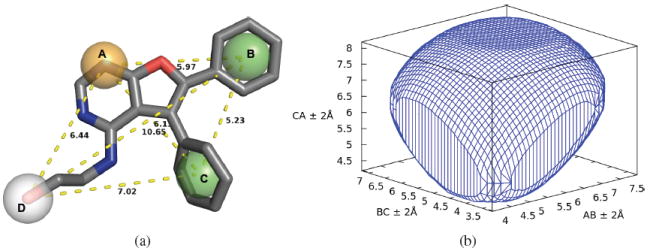
(a) A pharmacophore query derived from the kinase inhibitor of PDB 3K5U. A hydrogen acceptor (A, orange), two hydrophobic (B/C, green) and a hydrogen donor (D, white) feature were extracted by analyzing the crystal structure. Each feature is given a tolerance radius of 1.0Å. (b) The convex hull of the set of possible lengths for triangle ABC inscribed in its bounding box (lengths ± 2.0Å).
A query with n features has triplets of features. However, only n − 1 connected triplets are necessary to fully define a rigid mesh between these features. Pharmer uses a histogram generated during database creation to heuristically select a triplet that is expected to match the fewest number of compounds, and than greedily selects connecting triplets. A connecting triplet shares exactly two vertices with the previously selected triplet while the third vertex must be a feature that has not already been covered by a triplet. The final connecting triplet connects back to the first triplet. For example, in Figure 4(a), if the triplet ABC is chosen first, then Pharmer would select from (BCD,ACD,ABD) the triplet that, based on the database histogram, is expected to most aggressively filter the results. A final triplet connects back to the ABC to form a tetrahedron that fully defines the spatial relationship between the points.
Next, Pharmer performs a range query around each triplet to identify database compounds with matching three-feature pharmacophores. The triangle lengths of each triplet of features correspond to coordinates in the Pharmer spatial index. Due to the tolerance radius, the range of the query is constrained by a bounding box proportional to the tolerance radii. For example, the query of Figure 4(a) has a 1Å tolerance for each feature, resulting in a 4Å cubed bounding box that is centered around these coordinates. Since tolerances are specified as spheres around Cartesian coordinates, the actual shape, as shown in Figure 4(b), is more complex than a simple bounding box. Pharmer uses trigonometric identities to search within an easily computed approximation of this smaller shape, reducing the search overhead.
The range query identifies TripletDatas that match the geometric and feature constraints of a single query triplet. TripletDatas are further screened based on molecular metadata, such as molecular weight and rotatable bonds, and the Bloom fingerprint. Matches are stored in an active compound table. After the first query triplet has populated this table, all subsequent matches must correspond to an active compound. If no TripletDatas match an active compound, it is set to inactive. Successive TripletDatas must be compatible with a previously matched TripletData. Triplets are compatible if the connecting features of the query triplets match and the distance between the non-connected features is compatible with the query. For example, if the query triplet ABC matches a TripletData corresponding to features xyz of a database compound, then a successive TripletData matching query triplet DBC is compatible if it corresponds to features wyz of the same database compound and the distance between w and x is within the range specified by the query features A and D. As each of the n − 1 query triplets is processed, the number of active compounds is reduced.
After all query triplets are matched to the spatial index, the active compound table is populated with compounds that have one or more matched and compatible TripletDatas for each query triplet. Pharmer then recursively enumerates all possible legal correspondences between query features and compound features for each active compound. Each correspondence is then used to compute the pose that minimizes a radius-weighted root mean squared deviation (rwRMSD) between the database compound and the query:
where d(ci,qi) is the distance between the corresponding compound feature, ci, and query feature, qi, with tolerance radius ri. Each feature is weighted by the inverse of the tolerance radius. This weighted alignment prevents features with tight tolerances from shifting far from the desired location. Dual-number quaternions25 are used to efficiently compute the optimal pose. Only compound poses where all features remain within the query tolerances are retained.
Comparison to General Object Recognition
The Pharmer search method is related to, but distinct from, two object recognition methods in computer vision: geometric hashing19 and the generalized Hough transform.20 Geometric hashing represents a set of points in a coordinate-frame independent format by computing the orientation of the point set with respect to the coordinate systems defined by every possible triangulation of points. This requires the storage of items within the spatial index for every set of n points, a substantial increase relative to Pharmer. The generalized Hough transform decomposes a query object into all possible sets of triangles, performs a range query for each triangle, and uses a voting scheme to identify similar objects stored in the database. Since Pharmer identifies exact, as opposed to similar, matches, only n − 1 queries are necessary. Additionally, Pharmer utilizes pharmacophore-specific filtering mechanisms such as the Bloom fingerprint to accelerate the search performance.
Extensions
Pharmer efficiently and exactly matches a pharmacophore query specified as a spatial arrangement of features with tolerance spheres. The technology can be further extended to perform more sophisticated queries.
Optional Features
Optional feature matching is useful when implementing Boolean or counting query constraints or when using the number of pharmacophore matches as a scoring metric. A database compound does not need to match an optional feature to be returned as a hit. One approach to handling optional features is to simply enumerate all possible combinations of matched/unmatched optional features and run each combination as a separate query. For example, a query where at least two of three hydrogen bond features should match can be decomposed into separate queries.
An alternative, possibly more efficient, method for handling such optional features is to change the algorithm for constructing the rigid mesh of search triplets. First, a rigid mesh of the required features is constructed as before. Then any optional features are included in the mesh using two distinct triplets connected to the mesh of required features. These two triplets fully define the spatial relationship of the optional feature relative to the required features and independent of other optional features. Compounds that match both triplets are marked as potentially matching the optional feature and a failure to match either of the triplets does not remove a compound from the active compound table. Although this approach requires two range queries to the spatial index for each optional feature, there is no repetitive screening of required features.
Optional features can also be used to exclude specific features in a query. These features are treated just as optional features, but if an active compound matches such a feature, it is filtered out.
Directional Features
Some pharmacophore features, such as hydrogen bonds and aromatics, are directional. One method for incorporating directional features is to compute a projected point, which in itself is a new kind of feature. Since projected points are never searched for independently of the originating feature, only TripletDatas containing both the projected and originating points need be stored in the spatial index. For a compound with n features, this is the difference between storing n − 2 and TripletDatas.
An alternative to the projected points approach is to store a discretized vector representing the directionality of a feature as metadata within the TripletData. The vector is computed using the coordinate frame defined by the three points of the TripletData and then reduced to a small number representing a region of space. For instance, a 3-bit number could represent the eight Cartesian quadrants. This approach has the advantages of being more space and time efficient, but is less accurate. However, the calculated directionality is often itself an approximation. For example, the directionality of hydrogen bond features depends both on the nature of the ligand and the receptor, but during database construction must be computed using only information from the ligand. As a result, pharmacophore searches must specify a large tolerance on the directionality constraint, reducing the value of highly accurate directionality matching.
Volume Inclusion/Exclusion
Steric volume inclusion/exclusion constraints can be applied to the result poses as a post-processing step. Such constraints can also be integrated into the search algorithm. One approach is to include all heavy atom centers as their own pharmacophore feature type. Without modification, this may not scale well since the number of TripletDatas stored for each compound grows with the cube of the number of features. A more scalable, but approximate, approach is to generate only a few steric features per a compound that define a sketch of the molecular shape. These are then used as preliminary filters to eliminate some, but not all, of the undesirable compounds.
Results
The key contributions of Pharmer are novel computational methods for organizing pharmacophore data to support extremely efficient pharmacophore queries. In this section we evaluate the performance of Pharmer relative to Chemical Computing Group’s MOE.26
Benchmark
For our evaluation we reproduce the evaluation of Spitzer et al.27 and derive pharmacophore queries from the crystal structures of heat shock protein 90 (HSP90, PDB:2CDD) and the activated form of Factor XI (FXIa, PDB:2FDA). We used MOE (version 2010.10) and Pharmer to recreate the ‘unmodified’ pharmacophore queries of Spitzer et al. These pharmacophore queries are shown in Figure 5. Pharmer is capable of reading a variety of pharmacophore input formats, including the ph4 format of MOE, but we generate the Pharmer query directly from the structure to compensate for different pharmacophore recognition rules. Each query has two hydrogen bond acceptors, one hydrogen bond donor, and one hydrophobic feature which is slightly displaced between the Pharmer and MOE queries. No direction vectors were applied to the hydrogen bond features. No volume exclusion spheres were computed.
Figure 5.
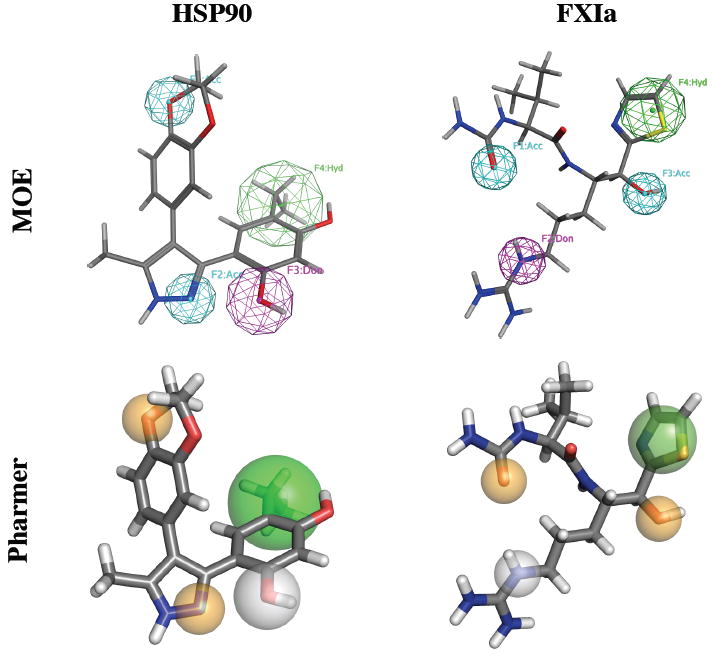
The pharmacophores for HSP90 (left) and FXIa (right) generated using MOE (top) and Pharmer (bottom). Hydrogen acceptor features are cyan in MOE and orange in Pharmer. Hydrogen donor features are magenta in MOE and white and Pharmer. Hydrophobic features are green and MOE and Pharmer position these features slightly differently. The hydrogen donor feature of HSP90 has a radius of 1.25Å, the hydrophobic feature of HSP90 has a radius of 2Å, the hydrophobic feature of FXIa has a radius of 1.5Å, and all other features have a radius of 1Å.
Two separate screening libraries for HSP90 and FXIa were created using the MUV data sets28 (access date: February 1, 2011). Each library includes 30 known active compounds and 15000 decoy compounds for a baseline enrichment of 0.2%. A multiconformer library was generated using Omega from OpenEye Software29 (version 2.4.1) with the option –strict 0 and the default settings (up to 200 conformers per a compound). The resulting libraries have 1,892,172 and 1,796,125 conformations for HSP90 and FXIa respectively. The function ‘wash’ was applied in MOE to determine the protonation states of library compounds. Pharmer uses the default settings of the OpenBabel library30 (version 2.3) to determine protonation.
Performance measurements were performed on a 3.33Ghz Intel Core i7 975 processor with 8GB of RAM running Ubuntu 10.04. All data was stored on a software RAID 0 (striped) disk array of two 500GB SATA-II 7200RPM disks. Both MOE and Pharmer were configured to find only the first hit against a conformation. Both were configured to run single-threaded. Reported execution times are an average of three identical runs. As the variance between runs was found to be negligible, error bars are not shown.
Enrichment
Differences in feature recognition and alignment algorithms result in large discrepancies between the hit lists of different pharmacophore search technologies.27 Pharmer and MOE are no exception. For HSP90, MOE identified 101,933 and Pharmer identified 98,878 matching conformations. For FXIa, MOE identified 52,692 and Pharmer 54,136 matches. The recovery of active compounds and the corresponding enrichment are shown in Table 2. Pharmer recovered the exact same set of active compounds as MOE for both HSP90 and FXIa. This result, and the similar number of matches returned between MOE and Pharmer, demonstrates that any performance improvement of Pharmer relative to MOE is not an artifact of a reduced or inappropriate set of recognized pharmacophore features in the compound library.
Table 2.
| Actives | Decoys | Enrichment | ||
|---|---|---|---|---|
| HSP90 | MOE | 11 | 3479 | 0.32% |
| Pharmer | 11 | 3242 | 0.34% | |
|
| ||||
| FXIa | MOE | 5 | 2767 | 0.18% |
| Pharmer | 5 | 2729 | 0.18% | |
Performance
The search performance of MOE and Pharmer is shown in Figure 6. We have decomposed the execution time into the time spent performing disk operations while searching (Disk), the time spent computing while searching (Compute), and the time spent writing out the results (Output). Pharmer generates results in a plain-text sdf file while MOE generates a compact proprietary mdb file. Converting this mdb file into an sdf is an additional step that is not included in the performance measurements. The Disk time is computed by contrasting the execution time of a search performed after clearing the disk cache with a search performed after priming the disk cache with the identical search. The Output time is computed by comparing with the execution time of the search performed in no output mode. Taken together, these three measurements represent a worse-case scenario for search performance. By itself, the Compute time is a best-case scenario, for example, as part of an iterative pharmacophore refinement process where many similar queries are performed in succession and the full molecular data of the hit list is not needed.
Figure 6.

The pharmacophore search performance of Pharmer relative to MOE on the HSP90 and FXIa queries of Figure 5. (a) Pharmer is more than an order of magnitude faster and (b) its performance scales with the query complexity, resulting in a three order of magnitude speed up for very precise queries.
Pharmer is more than ten times faster than MOE for both searches. For HSP90, the worst-case performance of Pharmer is 31.3s, of which 11.3s is spent in the Compute stage, compared to the worst-case performance of MOE at 388.9s, of which 119.2s is spent in Compute. The FXIa query has smaller search radii, returns fewer results, and searches a smaller library. Consequently, FXIa takes less time than HSP90 for both Pharmer and MOE. The worst-case performance is 22.1s for Pharmer, of which 8.2s is spent in Compute, and 299.7s for MOE, of which 110.5s is spent in Compute.
The effect of disk activity can be eliminated if the working set of the search is already in the filesystem cache, for instance if a user has already performed highly similar searches on the same library. Since MOE scans through the entire library, the size of its working set is directly proportional to the size of the library. The HSP90 and FXIa libraries are small enough to fit in main memory (4.4GB and 3.7GB respectively), but if a larger library is used or there is less memory available, MOE will always exhibit worst case behavior. In Pharmer, the working set depends on the size and complexity of the query, potentially allowing much larger libraries to be searched with zero penalty to access the disk once the cache has been primed. This is despite the fact that, due to the enumeration of all pharmacophore feature triplets, the Pharmer databases are much larger (34GB for HSP90 and 32GB for FXIa).
The relationship between query complexity and worst-case search performance is shown in Figure 6(b). For both HSP90 and FXIa we generated ten pharmacophore queries by multiplying the tolerance sphere radii of the original queries shown in Figure 5 by a multiple ranging from 0.1 to 1.0. The smallest query, with a 0.1 multiple, returned no results while all other queries found at least one match. The peak enrichment using Pharmer is found at a scale factor of 0.5 for HSP90 (3 actives out of 554 hits) and a scale factor of 0.8 for FXIa (5 actives out of 952 hits). Using MOE, the scale factor with the peak enrichment for HSP90 is 0.6 (5 actives out of 996 hits) and for FXIa is 0.7 (3 actives out of 581 hits). At the peak enrichment, Pharmer is 38 times faster than MOE for HSP90 and 24 times faster for FXIa in the worst-case.
As expected, the performance of MOE is largely unrelated to query complexity. What difference there is between the full, 1.0 multiple, query and the small, 0.1 multiple, query is less than 50 seconds and is mostly due to the cost of writing out the results file. With Pharmer, there is clearly a relationship between search performance and query complexity, as highlighted by the log-scale of Figure 6(b). In fact, the performance ratio between Pharmer and MOE ranges from 10 times faster to more than 1000 times faster.
Discussion
Pharmer is a new, enabling technology for pharmacophore search. Most existing technologies sequentially scan through the target library and their performance scales with the size of the library. In Pharmer, the performance of the search depends on both the query and the library. Precise queries with only a few matches can search a library of hundreds of millions of conformations in just seconds.
By accelerating pharmacophore search by at least an order of magnitude, Pharmer enables new applications and uses of pharmacophore search. Current pharmacophore elucidation algorithms elucidate a consensus pharmacophore from a set of active ligands. With Pharmer as a building block, it is now tractable for elucidation to incorporate properties of a large target library, for example, as part of a semi-supervised learning approach. Additionally, the ultra-fast performance of Pharmer when performing highly precise queries (queries with small tolerance spheres) suggests an alternative representation for a consensus pharmacophore: instead of merging pharmacophore features into a single query with large tolerances, an ensemble of ligand-based pharmacophores can be readily screened. Alternatively, large ensembles of structure-based pharmacophores taken from a flexible receptor model can be easily screened and consensus scored.
We have described two novel methods for organizing molecular data: the Pharmer KDB-tree and Bloom fingerprints. Together they enable pharmacophore screening of large databases on an interactive time-scale. The complete source code to Pharmer is available under the GNU Public License at http://pharmer.sourceforge.net.
Acknowledgments
This work was supported by grants 1R21GM087617-01A1 and R01GM097082-01 from the National Institute of Health. Lidio Meireles created the original pharmacophore SMARTs definitions.
References
- 1.Macarron R. Critical review of the role of HTS in drug discovery. Drug Discovery Today. 2006;11:277–279. doi: 10.1016/j.drudis.2006.02.001. [DOI] [PubMed] [Google Scholar]
- 2.Bajorath J. Integration of virtual and high-throughput screening. Nature Reviews Drug Discovery. 2002;1:882–894. doi: 10.1038/nrd941. [DOI] [PubMed] [Google Scholar]
- 3.Shoichet BK. Virtual screening of chemical libraries. Nature. 2004;432:862. doi: 10.1038/nature03197. [DOI] [PMC free article] [PubMed] [Google Scholar]
- 4.Beno BR, Mason JS. The design of combinatorial libraries using properties and 3D pharmacophore fingerprints. Drug Discovery Today. 2001;6:251–258. doi: 10.1016/S1359-6446(00)01665-2. [DOI] [PubMed] [Google Scholar]
- 5.Wolber G, Dornhofer A, Langer T. Efficient overlay of small organic molecules using 3D pharmacophores. Journal of Computer-Aided Molecular Design. 2006;20:773–788. doi: 10.1007/s10822-006-9078-7. [DOI] [PubMed] [Google Scholar]
- 6.Lu F, Chi S-W, Kim D-H, Han K-H, Kuntz ID, Guy RK. Proteomimetic Libraries: Design, Synthesis, and Evaluation of p53/MDM2 Interaction Inhibitors. Journal of Combinatorial Chemistry. 2006;8:315–325. doi: 10.1021/cc050142v. [DOI] [PubMed] [Google Scholar]
- 7.Mason JS, Good AC, Martin EJ. 3-D pharmacophores in drug discovery. Current Pharmaceutical Design. 2001;7:567–597. doi: 10.2174/1381612013397843. [DOI] [PubMed] [Google Scholar]
- 8.Langer T, Krovat EM. Chemical feature-based pharmacophores and virtual library screening for discovery of new leads. Current Opinion in Drug Discovery and Development. 2003;6:370–376. [PubMed] [Google Scholar]
- 9.Leach AR, Gillet VJ, Lewis RA, Taylor R. Three-dimensional pharmacophore methods in drug discovery. Journal of Med Chem. 2009;53:539–558. doi: 10.1021/jm900817u. [DOI] [PubMed] [Google Scholar]
- 10.Sheridan RP, Kearsley SK. Why do we need so many chemical similarity search methods? Drug Discovery Today. 2002;7:903–911. doi: 10.1016/s1359-6446(02)02411-x. [DOI] [PubMed] [Google Scholar]
- 11.Mason JS, Morize I, Menard PR, Cheney DL, Hulme C, Labaudinieres RF. New 4-point pharmacophore method for molecular similarity and diversity applications: overview of the method and applications, including a novel approach to the design of combinatorial libraries containing privileged substructures. Journal of Medicinal Chemistry. 1999;42:3251–3264. doi: 10.1021/jm9806998. [DOI] [PubMed] [Google Scholar]
- 12.Mason JS, Cheney DL. Pac Symp Biocomput. Citeseer; 2000. Library design and virtual screening using multiple 4-point pharmacophore fingerprints; pp. 576–587. [DOI] [PubMed] [Google Scholar]
- 13.Baroni M, Cruciani G, Sciabola S, Perruccio F, Mason JS. A common reference framework for analyzing/comparing proteins and ligands. Fingerprints for Ligands and Proteins (FLAP): theory and application. J Chem Inf Model. 2007;47:279–294. doi: 10.1021/ci600253e. [DOI] [PubMed] [Google Scholar]
- 14.Raymond JW, Willett P. Maximum common subgraph isomorphism algorithms for the matching of chemical structures. Journal of Computer-Aided Molecular Design. 2002;16:521–533. doi: 10.1023/A:1021271615909. [DOI] [PubMed] [Google Scholar]
- 15.Wolber G, Seidel T, Bendix F, Langer T. Molecule-pharmacophore superpositioning and pattern matching in computational drug design. Drug Discovery Today. 2008;13:23–29. doi: 10.1016/j.drudis.2007.09.007. [DOI] [PubMed] [Google Scholar]
- 16.Hurst T. Flexible 3D searching: The directed tweak technique. Journal of Chemical Information and Computer Sciences. 1994;34:190–196. doi: 10.1021/ci00017a025. [DOI] [Google Scholar]
- 17.Sheridan RP, Nilakantan R, Rusinko A, Bauman N, Haraki KS, Venkataraghavan R. 3DSEARCH: a system for three-dimensional substructure searching. Journal of Chemical Information and Computer Sciences. 1989;29:255–260. doi: 10.1021/ci00064a005. [DOI] [Google Scholar]
- 18.Maass P, Schulz-Gasch T, Stahl M, Rarey M. Recore: A fast and versatile method for scaffold hopping based on small molecule crystal structure conformations. J Chem Inf Model. 2007;47:390–399. doi: 10.1021/ci060094h. [DOI] [PubMed] [Google Scholar]
- 19.Wolfson HJ, Rigoutsos I. Geometric hashing: An overview. IEEE Computational Science and Engineering. 1997;4:10–21. [Google Scholar]
- 20.Ballard DH. Generalizing the Hough transform to detect arbitrary shapes. Pattern Recognition. 1981;13:111–122. [Google Scholar]
- 21.Bloom BH. Space/time trade-offs in hash coding with allowable errors. Communications of the ACM. 1970;13:422–426. [Google Scholar]
- 22.Daylight Theory Manual, version Daylight Version 4.9. Daylight Chemical Information Systems, Inc.; Aliso Viejo, CA: 2008. [Google Scholar]
- 23.Robinson JT. Proceedings of the 1981 ACM SIGMOD International Conference on Management of Data. ACM; New York, NY: 1981. The KDB-tree: a search structure for large multidimensional dynamic indexes; p. 18. [Google Scholar]
- 24.Maneewongvatana S, Mount DM. Proceedings of the 4th Annual Workshop on Computational Geometry. Center for Geometric Computing; Baltimore, MD: 1999. It’s okay to be skinny, if your friends are fat. [Google Scholar]
- 25.Walker MW, Shao L, Volz RA. Estimating 3-D location parameters using dual number quaternions. CVGIP: Image Understanding. 1991;54:358–367. doi: 10.1016/1049-9660(91)90036-O. [DOI] [Google Scholar]
- 26.Molecular Operating Environment, version 2010.10. Chemical Computing Group, Inc.; Montreal, Quebec: 2010. [Google Scholar]
- 27.Spitzer GM, Heiss M, Mangold M, Markt P, Kirchmair J, Wolber G, Liedl KR. One Concept, Three Implementations of 3D Pharmacophore-Based Virtual Screening: Distinct Coverage of Chemical Search Space. Journal of Chemical Information and Modeling. 2010;50:1241–1247. doi: 10.1021/ci100136b. [DOI] [PubMed] [Google Scholar]
- 28.Rohrer SG, Baumann K. Maximum Unbiased Validation (MUV) Data Sets for Virtual Screening Based on PubChem Bioactivity Data. Journal of Chemical Information and Modeling. 2009;49:169–184. doi: 10.1021/ci8002649. [DOI] [PubMed] [Google Scholar]
- 29.Omega, version 2.4.1. OpenEye Scientific Software Inc; Santa Fe, New Mexico: 2011. [Google Scholar]
- 30. [April, 2011];The Open Babel Package, version 2.3. http://openbabel.sourceforge.net.