

Abstract
Here we use nuclear magnetic resonance to measure the solubility limit of several biologically relevant sterols in electroformed giant unilamellar vesicle membranes containing phosphatidylcholine (PC) lipids in ratios of 1:1:X DOPC:DPPC:sterol. We find solubility limits of cholesterol, lanosterol, ergosterol, stigmasterol, and β-sitosterol to be 65-70%, ~35%, 30-35%, 20-25%, and ~40%, respectively. The low solubilities of stigmasterol and β-sitosterol, which differ from cholesterol only in their alkyl tails, show that subtle differences in tail structure can strongly affect sterol solubility. Below the solubility limits, the fraction of sterol to PC-lipid in electroformed vesicles linearly reflects the fraction in the original stock solutions used in the electroformation process.
INTRODUCTION
Sterols occur in a wide range of plant and animal cells.1 For example, cholesterol is a major component of eukaryotic cell plasma membranes, with concentrations up to 50 mole percent.2, 3. Sterols, and cholesterol in particular, are notable for their effects on the permeability, rigidity, conformational order, and phase behavior of phospholipid membranes4 (and references within). High concentrations of sterols are associated with diseases.5 For example, human atherosclerosis is typically associated with an excess of cholesterol. Patients afflicted with sitosterolemia also suffer from atherosclerosis, due to an accumulation of excess plant sterols (e.g. stigmasterol and β-sitosterol).6 In healthy and hypercholesterolemic (but non-sitosterolemic) subjects, plant sterols are valued for their ability to lower plasma cholesterol levels7, 8 and their potential as anticancer compounds9 (and references within).
The solubility limit of cholesterol in membranes of either saturated or mono-unsaturated phosphatidylcholine (PC) lipids is established to be 66±1% mol%, following many years of measurement10 (and references within). Above this concentration, crystals of pure cholesterol monohydrate form in solution. The solubility limit of cholesterol in ternary membranes containing saturated or mono-unsaturated PC-lipids is thought to be similarly high11 but has not been previously tested. Cholesterol’s solubility limit is lower in membranes containing polyunsaturated PCs (e.g. 11±3 mol% cholesterol in di(22:6)PC lipid membranes) and/or phosphatidylethanolamine lipids.10, 12, 13 Solubilities of sterols other than cholesterol are less well known. A solubility limit of 25 or 30 mol% ergosterol in POPC membranes is supported by DSC studies, by a plateau in the first moment of 2H-NMR spectra, and by the appearance of a second form of ergosterol in 13C-NMR spectra.14-16 Similarly, the solubility limit of lanosterol is thought to be in excess of 30 mol%.15 Our laboratory is particularly interested in sterol fractions and solubilities within membranes made by electroformation17, a widely used tool for producing giant unilamellar vesicles.
Here we use nuclear magnetic resonance (NMR) to measure the mole fraction and solubility of several sterols within ternary lipid membranes composed of dioleoyl-PC (DOPC), dipalmitoyl-PC (DPPC), and sterol. These lipids were chosen because the miscibility phase diagram of DOPC:DPPC:cholesterol membranes has been well characterized18-20, and because liquid-liquid coexistence has been directly observed in electroformed giant unlamellar vesicles composed of mixtures of DOPC/DPPC with various sterols.21, 22
Throughout our work, we electroformed vesicles, separated the vesicles from any crystals in solution by extrusion, transferred the vesicle lipids to deuterated chloroform through solvent exchange, and then analyzed the fraction of sterol by NMR (see Methods). In our results below, we first confirm that our technique is valid. Specifically, we show that our measured value of cholesterol’s solubility limit is roughly the same as from the gold-standard technique of x-ray diffraction from vesicles formed by rapid solvent exchange10, and is consistent with the technique of identifying sterol crystals by optical microscopy. Second, we present membrane solubility limits of other naturally-occurring sterols: lanosterol, ergosterol, stigmasterol, and β-sitosterol (fig. 1). Lanosterol is a metabolic precursor of cholesterol in vertebrates, ergosterol is the predominant sterol of yeast and fungi, and stigmasterol and β-sitosterol are abundant plant sterols commonly ingested by humans.1 Third, we demonstrate that sterols incorporate into electroformed vesicles containing PC-lipids in the same mole fraction as in original stock solutions, as long as the sterol fraction is below the solubility limit.
Figure 1.
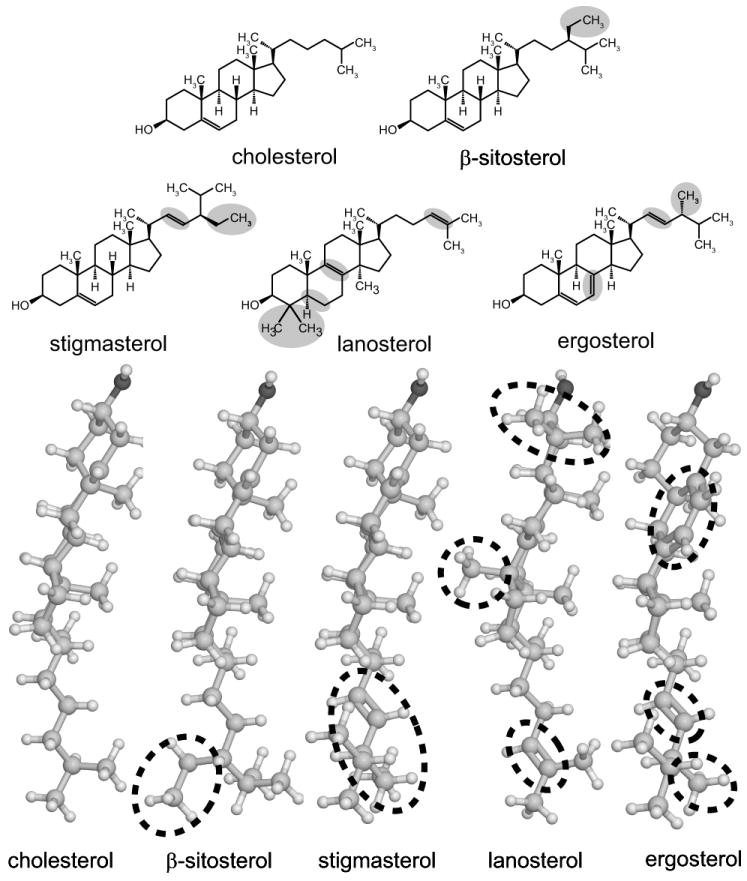
Structures of sterols used in this study, shown in two formats. 3-dimensional structures were created using CORINA (Molecular Networks, Erlangen, Germany) and rendered using Jmol, an open-source Java viewer (www.jmol.org). The most significant deviations from cholesterol’s structure are highlighted in gray (top panel) and circled (bottom panel). Ergosterol is shown in an extended conformation, but may also exist in a bent conformation 14.
RESULTS
Verification of Peak Assignments
Our first step was to confirm that our assignment of NMR peaks was correct (see Methods). In control experiments, we mixed known fractions of sterols and PC-lipids directly in deuterated chloroform (fig. 2 inset, x-axis), and analyzed those fractions by NMR (fig. 2 inset, y-axis). In all cases, the fraction mixed and the fraction measured fell along a line with slope=1, reflecting correct peak assignments. Measurement uncertainties are denoted by error bars in the insets in figure 2. In most cases, uncertainties are smaller than the symbols.
Figure 2.

Main graphs: Giant unilamellar vesicles were made by electroformation of 1:1:X DPPC:DOPC:sterol. The percent sterol measured by NMR for electroformed/extruded/solvent-exchanged vesicles roughly follow the dashed line with slope = 1 until the membrane’s sterol solubility limit is reached. Each point denotes an individual experiment. Error bars represent propagated uncertainties resulting from the analysis outlined in figure 4 rather than standard deviations from multiple experiments. Multiple points are shown for all experiments that were repeated.
Dark-field micrographs of electroformed vesicles: At low sterol concentrations, a field of giant unilamellar vesicles appears as a series of bulls-eye patterns of large circles (the vesicles) surrounding small circles (tethers from the vesicle to the substrate).
Insets: Experiments using standards demonstrate that the NMR analysis technique is sound. Standards of 1:1:X DOPC:DPPC:sterol were made by directly mixing stock solutions in chloroform, drying the lipids under nitrogen gas and resuspending the lipids in deuterated chloroform. The fraction of sterol measured by NMR in each standard is within a few percent of the fraction originally mixed in each sample (such that data fall along the dashed line with slope = 1). Axes and error bar calculations are the same as in the main figures.
Solubility Limit of Cholesterol
In fig. 2a, we show that our multi-step technique of electroformation, extrusion, solvent exchange, and NMR reproduces the well-known solubility limit of cholesterol within membranes of PC-lipids. In particular, we found that the fraction of cholesterol in vesicles containing equimolar mixtures of saturated and monounsaturated PC-lipids levels off at 65-70 mol%. This value is in line with cholesterol’s solubility limit of 66±1% in vesicles of pure saturated or monounsaturated PC-lipids formed by rapid solvent exchange.10
The presence of crystals within dark-field micrographs of vesicles directly after electroformation (and before extrusion) visually confirms the solubility limit of 65-70% cholesterol measured by NMR. At low cholesterol fractions, the electroformation cell is filled with vesicles tethered to the ITO slide (fig. 2a, arrows), and no crystals appear. At 70% cholesterol and above, crystals are visible (asterisks). Optical microscopy yields only an upper limit for sterol solubility because small crystals may be unresolvable.
Solubility Limits of Other Sterols
We used the same multi-step NMR technique described above to measure solubility limits of other naturally-occurring sterols in electroformed membranes containing PC-lipids (fig. 2b-2e). Solubility limits for lanosterol, ergosterol, stigmasterol, and β-sitosterol in membranes of 1:1:X DOPC:DPPC:sterol are ~35 mol%, 30-35%, 20-25%, and ~40%, respectively.
For two of these sterols (lanosterol and stigmasterol), crystals are resolvable by optical microscopy at sterol fractions near the solubility limits determined by NMR. For the other two sterols (ergosterol and β-sitosterol), crystals are not resolvable by microscopy until ~65 mol% sterol, much higher than the solubility limits determined by NMR. Hence, microscopy is not an accurate technique for determining solubility limits of ergosterol and β-sitosterol.
Sterol Fractions in Electroformed Vesicles
In fig. 2a-d, all data below the solubility limits of all sterols fall on dashed lines that intersect the origin with a slope of 1, within the measurement uncertainty set by the standards (fig. 2 insets). In other words, the fraction of sterol to PC-lipid that is incorporated into vesicles upon electroformation is equal to the fraction of sterol to PC-lipid in stock solutions. The electroformation method faithfully produces vesicles of the desired composition.
DISCUSSION
Solubility Limits
As shown in fig. 2, the solubility limits of different sterols within electroformed vesicles containing PC-lipids vary widely. Cholesterol, lanosterol, ergosterol, stigmasterol, and β-sitosterol are soluble in membranes of 1:1:X DOPC:DPPC:sterol at maximum concentrations of 65-70 mol%, ~35%, 30-35%, 20-25%, and ~40%, respectively. These values agree with the firm value of 66±1 mol% for cholesterol in saturated or monounsaturated PC membranes10, and with the less established values of >30% for lanosterol15, and 25% or 30% for ergosterol in POPC membranes.14-16 The solubility limit of stigmasterol is the lowest of all of the sterols tested. The range of stigmasterol concentrations that can be accurately explored in electroformed vesicles containing PC-lipids is narrow, smaller than some concentration ranges explored in previous experiments using multilamellar vesicles (e.g. 0-25% 23, 0-30% 24, and 0-33% 25).
Differences between structures of the various sterols in figure 1 range from significant to slight. Lanosterol differs strongly from cholesterol in its two methyl groups near the water interface and a methyl group that protrudes from the sterol’s α-face. Ergosterol has a slight twist in its ring structure, and may be bent at the tail.14 All sterols differ in minor ways in their alkyl chains.
We devote the next 4 paragraphs to a detailed discussion of how differences in sterol solubilities might arise. Few models exist that predict solubility limits of sterols in membranes. The Umbrella Model posits that the small hydroxyl headgroups of sterols do not sufficiently shield them from water, and that sterols reach a solubility limit when the headgroups of neighboring phospholipids are unable to protect the hydrophobic body of sterols from water.26 All of the sterols in our study have the same hydroxyl headgroup. From inspection of the sterol structures in figure 1, only lanosterol presents a significantly larger hydrophobic area at the water interface than cholesterol does, due to two extra methyl groups near the hydroxyl headgroup. Therefore, our simple interpretation of the Umbrella Model predicts that only lanosterol should have a significantly lower solubility limit than cholesterol, and does not explain the low solubility limits we observe for ergosterol, stigmasterol, and β-sitosterol within membranes containing PC-lipids.
Perhaps sterol solubility limits are better predicted by the ability of a sterol to pack tightly with a phospholipid with high acyl chain order. Tight packing might result in phospholipid headgroups shielding sterols from water more effectively (Umbrella Model)26, or the formation of a phospholipid-sterol complex with high sterol stoichiometry (Condensed Complexes Model)27-29, or the accommodation of higher sterol fractions within a lattice (Superlattice Model)30. Indeed, it has been noted that a ratio of 2:1 cholesterol to saturated lipid corresponds to both the maximum solubility limit of cholesterol and to the concentration at which cholesterol’s orientation in a membrane changes.31 Moreover, the ability of sterols to induce order in neighboring saturated lipids within a binary membrane (ergosterol < lanosterol < stigmasterol < β-sitosterol < cholesterol) roughly follows the sequence of sterol solubility limits we find in ternary membranes, in which only stigmasterol is out of order.32 The correlation is much weaker between sterol solubility and parameters characteristic of ternary membranes that separate into coexisting liquid phases. For example, in ternary membranes containing sterols, both the membrane miscibility transition temperature and the difference in phospholipid ordering between the two phases progresses in the order β-sitosterol < cholesterol < ergosterol.33 If miscibility transition temperature or phospholipid ordering correlated with solubility limits, then we would expect ergosterol to have the highest solubility limit of this group, rather than the lowest. Of course, within any discussion of orientational order in lipid acyl chains, it is worth keeping in mind that sterol solubility is unlikely to be correlated with an absolute order parameter since cholesterol’s solubility in membranes of saturated PC lipids is the same as in membranes of monounsaturated PC lipids.10
An alternate way to quantify sterol/lipid packing is in a monolayer at an air-water interface. Barenholz argues that evolution has optimized sterols to affect “short- and long-range membrane order” by creating structures with 1) flat, fused rings, 2) a 3-β-hydroxyl (or other small) headgroup, 3) a “cholesterol-like” tail, and 4) an area of less than 40 Å2/molecule at an air/water interface.34 The first criterion is violated by lanosterol. The flatness of the α-face of cholesterol with respect to lanosterol has been previously discussed with respect to cholesterol’s enhanced ability to order and affect the phase behavior of lipids.4, 21, 35 The second criterion is met by all sterols in this study. The third criterion depends on a definition of “cholesterol-like”, which could loosely be interpreted to encompass all sterols in this study. However, recent results by Shaghaghi et al. imply that the exact structure of the sterol tail is important in determining sterol solubility, even more important than the sterol ring structure. They studied 7-dehydrocholesterol, which has the ring structure of ergosterol and the alkyl tail of cholesterol, vs. brassicasterol, which has the rings of cholesterol and the tail of ergosterol. They found a plateau in the first moment of 2H-NMR spectra of POPC membranes containing 25 mol% sterol for both ergosterol and brassiacasterol, which have the same tails but different rings. For cholesterol and 7-dehydrocholesterol, which also have the same tails but different rings, they found no plateau, up to their maximum sterol fraction of 30 mol%.36 The results we present in figure 2 support the observation that sterol alkyl structure strongly affects sterol solubility. We find that the solubility of stigmasterol and β-sitosterol within membranes of 1:1:X DOPC:DPPC:sterol are ≥15 mol% lower than for cholesterol, even though the structure of the three sterols differ only in their tails.
Barenholz’s fourth criterion is met by cholesterol and ergosterol, but violated by stigmasterol. At 37°C, these sterols occupy 39.5, 39.2, and 40.6 Å2/molecule at an air/water interface, respectively.37 If solubility correlates with a low monolayer area/molecule, then ergosterol solubility should be high, rather than low as observed here. If solubility instead correlates with monolayer area condensation upon mixing sterols with 18:1/18:0 PC lipids at an air/water interface, then cholesterol should have the highest solubility, followed by ergosterol and stigmasterol, which agrees with our results.37 Area condensation is usually assumed to correlate with the strength of lipid-sterol interactions in bilayers. Can we conclude that stronger lipid-sterol interactions correlate with higher sterol solubilities? Not necessarily. Significantly stronger phospholipid-sterol interactions have been documented in systems containing β-sitosterol than in systems containing cholesterol38, whereas we find the solubility of β-sitosterol to be lower than of cholesterol.
To summarize, it is difficult to merge the spectrum of published results above into a single cohesive explanation of why the solubilities of ergosterol, stigmasterol, and β-sitosterol are ≥15 mol% lower than for cholesterol within membranes of PC-lipids. Details of sterol chain structure, and a concomitant ability of each sterol to order the acyl chains of neighboring lipids seem important. Given the poor state of our current predictive power, we find it fortunate that sterol solubilities in electroformed vesicles are straightforward to measure.
Reflections on Electroformation
In figure 2, we demonstrate that for cholesterol, lanosterol, ergosterol, stigmasterol, and β-sitosterol, the ratio of PC-lipids to sterol in electroformed vesicles reflects the same ratio within stock solutions of 1:1:X DOPC:DPPC:sterol used to make the vesicles. Moreover, the solubility limit of cholesterol in electroformed vesicles containing PC-lipids is roughly the same as that observed using high-resolution techniques such as x-ray diffraction of vesicles formed by rapid solvent exchange 10. For the lipids and sterols we used, the electroformation technique does not appear to be plagued by problems inherent to other film deposition techniques, which can yield apparent solubility limits as low as 45 mol% cholesterol10 (and references within). Taken together, our results imply that researchers who work with electroformed vesicles can be confident that the ratios of lipids to sterols within their vesicles are accurate on average, as long as sterol concentrations fall below the solubility limits and the types of lipids and sterols are among those studied here.
Other lipid mixtures, including extracts from cell membranes, may not prove as well-behaved, which opens up a long list of possible future experiments. For example, when vesicles containing phosphatidylethanolamine (PE) lipids are grown by gentle hydration, PE lipids preferentially remain in the lipid film on the glass substrate.39 NMR could be used to verify this claim, and would report anomalously low sterol solubility limits in PE vesicles made by film deposition techniques. Even in the absence of substrate effects, cholesterol solubility is reported to be lower within multilamellar vesicles containing saturated or mono-unsaturated lipids with PE headgroups (~50 mol%) or phosphatidylserine (PS) headgroups (30-40 mol%) than with PC headgroups (50-67 mol%).10, 40-42 Cholesterol solubility within small unilamellar vesicles containing gangliosides varies between 50 – 67 mol% cholesterol, depending on the specific ganglioside type.43 The NMR techniques we used could also be employed to systematically study membrane composition or sterol solubility under different solution pH and ionic strength conditions, including physiological salt and buffer conditions.
Reflections on NMR
One strength of measuring sterol solubilities by membrane extrusion followed by NMR, is that sterol fractions in vesicles can be easily monitored even when sterols other than cholesterol are studied. Another method of achieving the same goal would be to measure the radioactivity due to labeled vesicle components (e.g. deuterated phospholipids or tritiated cholesterol) and then to chemically assay the other components (e.g. the phospholipids through a phosphorus assay or the cholesterol through a commercial assay). Unfortunately, for sterols other than cholesterol, no tritiated versions or chemical assays are commercially available to our knowledge.
Another strength of our technique is that the analysis is straightforward, has been previously tested in other scenarios10, 44, 45, and is applicable to procedures that produce unilamellar vesicles such as electroformation and microfluidic jetting.46 Most of our research was conducted by an undergraduate in a standard departmental NMR user facility. NMR solubility experiments are typically more accessible than similar assays using mass spectrometry because measurement of phospholipids/sterol ratios by mass spectrometry requires reference to careful sterol controls, often with radiolabeled standards.
A clear disadvantage of our NMR method is that many biologically-relevant sterols are excluded from study, as described in the methods. For example, desmosterol and 7-dehydroxycholesterol are of interest as immediate precursors to cholesterol in the biosynthetic pathway5, but were excluded. Desmosterol and 7-dehydroxycholesterol concentrations are elevated in patients who suffer from desmosterlosis and from Smith-Lemli-Opitz Syndrome, respectively5.
Another method of extracting ratios lipid/sterol within vesicles is to measure the area fraction of the phases imaged by fluorescence microscopy. This technique works well when vesicles contain no sterol (such that gel and liquid phases coexist), when the molecular areas in the gel and liquid phases are known, and when the phase diagram is known via a technique that accurately incorporates stock lipid fractions into vesicles.47 It does not work uniformly well when molecular areas are not known (as in the case of area condensation of liquid phases due to the presence of cholesterol). For example, area fractions deduced by comparing NMR and fluorescence microscopy results can range from consistent (64±4% vs. 59±2% for 35:35:30 DOPC:DPPC:chol at 24°C) to divergent (33±4% vs 46±6% for 32:48:20 DOPC:DPPC:chol at 28°C).48 In this case, consistency may mean accurate incorporation of stock lipid fractions, or it may mean that both methods inaccurately incorporate lipid fractions in the same way.
For researchers wishing to measure only sterol solubility limits rather than ratios of lipids within vesicles, differential scanning calorimetry (DSC) is an attractive, widely-accessible technique 40. That said, DSC fails to identify endotherms characteristic of melting of large ergosterol crystals in membrane samples with high (50 mol%) ergosterol concentrations, perhaps because ergosterol adopts a bent configuration.14 Of course, optical microscopy is the most accessible method of all for identifying solubility limits. However, as noted by Huang et al., “light microscopy serves best as a supporting technique” since small, dilute crystals at concentrations near the solubility limit are difficult to detect.10 We found optical microscopy to be an inferior technique for samples containing ergosterol and β-sitosterol.
Other techniques for measuring sterol solubility limits include light scattering and x-ray diffraction. Light scattering is reportedly not useful for vesicles containing some types of PE-lipids. 10 X-ray diffraction conducted at a synchrotron gives outstanding resolution and reproducibility for cholesterol solubility10, but most researchers lack ready access to a source of sufficient flux. We found that identifying sterol crystals by diffraction within our own departmental x-ray facility was unfeasible because the lipid and sterol density in samples of unilamellar, electroformed vesicles is significantly lower than in samples of multilamellar vesicles typically used in diffraction studies.
CONCLUSION
The solubility limits of cholesterol, lanosterol, ergosterol, stigmasterol, and β-sitosterol in unilamellar electroformed vesicles of 1:1:X DOPC:DPPC:sterol are 65-70%, 30-35 mol%, ~30%, 20-25%, and 40-50%, respectively. We were surprised to find large solubility differences between sterols that differed only in the structures of their tails. Below the sterol solubility limits, the ratio of phospholipids to sterols in stock solutions is, on average, reproduced in the vesicles.
EXPERIMENTAL METHODS
Lipids and Sterols
Dioleoyl-phosphocholine (DOPC), dipalmitoyl-phosphocholine (DPPC), and palmitoyl-azelaoyl-phosphocholine (PAzPC), were obtained from Avanti Polar Lipids (Alabaster, AL). All sterols, including cholesterol, ergosterol, lanosterol, stigmasterol, desmosterol, 7-dehydroxylcholesterol and dihydrocholesterol were obtained from Sigma-Aldrich (St. Louis, MO). All lipids and sterols were used without further purification. Ergosterol was stored at 5°C prior to use. All other sterols were stored at -20°C.
Electroformation
Vesicles were prepared by electroformation17 as previously described18, 49 and briefly summarized here. Lipids were dissolved in chloroform at 10mg/ml in aliquots of 0.4mg. Aliquots were spread at ~23°C as thin films on 25mm × 75mm glass slides (#CG-90IN-S115 Delta Technologies, Stillwater MN) coated with indium-tin-oxide (ITO). Each aliquot was divided over four slides for a final coverage of 0.1mg of lipid per slide. Coated slides were placed under vacuum for 30 minutes to remove remaining solvent. Films were visually inspected to ensure that they were translucent and produced a smooth color spectrum characteristic of thin-film interference. A few lipid films containing ≥80% β-sitosterol showed evidence of lipid demixing and failed this test. These were re-spread at high temperature (~50°C), and passed the test. Two lipid-coated slides were then assembled face-to-face spanning a 0.5mm Teflon spacer to form a capacitor. The capacitor was filled with 18mΩ-cm water, and the ends were sealed with vacuum grease. Vesicles were grown for 1 hour at 60°C under an AC voltage of 1V at 10Hz. Vesicles were detached from the substrate by collecting the vesicle solution in a syringe with a wide-bore 22 gauge (0.70mm) needle. The majority of the lipid film was not incorporated into vesicles, but remained as a film on the slides. We previously measured the variance in lipid composition from vesicle-to-vesicle to be ~2 mole %49, although this value does not enter our calculations because here we average the composition of all vesicles.
Optical Microscopy
A Nikon eclipse ME600 microscope in darkfield mode with a 10x objective was used to image sterol crystals in vesicle samples within ITO capacitors after electroformation and before the vesicles were detached from the substrate. Images were captured on a Photometrics CCD camera QuantEM 512SC or CoolSnap HQ.
Extrusion
All cholesterol above the membrane solubility limit is assumed to form crystals.10 Crystals were removed from vesicle samples by extrusion in ≥15 passes through 0.1μm polycarbonate filters in an Avanti extruder, a method named “ultrafiltration” in the literature.10 Experiments in which samples were spiked with 3H-cholesterol have previously shown that all cholesterol above the solubility limit remains on the filters and that the same solubility limit is found by x-ray diffraction as by ultrafiltration techniques44, 50.
Solvent Exchange
Lipids were transferred from water to deuterated chloroform in a multi-step solvent exchange protocol. Equal volumes of methanol, chloroform, and aqueous sample were vortexed for ≥30 seconds, then centrifuged on a table-top apparatus for ≥15 minutes, until distinct separation occurred between solvent layers of water/methanol and chloroform. The water/methanol layer was discarded, and the procedure was repeated twice. Dry N2 was used to evaporate solvent from the resulting solution. The dry lipids were resuspended in chloroform and transferred to an NMR tube. All traces of water were removed by evaporation with dry N2 followed by lyophilization for ≥ 4 hours. The sample was then resuspended in 99.8% deuterated chloroform (Cambridge Isotope Laboratories, Andover MA) within an NMR tube sealed with a layer each of Teflon tape and parafilm, then stored at -20°C.
NMR
Proton NMR studies were conducted using a Bruker Avance DRX-499 spectrometer with a 1H frequency of 499.85 MHz and a Bruker Avance AV500 with a 1H frequency of 500.046 MHz. Data files were converted for analysis from .jcamp to .ascii with the Linux tool Jcamp Converter. We conducted NMR on undiluted samples within 24 hours of vesicle preparation with the goal of minimizing measurement uncertainty. Uncertainty was never significantly reduced by 1) dilution of the lipid sample, 2) increase in the number of NMR scans, or 3) increase in the delay between vesicle sample preparation and NMR measurement (data not shown).
1H NMR Peak Identification
Within the 1H NMR spectrum of pure DPPC, seven peaks that fall between 2.2ppm and 5.3ppm are useful for composition determination (fig. 3a). Peak a at 5.2-5.3 ppm represents a singular tertiary proton at the sn-2 position of the glycerol backbone. Within the set of four peaks labeled b, the peaks at 4.3-4.45 ppm and at 4.1-4.2 ppm match the protons positioned between the phosphate group and the quaternary amine. The peaks at 3.9-4.05 ppm and at 3.8-3.9 ppm correspond to the protons at the sn-1 and sn-3 positions of the glycerol backbone. Peak c at 3.3-3.5 ppm corresponds to the nine hydrogens of the three methyl groups of the quaternary amine. Peak d at 2.2-2.4 ppm is representative of DPPC’s four β-hydrogens on C1 of the tail groups.
Figure 3.

Peak assignments for 1H NMR spectra of DPPC (panels a and d), DOPC (panels b and e), and cholesterol (panels c and f). Peaks in panels a, b, and c are labeled with letters (a-v) and color-coded. Hydrogens in the structures in panels d, e, and f are similarly labeled with letters (in bars above and below each structure) and color-coded.
Small differences between the 1H NMR spectra of pure DPPC and pure DOPC are due to unsaturation in DOPC’s hydrocarbon tails (fig. 3a vs. 3b). DOPC’s four vinylic hydrogens are represented within peak h at 5.3-5.45 ppm. Peak m from DOPC’s eight allylic hydrogens appear at 1.9-2.1 ppm.
Cholesterol’s spectrum provides six distinct peaks for quantification (fig. 3c), several of which overlap with signals from the spectra of DPPC and/or DOPC. Peak q at 5.3-5.45 ppm represents the vinylic hydrogen off the double bond and overlaps the signal from DOPC’s vinylic hydrogens. Peak r is visible from 3.45-3.6 ppm, representing the hydrogen bound to the same carbon as the hydroxyl headgroup. Peak s at 2.2-2.4 ppm represents the two hydrogens that are β to cholesterol’s hydroxyl headgroup and allylic to the double bond. Peak s overlaps with hydrogens in the DPPC and DOPC spectra. Peaks t and u are harder to assign to specific hydrogens within the molecular structure, but their consistent chemical shift makes them useful in quantification. Peak t at 1.95-2.1 ppm reliably measures two hydrogens and overlaps with the signal from DOPC’s eight allylic hydrogens. Peak u at 1.8-1.95 ppm consistently represents three hydrogens. Peak v at 0.65-0.8 ppm corresponds to protons in the methyl group at the junction between cholesterol’s cyclopentane ring and acyl tail.
Several sterols, including dihydrocholesterol, 7-dehydroxycholesterol, epicholesterol, and 25-hydroxycholesterol, were rejected from our study because they were predicted to produce an insufficient number of non-overlapping 1H peaks for quantification of ratios of sterols to phospholipids.
Analysis
All data was processed within standard Bruker software. Specifically, the data was Fourier transformed with 0.3 Hz line broadening, then auto-phased and baseline corrected. All other analysis used original programs written in Matlab (The MathWorks, Natick MA) following the logic in figure 4. Briefly, in Step A, each peak that represents only the sterol or only the phospholipids (rather than all components) is normalized by dividing the peak’s area by the number of 1H that contribute to the peak. This step yields Asterol/#1Hsterol or APC/#1HPC. In Step B, all normalized phospholipid areas are averaged to yield < APC/#1HPC > and a standard deviation, SDPC. The term < APC/#1HPC > is subtracted from each peak that contains signals from both sterol and phospholipids. In Step C, all resulting sterol contributions are normalized. All sterol data are combined to yield an average normalized sterol area and standard deviation, < Asterol/#1Hsterol > ± SDsterol. The order of the steps minimizes uncertainty since SDsterol > SDPC. In Step D, the mole fraction of sterol is calculated as the normalized area due to only the sterol divided by the normalized area due to all components, or < Asterol/#1Hsterol > / [< Asterol/#1Hsterol > + 2 < APC/#1HPC >]. This term reflects a vesicle composition of 1:1:X DOPC/DPPC/sterol.
Figure 4.

Flow chart of data analysis for a sample containing 1:1:X of DOPC:DPPC:sterol. (A) Each peak that represents sterols and no phospholipids (the blue peaks marked with triangles: a-b, and f-g) or phospholipids and no sterols (the red peaks marked with circles: d-e and g-j ) is normalized by dividing the peak’s area, A, by the number of 1H that contribute to the peak. The normalized areas from step A are plotted as Asterol/#1Hsterol (blue triangles) in step C and APC/#1HPC (red circles) in step B. (B) The normalized phospholipid areas are combined to yield an average (horizontal line) and standard deviation, denoted < APC/#1HPC > ± SDPC. (C) For each peak containing signals from both sterol and phospholipids (the green peaks marked with squares: c, l, and m), the contribution due to phospholipids is subtracted. Each resulting cholesterol contribution is normalized to yield an additional value of Asterol/#1Hsterol (green squares), which is combined with the results from step B to yield an average and standard deviation < Asterol/#1Hsterol > ± SDsterol. (D) The mole fraction of sterol is calculated as the normalized area due to only the sterol divided by the normalized area due to all components, or < Asterol/#1Hsterol > / [< Asterol/#1Hsterol > + 2 < APC/#1HPC >], with errors propagated as described in the methods.
To test the procedure in figure 4, standards of lipid mixtures in ratios of 1:1:X DOPC:DPPC:sterol were made by mixing stock solutions in chloroform, drying the lipid mixtures under nitrogen gas, lyophilizing the lipids, and finally resuspending the lipids in deuterated chloroform. As expected, the fraction of sterol measured by NMR in each standard was within a few percent of the fraction originally mixed in each sample (fig. 2 insets). This result implies that our NMR analysis technique is sound.
When the procedure was repeated with electroformed vesicles, the data in figure 2 were generated. Each point in figure 2 denotes an individual experiment. Multiple points are shown for all experiments that were repeated. Error bars are not standard deviations from multiple experiments. Instead, error bars represent experimental uncertainties propagated according to the operations in figure 4 by assuming that the standard deviations in the sterol (SDsterol) and (SDPC) phospholipid measurements are independent and random 51. Experimentally, high uncertainties derive from difficulties in consistently measuring areas of NMR peaks. For example, at sterol concentrations above the solubility limit, uncertainties are high because the yield of electroformed vesicles is low. Propagated uncertainties were less than ±1.8 mol% for cholesterol, ±1.3% for lanosterol, ±2.5 mol% for ergosterol, ±1.6 mol% for stigmasterol, and ±6.0% for β-sitosterol. Uncertainties in the concentration of desmosterol within standards were unacceptably large, greater than ±14.2%, so we excluded desmosterol from our study.
Lipid Oxidation
We verified that a specific product of lipid oxidation, palmitoyl-azelaoyl PC (azPC), did not form in significant amounts during vesicle electroformation. azPC results from an oxidation reaction involving cleavage of the double bond in the lipid acyl chain to yield a carboxylic acid. When incorporated into vesicles at 2, 5, and 10 mol%, azPC produces a signature peak at 3.37ppm (fig. 5). Since vesicles into which no azPC was incorporated produce no measurable peak at 3.4ppm, our electroformation process oxidizes <2 mol% of unsaturated lipids through cleavage of acyl chains. Significant oxidation has been previously shown to alter lipid miscibility transition temperatures 49.
Figure 5.
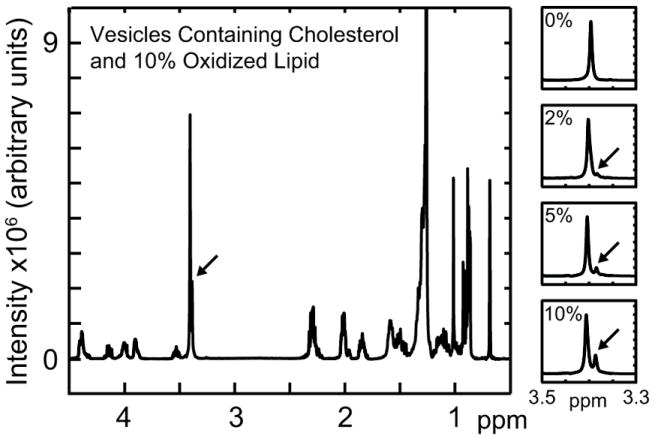
Panels at right show the emergence of a peak at ~3.4ppm (shown by arrows) due to increasing concentrations of the lipid oxidation product palmitoyl-azelaoyl PC (azPC) in electroformed vesicles of azPC:DOPC:DPPC:chol at 0/30/30/40, 2/28/30/40, 5/25/30/40, and 10/20/30/40. The main figure shows the peak at ~3.4ppm with relation to the full spectrum for 10/20/30/40 azPC:DOPC:DPPC:chol.
Acknowledgments
We thank Jim Bollinger, Jeffrey Buboltz, Loren Kruse, Paul Miller, and Sarah Veatch for helpful discussions and advice on experimental protocols. We thank Margaret Sheng-Ying Lo, Werner Kaminsky, and Gil Toombes for preliminary x-ray diffraction experiments. We thank Jake Ashcraft and Stephen Wassall for thoughtful comments on our manuscript. MMS was supported by a UW Arts and Sciences Undergraduate Research Award, two UW Mary Gates Scholar Awards (2007 and 2008), and a National Science Foundation REU award in conjunction with MCB-0133484 awarded to SLK. ARHS was supported by a UW Molecular Biophysics Training grant NIH #5 T32 GM08268-20 and a UW Center for Nanotechnology IGERT Award NSF #DGE-0504573. MMS, ARHS, and SLK acknowledge support from the National Science Foundation MCB-0744852.
References
- 1.Bloch K. In: Biochemistry of Lipids, Lipoproteins, and Membranes. Vance DE, Vance J, editors. Elsevier; Amsterdam: 1991. pp. 363–381. [Google Scholar]
- 2.Nes WR. Lipids. 1974;9:596–612. doi: 10.1007/BF02532509. [DOI] [PubMed] [Google Scholar]
- 3.Nielsen M, Thewalt J, Miao L, Ipsen JH, Bloom M, Zuckermann MJ, Mouritsen OG. Europhys Lett. 2000;52:368–374. [Google Scholar]
- 4.Miao L, Nielsen M, Thewalt J, Ipsen JH, Bloom M, Zuckermann MJ, Mouritsen OG. Biophys J. 2002;82:1429–1444. doi: 10.1016/S0006-3495(02)75497-0. [DOI] [PMC free article] [PubMed] [Google Scholar]
- 5.Kelley RI, Herman GE. Annu Rev Genet. 2001;2:299–341. doi: 10.1146/annurev.genom.2.1.299. [DOI] [PubMed] [Google Scholar]
- 6.Salen G, Horak I, Rothkopf M, Cohen JL, Speck J, Tint GS, Shore V, Dayal B, Chen T, Shefer S. J Lipid Res. 1985;26:1126–1133. [PubMed] [Google Scholar]
- 7.Gonçalves S, Maria AV, Silva-Herdade AS, Silva JME, Saldanha C. Nutrition Res. 2007;27:200–205. [Google Scholar]
- 8.Polagruto JA, Wang-Polagruto JF, Braun MM, Lee L, Kwik-Uribe C, Keen CL. J Am Diet Assoc. 2006;106:1804–1813. doi: 10.1016/j.jada.2006.08.012. [DOI] [PubMed] [Google Scholar]
- 9.Bradford PG, Awad AB. Mol Nut Food Res. 2007;51:161–170. doi: 10.1002/mnfr.200600164. [DOI] [PubMed] [Google Scholar]
- 10.Huang J, Buboltz JT, Feigenson GW. Biochim Biophys Acta. 1999;1417:89–100. doi: 10.1016/s0005-2736(98)00260-0. [DOI] [PubMed] [Google Scholar]
- 11.Feigenson GW. Annu Rev Bioph Biom. 2007;36:63–77. doi: 10.1146/annurev.biophys.36.040306.132721. [DOI] [PMC free article] [PubMed] [Google Scholar]
- 12.Brzustowicz MR, Cherezov V, Caffrey M, Stillwell W, Wassall SR. Biophys J. 2002;82:285–298. doi: 10.1016/S0006-3495(02)75394-0. [DOI] [PMC free article] [PubMed] [Google Scholar]
- 13.Brzustowicz MR, Cherezov V, Zerouga M, Caffrey M, Stillwell W, Wassall SR. Biochemistry. 2002;41:12509–12519. doi: 10.1021/bi0262808. [DOI] [PubMed] [Google Scholar]
- 14.Mannock DA, Lewis RNAH, McElhaney RN. Biochim Biophys Acta. 2010;1798:376. doi: 10.1016/j.bbamem.2009.09.002. [DOI] [PubMed] [Google Scholar]
- 15.Hsueh Y-W, Chen M-T, Patty PJ, Code C, Cheng J, Frisken BJ, Zuckermann M, Thewalt J. Biophys J. 2007;92:1606–1615. doi: 10.1529/biophysj.106.097345. [DOI] [PMC free article] [PubMed] [Google Scholar]
- 16.Urbina JA, Pekerar S, Le H-B, Patterson J, Montez B, Oldfield E. Biochim Biophys Acta. 1995;1238:163–176. doi: 10.1016/0005-2736(95)00117-l. [DOI] [PubMed] [Google Scholar]
- 17.Angelova MI, Soléau S, Méléard P, Faucon JF, Bothorel P. Progr Colloid Polym Sci. 1992;89:127–131. [Google Scholar]
- 18.Veatch SL, Keller SL. Biophys J. 2003;85:3074–3083. doi: 10.1016/S0006-3495(03)74726-2. [DOI] [PMC free article] [PubMed] [Google Scholar]
- 19.Scherfeld D, Kahya N, Schwille P. Biophys J. 2003;85:3758–3768. doi: 10.1016/S0006-3495(03)74791-2. [DOI] [PMC free article] [PubMed] [Google Scholar]
- 20.Pencer J, Mills T, Anghel V, Krueger S, Epand RM, Katsaras J. Eur Phys J E. 2005;18:447–458. doi: 10.1140/epje/e2005-00046-5. [DOI] [PubMed] [Google Scholar]
- 21.Beattie ME, Veatch SL, Stottrup BL, Keller SL. Biophys J. 2005;89:1760–1768. doi: 10.1529/biophysj.104.049635. [DOI] [PMC free article] [PubMed] [Google Scholar]
- 22.Bacia K, Schwille P, Kurzchalia T. Proc Natl Acad Sci USA. 2005;102:3272–3277. doi: 10.1073/pnas.0408215102. [DOI] [PMC free article] [PubMed] [Google Scholar]
- 23.Halling KK, Slotte JP. Biochim Biophys Acta. 2004;1664:161–171. doi: 10.1016/j.bbamem.2004.05.006. [DOI] [PubMed] [Google Scholar]
- 24.Wu R, Chen L, Yu Z, Quinn PJ. Biochim Biophys Acta. 2006;1758:764–771. doi: 10.1016/j.bbamem.2006.04.017. [DOI] [PubMed] [Google Scholar]
- 25.Xu X, Bittman R, Duportail G, Heissler D, Vilcheze C, London E. J Biol Chem. 2001;276:33540–33546. doi: 10.1074/jbc.M104776200. [DOI] [PubMed] [Google Scholar]
- 26.Huang J, Feigenson GW. Biophys J. 1999;76:2142–2157. doi: 10.1016/S0006-3495(99)77369-8. [DOI] [PMC free article] [PubMed] [Google Scholar]
- 27.Gershfeld NL. Biophys J. 1978;22:469–488. doi: 10.1016/S0006-3495(78)85500-3. [DOI] [PMC free article] [PubMed] [Google Scholar]
- 28.Subramaniam S, McConnell HM. J Phys Chem. 1987;91:1715–1718. [Google Scholar]
- 29.Radhakrishnan A, McConnell HM. Biophys J. 1999;77:1507–1517. doi: 10.1016/S0006-3495(99)76998-5. [DOI] [PMC free article] [PubMed] [Google Scholar]
- 30.Chong PL. Proc Natl Acad Sci USA. 1994;91:10069–10073. doi: 10.1073/pnas.91.21.10069. [DOI] [PMC free article] [PubMed] [Google Scholar]
- 31.Kucerka N, Marquardt D, Harroun TA, Nieh M-P, Wassall SR, Katsaras J. J Am Chem Soc. 2009;131:16358. doi: 10.1021/ja907659u. [DOI] [PubMed] [Google Scholar]
- 32.Oradd G, Shahedi V, Lindblom G. Biochim Biophys Acta. 2009;1788:1762. doi: 10.1016/j.bbamem.2009.06.019. [DOI] [PubMed] [Google Scholar]
- 33.Shahedi V, Orädd G, Lindblom G. Biophys J. 2006;91:2501–2507. doi: 10.1529/biophysj.106.085480. [DOI] [PMC free article] [PubMed] [Google Scholar]
- 34.Barenholz Y. Prog Lipid Res. 2002;41:1–5. doi: 10.1016/s0163-7827(01)00016-9. [DOI] [PubMed] [Google Scholar]
- 35.Huang C. Chem Phys Lipids. 1977;19:150–158. doi: 10.1016/0009-3084(77)90095-0. [DOI] [PubMed] [Google Scholar]
- 36.Shaghaghi M, Zuckermann MJ, Thewalt J. Biophys J. 2009;96:606a. doi: 10.1016/j.bpj.2018.01.024. [DOI] [PMC free article] [PubMed] [Google Scholar]
- 37.Demel RA, Bruckdorfer KR, Van Deenen LLM. Biochim Biophys Acta. 1972;255:311–320. doi: 10.1016/0005-2736(72)90030-2. [DOI] [PubMed] [Google Scholar]
- 38.Cao H, Tokutake N, Regen SL. J Am Chem Soc. 2003;125:16182–16183. doi: 10.1021/ja039172x. [DOI] [PubMed] [Google Scholar]
- 39.Angelova MI. Bulgarian Academy of Sciences. 1988 [Google Scholar]
- 40.Epand RM, Hughes DW, Sayer BG, Borochov N, Bach D, Wachtel E. Biochim Biophys Acta. 2003;1616:196–208. doi: 10.1016/j.bbamem.2003.08.006. [DOI] [PubMed] [Google Scholar]
- 41.Epand RM, Bain AD, Sayer BG, Bach D, Wachtel E. Biophys J. 2002;83:2053–2063. doi: 10.1016/S0006-3495(02)73966-0. [DOI] [PMC free article] [PubMed] [Google Scholar]
- 42.Shaikh SR, Cherezov V, Caffrey M, Soni SP, LoCascio D, Stillwell W, Wassall SR. J Am Chem Soc. 2006;128:5375–5383. doi: 10.1021/ja057949b. [DOI] [PubMed] [Google Scholar]
- 43.Hirai M, Koizumi M, Hirai H, Hayakawa T, Yuyama K, Suzuki N, Kasahara K. J Phys: Condens Matter. 2005;17:2965–S2977. [Google Scholar]
- 44.Buboltz J, Huang JY, Feigenson GW. Biophys J. 1996;70:SU337. [Google Scholar]
- 45.Veatch SL, Soubias O, Keller SL, Gawrisch K. Proc Natl Acad Sci USA. 2007;104:17650–17655. doi: 10.1073/pnas.0703513104. [DOI] [PMC free article] [PubMed] [Google Scholar]
- 46.Stachiowiak JC, Richmond DL, Li TH, Liu AP, Parekh SH, Fletcher DA. Proc Natl Acad Sci USA. 2008;105:4697–4702. doi: 10.1073/pnas.0710875105. [DOI] [PMC free article] [PubMed] [Google Scholar]
- 47.Fidorra M, Garcia A, Ipsen JH, Härtel S, Bagatolli LA. Biochim Biophys Acta. 2009;1788:2142–2149. doi: 10.1016/j.bbamem.2009.08.006. [DOI] [PubMed] [Google Scholar]
- 48.Juhasz J, Sharom FJ, Davis JH. Biochim Biophys Acta. 2009;1788:2541–2522. doi: 10.1016/j.bbamem.2009.10.006. [DOI] [PubMed] [Google Scholar]
- 49.Veatch SL, Keller SL. Biochim Biophys Acta. 2005;1746:172–185. doi: 10.1016/j.bbamcr.2005.06.010. [DOI] [PubMed] [Google Scholar]
- 50.Buboltz J. personal communication [Google Scholar]
- 51.Taylor JR. An Introduction to Error Analysis, 2nd Edition. University Science Books; Sausalito, CA: 1997. [Google Scholar]