Abstract
Drusen are extracellular deposits that accumulate between the retinal pigment epithelium and Bruch’s membrane. They are one of the earliest clinical manifestations of age-related macular degeneration and it is thought that they disrupt the overlying photoreceptors, leading to subsequent vision loss. The purpose of this study was to illustrate how spectral domain optical coherence tomography and adaptive optics fundus imaging can be used to quantitatively analyze the integrity of the overlying photoreceptors in a single subject with macular drusen. This imaging approach and the image analysis metrics introduced may serve as the foundation for valuable imaging-based biomarkers for detecting the earliest stages of disease, tracking progression, and monitoring treatment response.
INTRODUCTION
Spectral domain optical coherence tomography (SD-OCT) enables non-invasive, high-resolution visualization of the normal and pathological retina.1 This imaging modality has been used extensively to characterize drusen structure in age-related macular degeneration (AMD).2-5 It has been shown histologically that photoreceptors overlying and distal to drusen undergo degeneration.6 Using SD-OCT, photoreceptor layer thinning over drusen has recently been reported and proposed to reflect photoreceptor degeneration.7 More direct visualization of the photoreceptor mosaic is afforded by the use of adaptive optics.8 This technique has been used to image the cone mosaic surrounding drusen, but no quantitative analysis was undertaken.9 We used adaptive optics imaging to directly quantify the integrity of the cone photoreceptor mosaic in a patient with drusen, and used SD-OCT to assess the thickness of the inner segment/outer segment (IS/OS) layers compared with previous normative data.10
CASE REPORT
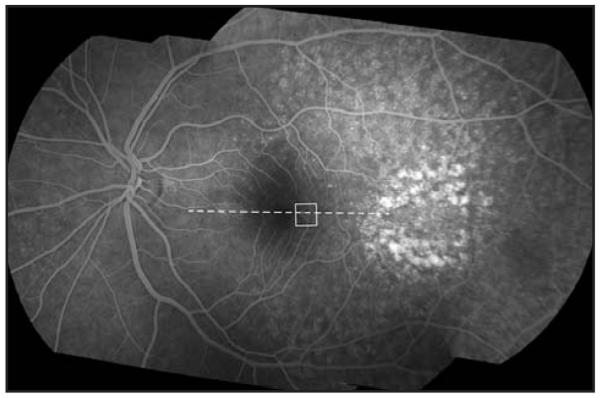
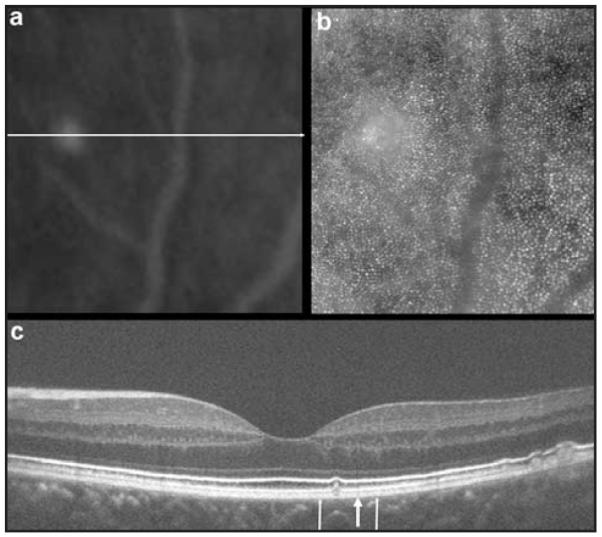
A 45-year-old asymptomatic woman was found to have retinal features consistent with basal laminar drusen on clinical examination. Blood pressure, urine dipstick, and renal function were all normal. Visual acuity without correction was 6/5 bilaterally. Fundus fluorescein angiography revealed multiple hyper-fluorescent soft and hard drusen scattered throughout the fundus (more numerous and extensive than seen ophthalmoscopically), with a greater concentration temporal to the macula (Fig. 1). Macular thickness and retinal nerve fiber layer thickness measured on the Cirrus HD-OCT (Carl Zeiss Meditec, Dublin, CA) was within the system’s normal limits. High-resolution images of the macula were obtained using a Bioptigen SD-OCT (Bioptigen, Durham, NC) equipped with a 878-nm (186-nm bandwidth) light source.11 A high-density 6 × 6-mm volume scan (1,000 A-scans/B-scan, 150 B-scans) from the patient’s left eye revealed a small, discrete drusen at 1.75° temporal to the fovea. At this location, images of the cone photoreceptor mosaic were obtained using a high-speed adaptive optics fundus camera.10,12,13 Individual frames were registered and averaged to increase the signal-to-noise ratio for the final image, as previously described.14 Figure 2 illustrates the co-registered fundus fluorescein angiography and adaptive optics images over the drusen, along with the corresponding SD-OCT image, performed using i2k Align Retina software (DualAlign, LLC, Clifton Park, NY) and Adobe Photoshop (Adobe Systems Inc., San Jose, CA).
Figure 1.

Fundus fluorescein angiography montage of the patient’s left eye. Individual images were montaged using i2k Align Retina software (DualAlign, LLC, Clifton Park, NY). The white box indicates the area of the cone mosaic displayed in Figure 2 and the dashed line indicates the location of spectral domain optical coherence tomography scan shown in Figure 2.
Figure 2.

Multimodal imaging of the retina. (A) Fundus fluorescein angiography and (B) adaptive optics images of the same patch of retina. (C) High-resolution spectral domain optical coherence tomography (SD-OCT) images using a broadband illumination with the Bioptigen SD-OCT system (Bioptigen, Durham, NC) showing retinal pigment epithelium excrescences with underlying moderately reflective material consistent with drusen. Image was taken at the location of the horizontal line (A). Thin vertical arrows (C) represent the boundary of the retinal area imaged (A and B). The blood vessel temporal to the drusen (A and B) can be seen in the SD-OCT image (C) as a vertical shadow above the large arrow, especially visible between the external limiting membrane and retinal pigment epithelium layers.
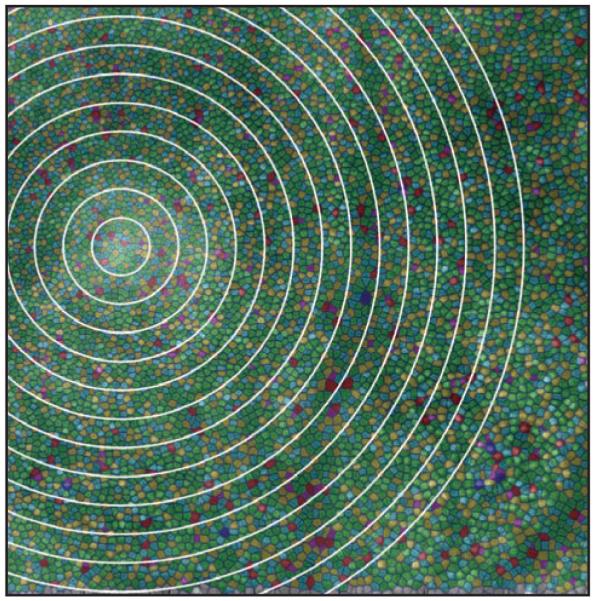
Individual cones were identified using automated software,15 and cone density was subsequently analyzed using previously described methods.14 Although the contrast of the cone mosaic appears reduced over the drusen, cone density at this location (39,133 cones/mm2) was not significantly decreased compared with previously published normative data from our group (mean ± 2 standard deviation [SD] = 41,974 ± 6,972 cones/mm2).13 We used a previously described Voronoi analysis16 to examine mosaic regularity (Fig. 3), comparing the geometry of the cones within 50 μm of the drusen and cones within 50-μm wide annular rings moving away from the drusen (ie, cones between 50 and 100 μm, between 100 and 150 μm, and so on). For the cones within 50 μm of the drusen, 45% had 6-sided Voronoi domains. For each of the other 50-μm annular rings, between 32% and 53% of the cones had 6-sided Voronoi domains (mean = 46%). In addition, the mean number of sides to the Voronoi domains for the cones within each 50-μm annular ring compared with that of the cones within 50 μm of the drusen was not significantly different (P = .9959, Kruskal–Wallis analysis of variance). Thus, we concluded that the mosaic immediately overlying the drusen is regularly arranged, consistent with no significant cone loss.
Figure 3.

Analysis of mosaic regularity analysis. Shown are the Voronoi boundaries associated with each cone identified using the automated program of Li and Roorda.15 Green color indicates Voronoi domains with 6 sides, reflecting hexagonal/triangular packing of the cone mosaic. Other colors indicate domains with greater or fewer than 6 sides and qualitative disruption can be seen overlying the larger vertical blood vessel where the cone mosaic was not completely resolved. White circles represent the boundaries of the 50-μm wide annular rings used to compare the regularity of the mosaic directly over the drusen with that elsewhere in the image.
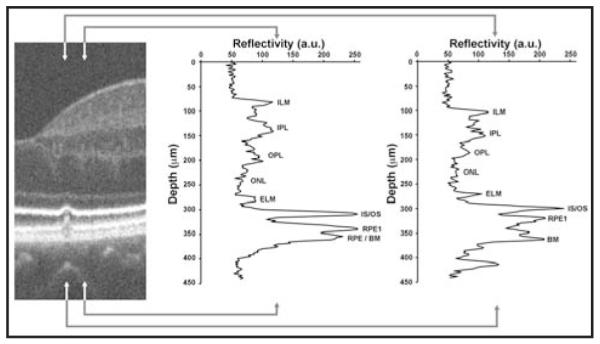
Longitudinal reflectivity profile analysis of the SD-OCT images (Fig. 4) revealed that the inner-segment layer (distance between the external limiting membrane and IS/OS layer) was of normal thickness both directly above the druse and immediately adjacent to it, compared with 167 previously published normals.10 The outer-segment layer (distance between IS/OS and retinal pigment epithelium layers) was normal (30 μm) immediately adjacent to the druse, but significantly thinner (18.2 μm, normal mean ± 2 SD is 32 ± 1.11 μm) directly above the druse. Although outer-segment shortening has been reported using fundus reflectometry techniques,17 the apparent thinning of the outer segment we observed on SD-OCT could be due to a shortening of the outer segment or to a splaying of the outer segment that is secondary to the volume occupied by the druse itself.
Figure 4.

Disruption of the inner segment/outer segment (IS/OS) layers. On the left is a segment of the spectral domain optical coherence tomography (SD-OCT) image centered on the 65-μm wide druse. Longitudinal reflectivity profiles have been plotted for the area of retina between the arrowheads. The middle plot shows normal-appearing retinal layers just temporal to the druse. In the SD-OCT images, the gray scale represents signal amplitude: low reflecting layers indicate nuclear layers, whereas high reflectivity typically comes from synaptic layers in the healthy retina. Assignment of layers is based on literature consensus.29-31 The right plot shows significant thinning of the outer segment layer (distance between IS/OS and the first retinal pigment epithelium [RPE1] layers). The distance between RPE1 and Bruch’s membrane (BM) is presumably occupied by the druse. The IS/OS layer itself appeared attenuated or “pinched,” being 30% thinner (full-width half maximum) directly above the druse compared to immediately adjacent to the druse. ILM = inner limiting membrane; OPL = outer plexiform layer; ELM = external limiting membrane; IPL = inner plexiform layer; ONL = outer nuclear layer; a. u. = arbitrary units.
DISCUSSION
AMD is a progressive degenerative disorder leading to gradual deterioration of central vision over many years and represents the most common cause of blindness in the developed world. One of the early clinical features in the progression of AMD is the appearance of drusen. Patients with early stages of AMD often have no symptoms and the ability to predict the rate of progression is currently markedly limited. Accurate, high-resolution biomarkers are needed to help in the identification of individuals in the earliest stages of macular degeneration and also those who are likely to progress rapidly and may benefit most from more intensive observation and management. The development of imaging-based biomarkers to detect AMD at its earliest stages may also have an important role in the assessment of early preventative interventions that are likely to become available in the near future. By monitoring early drusen over time using imaging tools such as SD-OCT and adaptive optics, their progression both in terms of size and their direct effect on the overlying retinal layers and photoreceptor mosaic can be quantified. In our case, we imaged an undisrupted photoreceptor mosaic overlying the early druse with normal regularity and cone density, giving us valuable information about the status of the photoreceptors at an early stage.
When trying to detect a druse, OCT or polarization imaging18 may be superior to adaptive optics imaging. However, when trying to directly examine the integrity of the photoreceptor mosaic at the single cell level, then adaptive optics imaging is needed. Accepting that these imaging modalities are complementary, one can shift focus to the challenge of developing image processing tools that enable easy and accurate integration of data from multiple imaging modalities. An alternate approach is to physically combine the two imaging modalities. Although not available commercially, several have developed adaptive optics-OCT systems capable of imaging the cone photoreceptor mosaic.19-22 Recently, one of these devices was used to evaluate the integrity of the cone mosaic at various depths throughout the length of the cone in a case where there was disruption of the cone mosaic.23 In addition, high-speed OCT systems without adaptive optics have been shown to be able to resolve the peripheral cone mosaic.24 The fact that the mosaic in our patient was visible across the entire surface of the druse shows that, despite morphological disruption on OCT (secondary to either outer-segment shortening or splaying), the cones were still present. Thus, in our case adaptive optics was used to interpret the SD-OCT images. There may be cases where SD-OCT can be used to interpret adaptive optics images or where polarization images could be used to interpret adaptive optics or SD-OCT images.
Obtaining functional data to correlate with the high-resolution structural information that can now be obtained represents an important area of research, including the use of microperimetry25 to determine whether cone function has been altered. Microperimetry techniques that incorporate adaptive optics may be required to spatially constrain the stimulus to a specific subset of cones.26,27 In addition, it would be of interest to examine adaptive optics autofluorescence images in such patients to examine the integrity of the retinal pigment epithelium mosaic, especially in light of the fact that it has been shown that drusen can be associated with retinal pigment epithelium damage even peripheral to the drusen.28 The rapid continued advances in imaging and image analysis, together with the potential to correlate this with novel functional techniques, is likely to have an important role both in patient selection and in the evaluation of current and future treatments for AMD.
Acknowledgments
Supported by grants from the NIH (EY001931 & EY017607), The Posner Foundation, The E. Matilda Ziegler Foundation for the Blind, RD & Linda Peters Foundation, Hope for Vision, an unrestricted grant from Research to Prevent Blindness, Moorfields Special Trustees and the National Institute for Health Research UK to the Biomedical Research Centre for Ophthalmology based at Moorfields Eye Hospital NHS Foundation Trust and UCL Institute of Ophthalmology. Dr. Carroll is the recipient of a Career Development Award from Research to Prevent Blindness. This investigation was conducted in a facility constructed with support from Research Facilities Improvement Program Grant Number C06 RR-RR016511 from the National Center for Research Resources, National Institutes of Health.
Footnotes
The authors have no financial or proprietary interest in the materials presented herein.
REFERENCES
- 1.Drexler W, Fujimoto J. State-of-the-art retinal optical coherence tomography. Prog Retin Eye Res. 2008;27:45–88. doi: 10.1016/j.preteyeres.2007.07.005. [DOI] [PubMed] [Google Scholar]
- 2.Pieroni CG, Witkin AJ, Ko TH, et al. Ultrahigh resolution optical coherence tomography in non-exudative age related macular degeneration. Br J Ophthalmol. 2006;90:191–197. doi: 10.1136/bjo.2005.076612. [DOI] [PMC free article] [PubMed] [Google Scholar]
- 3.Yi K, Mujat M, Park BH, et al. Spectral domain optical coherence tomography for qualitative evaluation of drusen and associated structural changes in non-neovascular age-related macular degeneration. Br J Ophthalmol. 2009;93:176–181. doi: 10.1136/bjo.2008.137356. [DOI] [PMC free article] [PubMed] [Google Scholar]
- 4.Chen Y, Vuong LN, Liu J, et al. Three-dimension ultrahigh resolution optical coherence tomography imaging of age-related macular degeneration. Opt Express. 2009;17:4046–4060. doi: 10.1364/oe.17.004046. [DOI] [PMC free article] [PubMed] [Google Scholar]
- 5.Khanifar AA, Koreishi AF, Izatt JA, Toth CA. Drusen ultrastructure imaging with spectral domain optical coherence tomography in age-related macular degeneration. Ophthalmology. 2008;115:1883–1890. doi: 10.1016/j.ophtha.2008.04.041. [DOI] [PMC free article] [PubMed] [Google Scholar]
- 6.Johnson PT, Brown MN, Pulliam BC, Anderson DH, Johnson LV. Synaptic pathology, altered gene expression, and degeneration in photoreceptors impacted by drusen. Invest Ophthalmol Vis Sci. 2005;46:4788–4795. doi: 10.1167/iovs.05-0767. [DOI] [PubMed] [Google Scholar]
- 7.Schuman SG, Koreishi AF, Farsiu S, Jung SH, Izatt JA, Toth CA. Photoreceptor layer thinning over drusen in eyes with age-related macular degeneration imaged in vivo with spectral-domain optical coherence tomography. Ophthalmology. 2009;116:488–496. e482. doi: 10.1016/j.ophtha.2008.10.006. [DOI] [PMC free article] [PubMed] [Google Scholar]
- 8.Miller DT, Williams DR, Morris GM, Liang J. Images of cone photoreceptors in the living human eye. Vision Res. 1996;36:1067–1079. doi: 10.1016/0042-6989(95)00225-1. [DOI] [PubMed] [Google Scholar]
- 9.Massamba N, Basurto A, Lamory B, Parier V, Soubrane G. In vivo microscopy of macular soft drusen using advanced optics. Invest Ophthalmol Vis Sci. 2009;50 ARVO E-Abstract 3300. [Google Scholar]
- 10.McAllister JT, Dubis AM, Tait DM, et al. Arrested development: high-resolution imaging of foveal morphology in albinism. Vision Res. 2010;50:810–817. doi: 10.1016/j.visres.2010.02.003. [DOI] [PMC free article] [PubMed] [Google Scholar]
- 11.Tanna H, Dubis AM, Ayub N, et al. Retinal imaging using commercial broadband optical coherence tomography. Br J Ophthalmol. 2010;94:372–376. doi: 10.1136/bjo.2009.163501. [DOI] [PMC free article] [PubMed] [Google Scholar]
- 12.Rha J, Schroeder B, Godara P, Carroll J. Variable optical activation of human cone photoreceptors visualized using a short coherence light source. Opt Lett. 2009;34:3782–3784. doi: 10.1364/OL.34.003782. [DOI] [PMC free article] [PubMed] [Google Scholar]
- 13.Carroll J, Baraas RC, Wagner-Schuman M, et al. Cone photoreceptor mosaic disruption associated with Cys203Arg mutation in the M-cone opsin. Proc Natl Acad Sci U S A. 2009;106:20948–20953. doi: 10.1073/pnas.0910128106. [DOI] [PMC free article] [PubMed] [Google Scholar]
- 14.Carroll J, Neitz M, Hofer H, Neitz J, Williams DR. Functional photoreceptor loss revealed with adaptive optics: an alternate cause for color blindness. Proc Natl Acad Sci U S A. 2004;101:8461–8466. doi: 10.1073/pnas.0401440101. [DOI] [PMC free article] [PubMed] [Google Scholar]
- 15.Li KY, Roorda A. Automated identification of cone photoreceptors in adaptive optics retinal images. J Opt Soc Am A Opt Image Sci Vis. 2007;24:1358–1363. doi: 10.1364/josaa.24.001358. [DOI] [PubMed] [Google Scholar]
- 16.Baraas RC, Carroll J, Gunther KL, et al. Adaptive optics retinal imaging reveals S-cone dystrophy in tritan color-vision deficiency. J Opt Soc Am A Opt Image Sci Vis. 2007;24:1438–1447. doi: 10.1364/josaa.24.001438. [DOI] [PMC free article] [PubMed] [Google Scholar]
- 17.Kanis MJ, Wisse RP, Berendschot TT, van de Kraats J, van Norren D. Foveal cone-photoreceptor integrity in aging macula disorder. Invest Ophthalmol Vis Sci. 2008;49:2077–2081. doi: 10.1167/iovs.07-1181. [DOI] [PubMed] [Google Scholar]
- 18.Burns SA, Elsner AE, Mellem-Kairala MB, Simmons RB. Improved contrast of subretinal structures using polarization analysis. Invest Ophthalmol Vis Sci. 2003;44:4061–4068. doi: 10.1167/iovs.03-0124. [DOI] [PMC free article] [PubMed] [Google Scholar]
- 19.Hermann B, Fernández EJ, Unterhuber A, et al. Adaptive-optics ultrahigh-resolution optical coherence tomography. Opt Lett. 2004;29:2142–2144. doi: 10.1364/ol.29.002142. [DOI] [PubMed] [Google Scholar]
- 20.Mujat M, Ferguson RD, Patel AH, et al. High resolution multimodal clinical ophthalmic imaging system. Opt Express. 2010;18:11607–11621. doi: 10.1364/OE.18.011607. [DOI] [PMC free article] [PubMed] [Google Scholar]
- 21.Zhang Y, Cense B, Rha J, et al. High-speed volumetric imaging of cone photoreceptors with adaptive optics spectral-domain optical coherence tomography. Opt Express. 2006;14:4380–4394. doi: 10.1364/OE.14.004380. [DOI] [PMC free article] [PubMed] [Google Scholar]
- 22.Pircher M, Zawadzki RJ, Evan JW, Werner JS, Hitzenberger CK. Simultaneous imaging of human cone mosaic with adaptive optics enhanced scanning laser ophthalmoscopy and high-speed transversal scanning optical coherence tomography. Opt Lett. 2008;33:22–24. doi: 10.1364/ol.33.000022. [DOI] [PMC free article] [PubMed] [Google Scholar]
- 23.Torti C, Povazay B, Hofer B, et al. Adaptive optics optical coherence tomography at 120,000 depth scans/s for non-invasive cellular phenotyping of the living human retina. Opt Express. 2009;17:19382–19400. doi: 10.1364/OE.17.019382. [DOI] [PMC free article] [PubMed] [Google Scholar]
- 24.Potsaid B, Gorczynska I, Srinivasan VJ, et al. Ultrahigh speed spectral / Fourier domain OCT ophthalmic imaging at 70,000 to 312,500 axial scans per second. Opt Express. 2008;16:15149–15169. doi: 10.1364/oe.16.015149. [DOI] [PMC free article] [PubMed] [Google Scholar]
- 25.Duncan JL, Zhang Y, Gandhi J, et al. High-resolution imaging with adaptive optics in patients with inherited retinal degeneration. Invest Ophthalmol Vis Sci. 2007;48:3283–3291. doi: 10.1167/iovs.06-1422. [DOI] [PubMed] [Google Scholar]
- 26.Makous W, Carroll J, Wolfing JI, Lin J, Christie N, Williams DR. Retinal microscotomas revealed with adaptive-optics microflashes. Invest Ophthalmol Vis Sci. 2006;47:4160–4167. doi: 10.1167/iovs.05-1195. [DOI] [PubMed] [Google Scholar]
- 27.Sincich LC, Zhang Y, Tiruveedhula P, Horton JC, Roorda A. Resolving single cone inputs to visual receptive fields. Nat Neurosci. 2009;12:967–969. doi: 10.1038/nn.2352. [DOI] [PMC free article] [PubMed] [Google Scholar]
- 28.Al-Hussaini H, Schneiders M, Lundh P, Jeffery G. Drusen are associated with local and distant disruptions to human retinal pigment epithelium cells. Exp Eye Res. 2009;88:610–612. doi: 10.1016/j.exer.2008.09.021. [DOI] [PubMed] [Google Scholar]
- 29.Gloesmann M, Hermann B, Schubert C, Sattmann H, Ahnelt PK, Drexler W. Histologic correlation of pig retina radial stratification with ultrahigh-resolution optical coherence tomography. Invest Ophthalmol Vis Sci. 2003;44:1696–1703. doi: 10.1167/iovs.02-0654. [DOI] [PubMed] [Google Scholar]
- 30.Pianta MJ. A more coherent relationship between optical coherence tomography scans and retinal anatomy. Clin Exp Optom. 2008;91:327–329. doi: 10.1111/j.1444-0938.2008.00265.x. [DOI] [PubMed] [Google Scholar]
- 31.Srinivasan VJ, Monson BK, Wojtkowski M, et al. Characterization of outer retinal morphology with high-speed, ultrahigh-resolution optical coherence tomography. Invest Ophthalmol Vis Sci. 2008;49:1571–1579. doi: 10.1167/iovs.07-0838. [DOI] [PMC free article] [PubMed] [Google Scholar]


