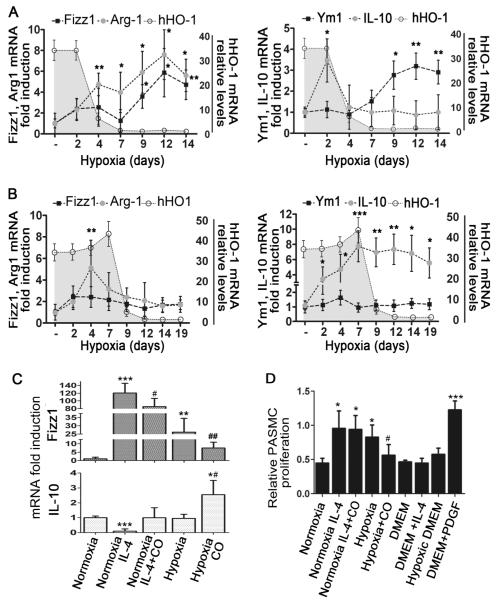
Figure 8. The role of macrophage activation profile in the development of HPH.
[A] After a two-day pulse of dox and four days after HO-1 dropped to baseline, a pattern of alternative macrophage activation ensues (increased expression of Fizz-1, Arg1, Ym1), whereas IL-10 levels remained low. [B] After a seven-day pulse with dox, even when HO-1 levels return to baseline, high IL-10 expression persists. Shaded areas represent levels of hHO-1 transgene expression. [C] Fizz1 and IL-10 mRNA levels are shown in primary alveolar macrophages exposed to hypoxia or IL-4 (20 ng/ml) with or without CO. [D] Effect of macrophage supernatants from different treatments on PASMC proliferation. PDGF-BB (25 ng/ml) was used as positive control and cell culture medium (DMEM) or medium exposed to 0.5% Oxygen for 48 hours (hypoxic DMEM) as negative controls. Numbers represent mean +/−SD, n≥6 animals or wells per group. *: relative to normoxia; *p<0.05, **p<0.01, ***p<0.001. #: relative to hypoxia-dox; #p<0.05, ##p<0.01.

