Abstract
A high-order nonlinear dynamic model of the input–output properties of single hippocampal CA1 pyramidal neurons was developed based on synaptically driven intracellular activity. The purpose of this study is to construct a model that: 1) can capture the nonlinear dynamics of both subthreshold activities [postsynaptic potentials (PSPs)] and suprathreshold activities (action potentials) in a single formalism; 2) is sufficiently general to be applied to any spike-input and spike-output neurons (point process input and point process output neural systems); and 3) is computationally efficient. The model consisted of three major components: 1) feedforward kernels (up to third order) that transform presynaptic action potentials into PSPs; 2) a constant threshold, above which action potentials are generated; and 3) a feedback kernel (first order) that describes spike-triggered after-potentials. The model was applied to CA1 pyramidal cells, as they were electrically stimulated with broadband Poisson random impulse trains through the Schaffer collaterals. The random impulse trains used here have physiological properties similar to spiking patterns observed in CA3 hippocampal neurons. PSPs and action potentials were recorded from the soma of CA1 pyramidal neurons using whole-cell patch-clamp recording. We evaluated the model performance separately with respect to PSP waveforms and the occurrence of spikes. The average normalized mean square error of PSP prediction is 14.4%. The average spike prediction error rate is 18.8%. In summary, although prediction errors still could be reduced, the model successfully captures the majority of high-order nonlinear dynamics of the single-neuron intracellular activity. The model captures the general biophysical processes with a small set of open parameters that are directly constrained by the intracellular recording, and thus, can be easily applied to any spike-input and spike-output neuron.
Index Terms: Hippocampus, Laguerre expansions, neuron model, nonlinear dynamics, Volterra kernels, whole-cell patch clamp
I. Introduction
Different approaches have been used to mathematically model single neurons in the brain [1]–[3]. The particular approach used depends largely on the purposes of the modeling study [4]–[6]. Some models investigate mechanisms underlying biophysical properties of neurons [7]–[13], e.g., compartmental models; some aim to quantify functional interactions among the broad range of mechanisms found in neurons, i.e., input–output modeling [14]–[20]; and others pursue computational efficiency for large-scale simulation [21]–[25]. A neuron is an extremely complex entity. The goal of the mathematical analysis requires a choice among modeling methodologies. Achieving one goal with a specific method often means compromising for others. For example, understanding detailed mechanisms underlying biophysical processes is often not compatible with computational efficiency and large-scale simulation. Capturing input–output transformation is usually not congruent with identifying the individual role of an electrophysiological mechanism. In addition to modeling purposes, the experimental preparation and the nature of collected data also contribute to variations of modeling methodologies. Our goal, in this paper, is to develop a single-neuron model that: 1) can capture nonlinear dynamics of single-neuron subthreshold [postsynaptic potentials (PSPs)] and suprathreshold (action potentials) activities; 2) has a general structure, and thus, can be applied to any spike-input and spike-output neuron; and 3) is computationally efficient.
The transformation of spike trains between neurons is a complex process that involves calcium influx in presynaptic terminal, presynaptic vesicle release of neurotransmitter, postsynaptic transduction, synaptic integration, somatic integration and action potential formation, action potential backpropagation into the dendritic arbors, and retrograde signaling toward the presynaptic terminal. All these mechanisms interactively contribute to the nonlinear and dynamical characteristics of neuron-to-neuron spike train transformation. To characterize this transformation, the concerns are twofold. First, how to design an experimental paradigm to collect information-rich input–output data sets that contain interactions among the mechanisms mentioned as many as possible? Second, how to construct a model that can characterize neuron nonlinear input–output transformation based on the experimental data with minimum assumptions to avoid the bias of partial knowledge?
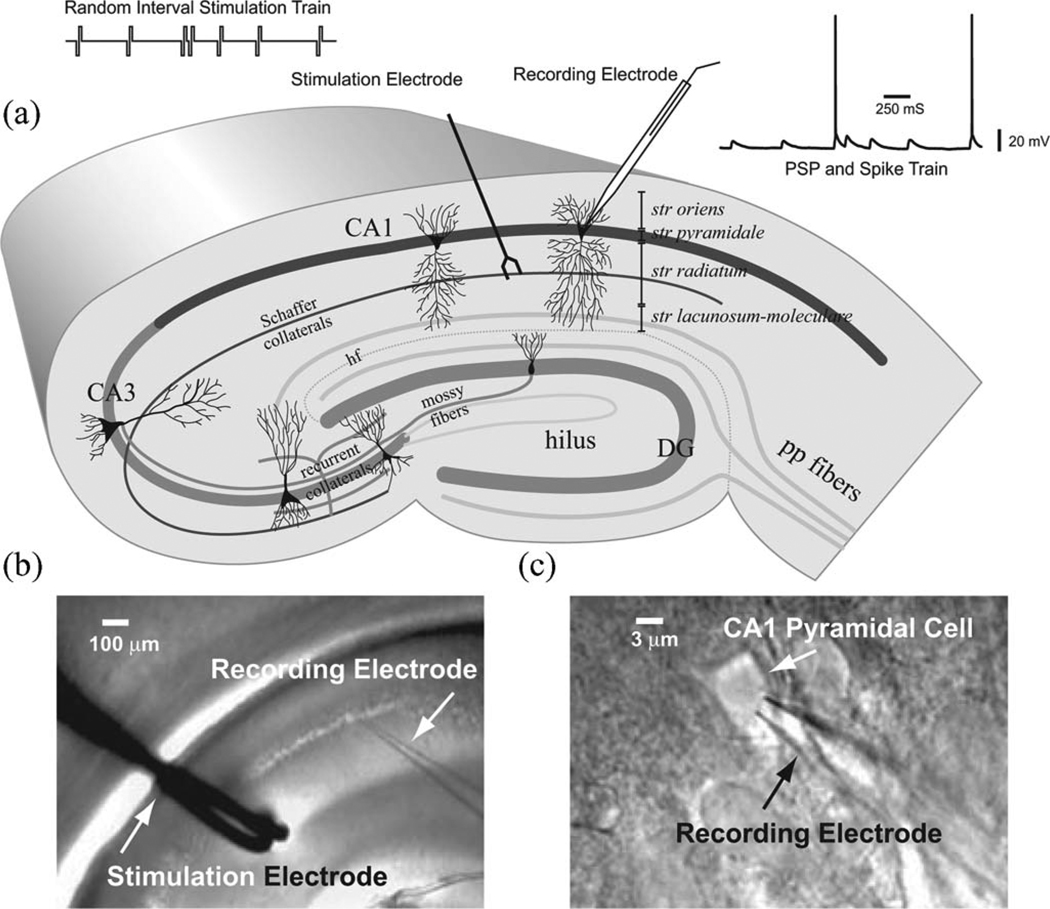
To meet these requirements, broadband stimulation trains of single all-or-none pulses were delivered to the synaptic region of CA1, the stratum radiatum containing Shaffer collaterals (SCs) [see Fig. 1(a)]. The all-or-none stimulation pulses mimic the action potentials, the most common form of input and output signal in biological neural systems. The interpulse intervals of the stimulation trains follow a broadband distribution. These broadband stimuli can elicit broad range of physiological responses and nonlinearities that are resulted from the interactions of the subcellular neuron processes mentioned earlier [26]–[29]. This paradigm mimics the natural condition in biological nervous system and elicits most of the neuronal processes mentioned earlier as opposed to other simpler paradigms, e.g., somatic current injection stimulation paradigm, which involves a smaller subset of all possible mechanisms.
Fig. 1.
Experimental paradigm. (a) Schematic diagram of a hippocampal slice. The bipolar stimulation electrode was placed on the CA1 stratum radiatum. Poisson random interval stimulation trains were delivered through a stimulation electrode. A recording glass electrode was patched on the soma of a CA1 pyramidal neuron to record the elicited PSPs and action potentials. (b) Picture showing a hippocampal slice with stimulating and recording electrodes. (c) Picture showing a recording electrode patching on the soma of a CA1 pyramidal neuron.
In this study, whole-cell patch clamp was performed to record corresponding intracellular PSPs and action potentials, because it provides a high-quality continuous tracing of neuron intracellular signal in both subthreshold and suprathreshold response regimes. The SC-CA1 pyramidal cell system was chosen for the study because it is one of the most studied brain region.
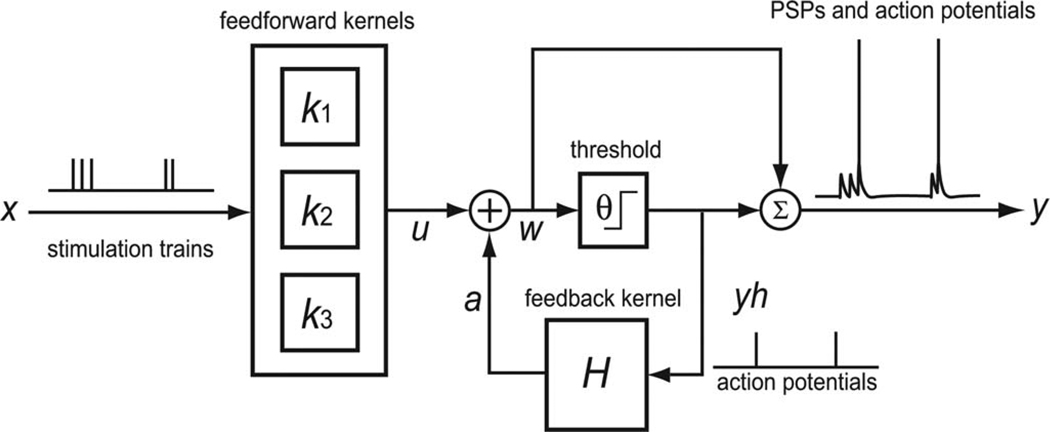
In 2007, Song et al. used a similar modeling approach to capture neuron spike train transformations [30]. The data collected in that study were all-or-none suprathreshold activities (in vivo extracellular action potentials) that limit the biological interpretation of the model. One goal of this study is to extend that approach to the modeling of intracellular activities that includes both subthreshold and suprathreshold dynamics and their interactions. Similar to the previous model [29], the model structure was constructed based on three principal neuronal processes that are common in all spike-input and spike-output neurons (see Fig. 2): 1) transformation from presynaptic spike to PSP; 2) action potential generation; and 3) spike-dependent modification of membrane potential.
Fig. 2.
Model comprises three major components: feedforward Volterra kernels (k), a threshold (θ), and a feedback Volterra kernel (H). The feedforward kernels are up to third order, describing the transformation from presynaptic stimulation (x) to PSP (u). The threshold (θ) is a constant membrane potential level, above which output action potentials (yh) are generated. The prethreshold membrane potential (nonspiking) (w) is the summation of PSPs (u) and spike-triggered after-potentials (a). The operation Σ is defined as superimposition. The model output (y) is the superimposition of prethreshold membrane potentials (w) and templates of action potentials.
The signal flow of the model starts from the entering of presynaptic spikes to the feedforward blocks (see Fig. 2) that characterize the nonlinear transformation from presynaptic spikes to PSPs; PSPs then are passed to a constant threshold, above which action potentials are formed; output action potentials then trigger a feedback block that describes the dynamics of spike-triggered after-potential that, in turn, modifies the membrane potential following each action potential. In our approach, both feedforward and feedback blocks were implemented with Volterra models [31], [32]. In a Volterra model, the output signal is expressed in terms of the input signal by means of a Volterra power series. The input–output nonlinear dynamics of the system is described by a series of progressively higher order Volterra kernels that can be directly estimated from the experimental input–output data. This data-driven property avoids the modeling errors caused by unknown mechanisms and/or partial knowledge of the system.
II. Materials and Methods
A. Experimental Procedures
Rat hippocampal slices were prepared acutely before each experiment. Two-week-old male Sprague–Dawley rats were anesthetized with inhalant anesthetic, Halothane (Halocarbon Laboratory, NJ), before standard slicing procedures. Hippocampal slices (400 µm) were prepared by using a vibrotome (Leica VT 1000 s, Germany) under iced sucrose solution. A surgical disruption of the connection between CA3 and CA1 was performed on each slice before it was transported to oxygenated bath solution for maintenance at 25 °C. The sucrose solution contained (in millimoles) Sucrose 206, KCl 2.8, NaH2PO4 1.25, NaHCO3 26, Glucose 10, MgSO4 2, and Ascorbic Acid 2 at pH 7.5 and 290 mOsmol. The bath solution contained (in millimoles) NaCl 128, KCl 2.5,NaH2PO4 1.25, NaHCO3 26, Glucose 10, MgSO4 1, Ascorbic Acid 2, and CaCl2 2 at pH 7.4 and 295 mOsmol.
The experiments were performed on the hippocampal SC-CA1 system. CA1 neurons in the rat hippocampus have two elaborately branching dendritic trees (basal and apical) that emerge from the pyramid-shaped soma [see Fig. 1(a)]. The basal dendrites occupy the stratum oriens, and the apical dendrites occupy the stratum radiatum (proximal) and the stratum lacunosum–moleculare (distal). The distance from the stratum pyramidale to the hippocampal fissure (hf) is about 600 µm, and the distance from the stratum pyramidale to the alveus is about 300 µm, yielding a 1mm distance from end to end. CA1 pyramidal neurons are covered with about 30 000 dendritic spines. The principal excitatory inputs to CA1 pyramidal cells arrive from CA3 through SC. The inputs from CA3 pyramidal neurons through SC form synapses on the apical dendrites in the stratum radiatum and the basal dendrites in the stratum oriens [33], [34].
During whole-cell patch-clamp recording, hippocampal slices were perfused with oxygenated bath solution at 25 °C. A bipolar stimulation electrode was placed in the CA1 stratum radiatum according to visual cues. Bipolar stimulation electrodes were made in laboratory with formvar-insulated nichrome wire (A-M Systems, Inc., WA). A recording mircopipette electrode with 4 MΩ tip resistance patched on the somatic membrane of CA1 pyramidal neuron to record the intracellular PSPs and action potentials. The recording micropipette electrodes were produced by heating and pulling thin-wall single barrel borosilicate glass tubing (World Precision Instrument, FL) using a pipette puller (Sutter Instrument P-80/PC). The internal solution of the recording electrode contained (in millimoles) Potassium-gluconate 110, HEPES 10, EGTA 1, KCl 20, NaCl 4, Mg-ATP 2, and Na3-GTP 0.25 at pH 7.3 and 290 mOsmol.
A programmable stimulator (Multi Channel System, Germany) was used to deliver Poisson random interval trains (RITs) with a 2 Hz mean frequency with interspike intervals ranging from 10 to 4500 ms [35]–[37]. These stimulation patterns can induce a broad range of physiological mechanisms or processes that have relatively shorter dynamic ranges, i.e., short-term synaptic plasticity [28], [31]. The 2Hz mean frequency is consistent with the in vivo firing characteristics of rat CA3 pyramidal neurons [38], [39]. Whole-cell patch-clamp recording in the mode of current clamp was performed with the HEKA EPC9/2 amplifier with 10 kHz sampling rate. The intensities of the stimulation spike trains were adjusted so that approximately 50% of the stimulations induced action potentials. This study included 98 trials of 200 s recordings (400 stimulations in each recording trial) in 15 cells from 13 different animals.
B. Modeling Procedures
PSP dynamics, spike generation, and spike-triggered after-potential dynamics are separated in the model structure in a physiologically plausible manner and are captured by an up to third-order feedforward kernel, a constant threshold, and a first-order feedback kernel, respectively (see Fig. 2). The feedforward kernels describe the nonlinear dynamical effects of synaptic transmission, dendritic integration, and somatic integration and transform presynaptic spikes to PSPs [9], [40], [41]. If a corresponding PSP response is higher than the threshold, a template waveform of an action potential is superimposed to the membrane potential. The formed action potential then triggers the feedback kernel and generates a spike-triggered after-potential that modifies the following membrane potential [1], [11], [15], [42]–[45].
The model (see Fig. 2) can be expressed with the following equations:
| (1) |
| (2) |
In (1), w represents the prethreshold (nonspiking) membrane potential that is the summation of the output of the feedforward block, u, and the output of the feedback block, a. The feedforward block K transforms the presynaptic spike trains x to PSPs u. The feedback block H describes the transformation from the output spikes yh to the spike-triggered after-potentials a. In (2), y represents the output of the neuron model, a continuous trace of predicted subthreshold and suprathreshold membrane potentials. If w is higher than or equal to the threshold θ, a template of an action potential is superimposed to w, and the feedback kernel is triggered by the output action potentials yh; if w is lower than θ, y is equal to w.
The output of the feedforward block, u, is expressed with an up to third-order Volterra model as
| (3) |
where k0 is the zero-order kernel, describing the output of the system output when the input is absent, i.e., the resting membrane potential. The first-order feedforward kernel k1 describes the system’s first-order (but not single-pulse) response to x (see the definitions of response functions in Table I for more explanations). The second-order feedforward kernel k2 describes the second-order (but not paired-pulse) response to x. The third-order feedforward kernel k3 describes the third-order (but not triple-pulse) response to x. Mk is the length of the memory window.
TABLE I.
Conversions Between Volterra Kernels and Response Functions
| K1 | K2 | K3 | |
|---|---|---|---|
| r1 | r1(τ) = k1(τ) | r1(τ) = k1(τ)+k2(τ, τ) | r1(τ) = k1(τ)+k2(τ, τ)+k3(τ, τ, τ) |
| r2 | N/A | r2(τ1, τ2) = 2k2(τ1, τ2) | r2(τ1, τ2) = 2k2(τ1, τ2)+3k3(τ1, τ1, τ2)+3k3(τ1, τ2, τ2) |
| r3 | N/A | N/A | r3(τ1, τ2, τ3) = 6k3(τ1, τ2, τ3) |
Conversions between the feedforward Volterra kernels (k1, k2, and k3) and the feedforward response functions (r1, r2, and r3) of the K1, K2, and K3 models. The single-pulse (r1), paired-pulse (r2), and triple-pulse (r3) response functions combine the contributions of identical stimulations described among different orders of Volterra kernels (k1, k2, and k3) to facilitate intuitive physiological interpretations. Examples of the response functions are plotted in Fig. 6, 7, and 8.
The spike-triggered after-potential a in (1) is expressed with a first-order Volterra model as
| (4) |
where the feedback kernel h describes how an output action potential yh triggers an after-potential. The output action potential train yh was defined as
| (5) |
C. Laguerre Expansion of Volterra Kernel
The Laguerre expansion method effectively reduces the number of open parameters in the Volterra model by expanding the Volterra kernels with Laguerre basis functions [32], [46], [47]. Both feedforward and feedback kernels are estimated by using the Laguerre expansion method as
| (6) |
where
| (7) |
In (6), L denotes the number of Laguerre basis functions; ck0, ck1, ck2, and ck3 are the Laguerre expansion coefficients of the feedforward kernels k0, k1, k2, and k3, respectively; and are the convolutions of the Laguerre basis functions bj and the input stimulation train x.
Similarly
| (8) |
where
| (9) |
In (8), L denotes the number of Laguerre basis functions and ch denotes the Laguerre expansion coefficients of the feedback kernel h. In (9), are the convolutions of the Laguerre basis functions bj and the output action potentials yh. Laguerre basis functions bj is expressed as (10), shown at the bottom of the page.
| (10) |
where τ is the time epoch value; j is the number order of basis functions; and α is the Laguerre parameter (0 < α < 1) determining the rate of exponential asymptotic decline of the Laguerre basis functions.
D. Evaluation and Quantification of Model Prediction Performance
The model parameters/coefficients are estimated according to two error measures: 1) normalized mean square error (NMSE) that was used to evaluate the nonspiking PSPs waveform prediction and 2) spike prediction error rate (SPER) that was used to evaluate spike prediction. NMSE is defined as
| (11) |
where ỹ is the recorded data; y is the predicted data; and T is the total number of data points in ỹ and y. In both ỹ and y, action potentials are excluded without loss of generality.
SPER is defined as the total number of false predictions divided by the total number of stimulations, expressed as
| (12) |
Both false positive and false negative cases are false predictions made by the model. False positive refers to the situation that the model predicts a response event (a PSP response evoked by a stimulation) to form an action potential, but the corresponding response event does not form an action potential in recordings. False negative refers to the situation that the model predicts a response event not to form an action potential, but the corresponding event in recordings forms an action potential.
E. Estimations of Model Parameters
In this model, α, L, ck, ch, and θ are the open parameters that need to be estimated according to either one of the two error measures. The optimization processes are discussed in the following.
1) Laguerre Parameter α
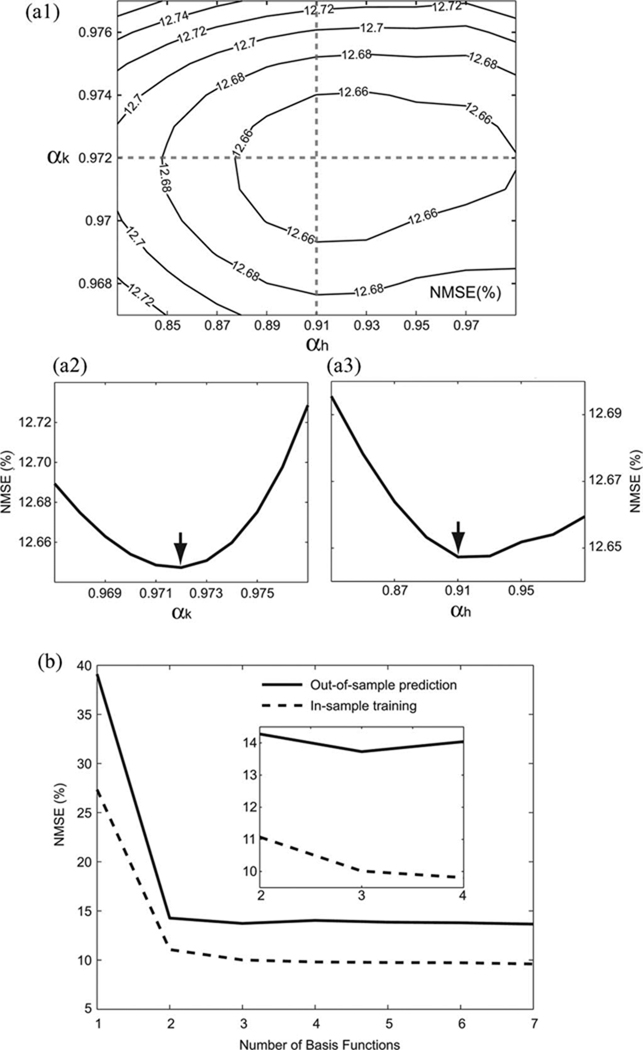
Laguerre parameter, α (0 < α < 1), determines the rate of the exponential asymptotic decline of the Laguerre basis functions. For each in-sample training trial, we scanned the α values from 0.5 to 1 with a stepping size of 0.01, and then, applied the quasi-Newton method [48] for fine tuning. The optimal values for feedforward kernels (αk) and feedback kernel (αh) produce a global minimum of NMSE in fitting the recorded data [see Fig. 3(a)].
Fig. 3.
(a1) Contour plot of NMSE with respect to the Laguerre parameters of the feedforward kernels and the feedback kernel (αk and αh). (a2) and (a3) Two dash lines intersecting at the global minimum of NMSE are plotted and arrows indicate the global minimum of NMSE. In this example, the NMSE converged to the global minimum value 12.648% at αk = 0.972 and αh = 0.910. (b) Choosing the optimal number of Laguerre basis functions (L). In the in-sample training trial (dashed line), the NMSE decreased monotonically with increasing numbers of basis functions. In the out-of-sample prediction trials (solid line), the minimum NMSE was found at L = 3.
2) Number of Laguerre Basis Functions L
The relation between L and NMSE is evaluated in Fig. 3(b). In the case of in-sample trainings, the NMSE decreases monotonically as the number of basis functions increases. However, in the out-of-sample predictions, the NMSE reaches the minimum at L = 3 and rises slightly afterward. This phenomenon is known as the multivariable overfitting effect. In other words, when the number of basis functions is higher than three, it produces overfitted results that are specific to the training dataset and loses the model generality [49]. The analysis indicates that three is the optimal number for basis functions.
3) Laguerre Expansion Coefficients ck and ch
The optimal Laguerre expansion coefficients ck, and ch are estimated by using the least-squares method as the product of the pseudoinverse matrix of V and the recorded data ỹ (after removing artifacts and action potentials)
| (13) |
where T is the data length of the recorded data, 1+p is the total number of feedforward convolutions and their products, q is the total number of feedback convolutions , and V is the concatenated matrix of all , and their applicable products, which is expressed as
| (14) |
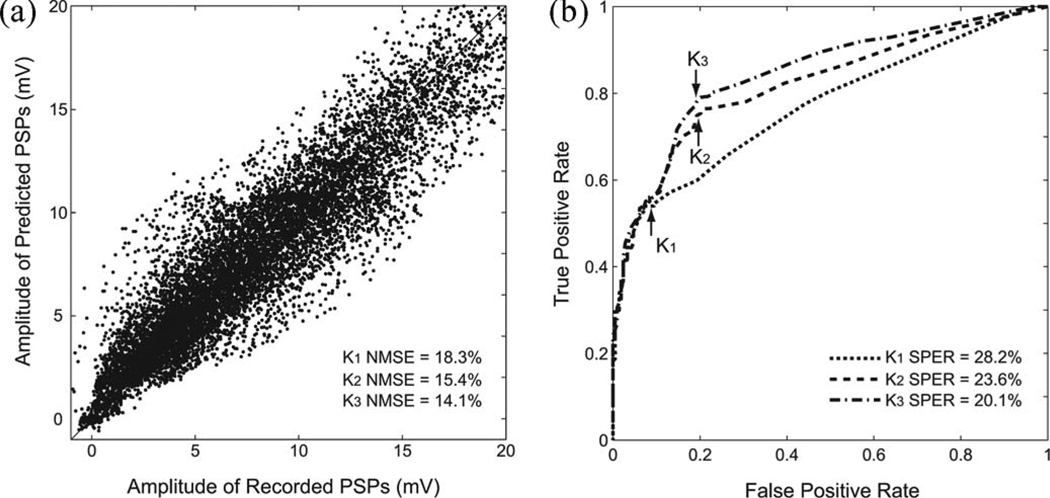
In (13), VT refers to the transpose matrix of V. See Fig. 4(a) for a scatter plot comparison of recorded PSP and predicted PSP.
Fig. 4.
Evaluations of model prediction performance with NMSE and SPER. (a) Scatter plot of recorded data and predicted data. In this example, NMSEs of K1, K2, and K3 models were 18.3%, 15.4%, and 14.1%, respectively (only K3 result is plotted). (b) Estimating the optimal threshold with an ROC curve. In this example, SPERS of K1, K2, and K3 models were 28.2%, 23.6%, and 20.1%, respectively.
4) Threshold θ
The thresholds are estimated by scanning through the range 0—20 mV (step size 0.01 mV) to find a threshold value that gives the least SPER. Receiver operating characteristic (ROC) curves [see Fig. 4(b)] are plotted with respect to the false positive rate (x-axis) and true positive rate (y-axis). The optimal threshold has the closest L1-distance to the upper left corner (0, 1) in the ROC curve.
F. Reconstruction of Volterra Kernels and Response Functions
The feedforward and feedback Volterra kernels are reconstructed by using the optimal Laguerre expansion coefficients ck and ch and the Laguerre basis functions bj as follows [30]:
| (15) |
| (16) |
| (17) |
| (18) |
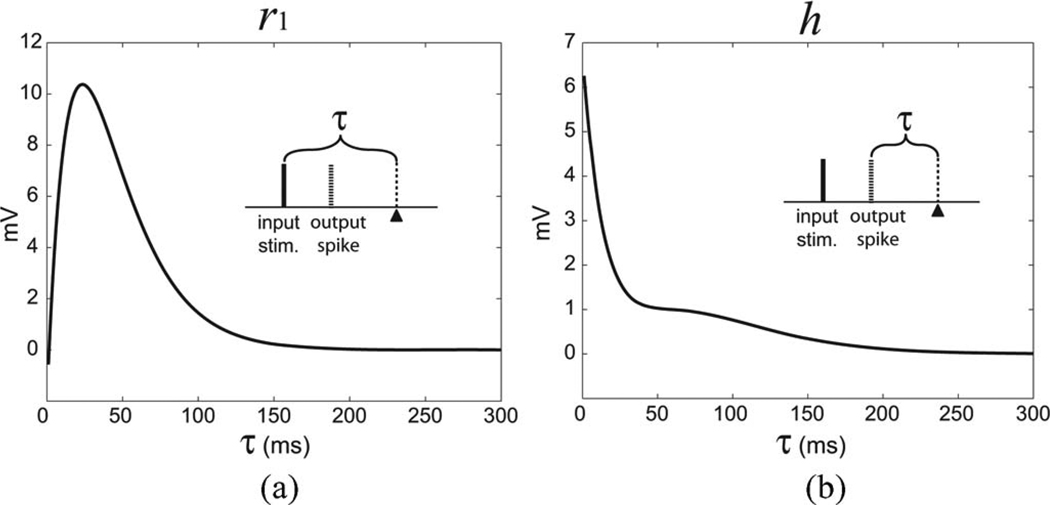
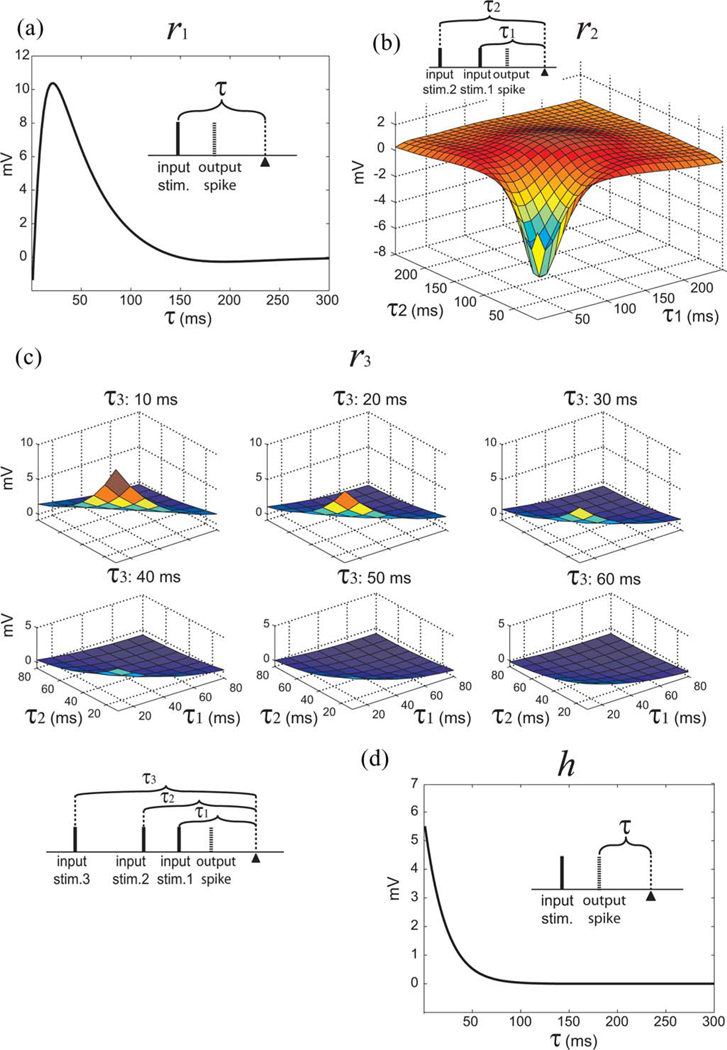
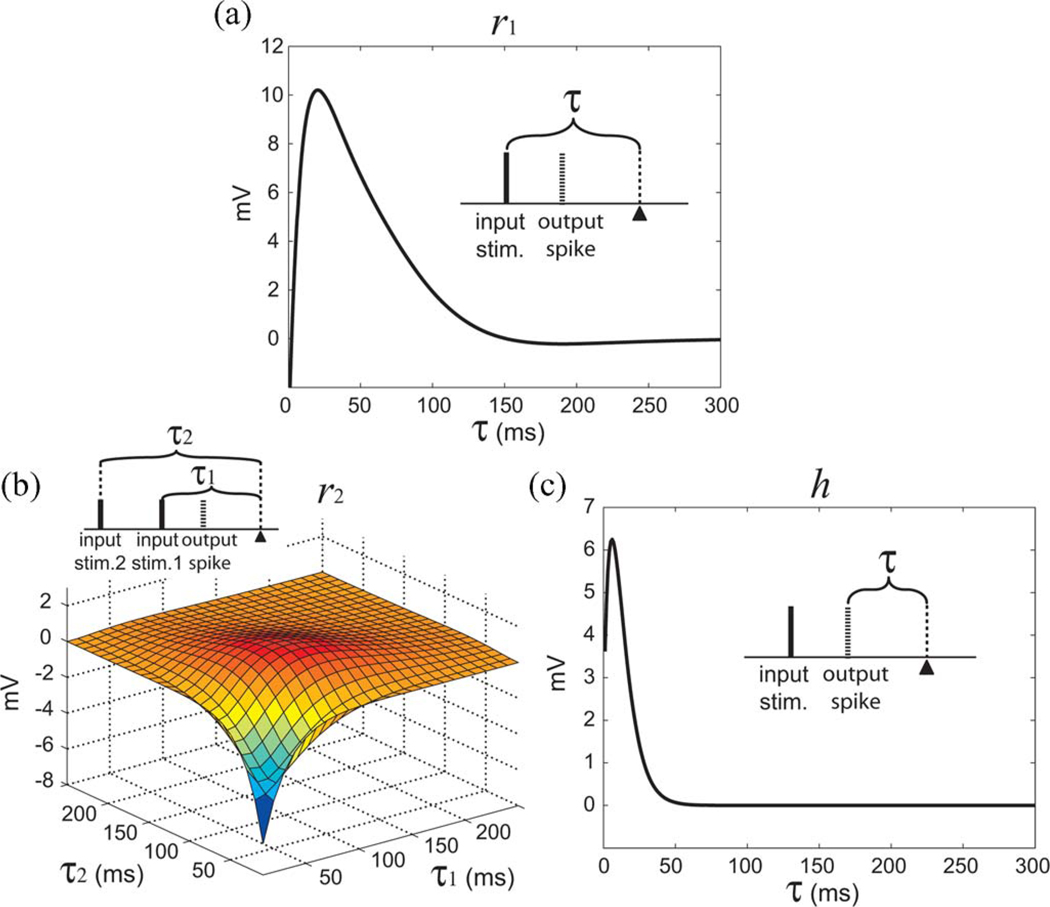
To examine the effect of a given number of input pulses, we utilized the notion of response functions [31], [49]. As shown in Table I, response functions (r) can easily be calculated from Volterra kernels (k). The first-order response function r1 describes the single-pulse response elicited by a single input pulse; the second-order response function r2 describes the paired-pulse effect caused by pairs of input pulses; and the third-order response function r3 describes the triple-pulse effect caused by triplets of input pulses. The feedback Volterra kernel is only of first order; thus, the feedback response function is equal to the feedback Volterra kernel (h), as in (18). Examples of response functions are plotted in Figs. 6–8.
Fig. 6.
Response functions of a K1 model. (a) Single-pulse feedforward response function (r1) is the single-pulse response to an input event. (b) Feedback response function (h) describes the spike-triggered after-potential. The insets illustrate the relations between input pulses, output spike, and the time epoch τ.
Fig. 8.
Response functions of a K3 model. (a) Single-pulse feedforward response function (r1). (b) Paired-pulse feedforward response function (r2). (c) Triple-pulse feedforward response function (r3). (d) Feedback response function (h). The insets illustrate the relations between input pulses, output spike, and the time epoch τ.
G. Out-of-Sample Prediction
The out-of-sample prediction is performed in two steps. First, the PSP u is predicted as follows:
| (19) |
Second, each PSP response is checked consecutively in the time order to see if it surpasses the threshold θ. If it does so, an action potential template is superimposed at the time point to the surpassing membrane potential, and a spike-triggered after-potential a is added to the subsequent prethreshold membrane potential w, forming a recurrent loop in the prediction process (see Fig. 2). All predictions presented in this paper are out-of-sample predictions, i.e., using one dataset in training and another independent dataset in prediction. The prediction processes are computationally efficient and were performed with a PC (AMD Phenom 9750).
III. Results
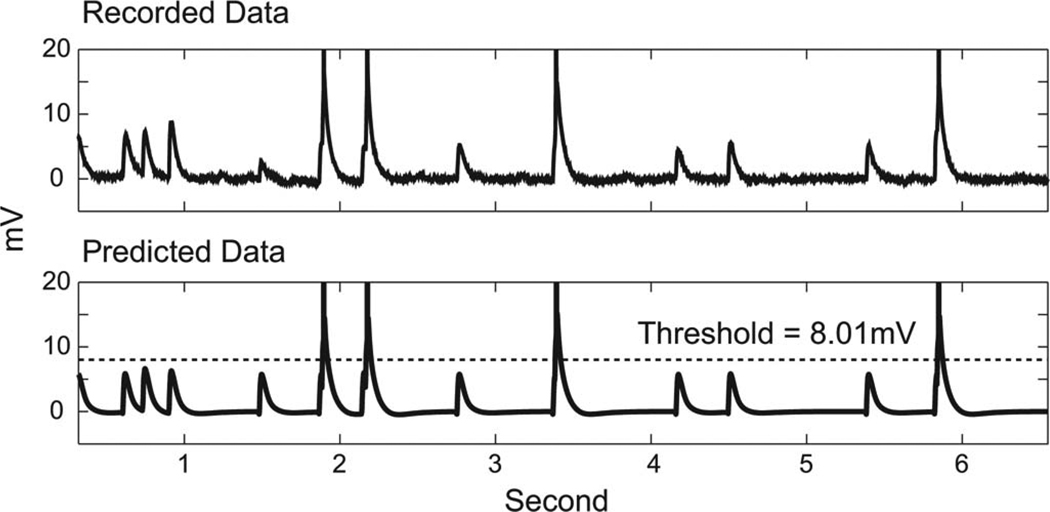
The single-input and single-output (SISO) model described in this paper can capture high-order nonlinear dynamical characteristics of the Schaffer collateral (SC)-CA1 system. Representative recorded and predicted data (produced by the K3 model) are shown in Fig. 5.
Fig. 5.
Representative clip of recorded data (the upper panel) and the corresponding predicted data produced by the K3 model (the lower panel) with an optimal threshold (dashed line).
To demonstrate how progressively higher order kernels contributed to the prediction accuracy, we built three models for each dataset: K1 includes an first-order feedforward kernel (k1), K2 includes up to second-order feedforward kernels (k1 and k2), and K3 includes up to third-order feedforward kernels (k1, k2, and k3); all models contain a threshold (θ) and a first-order feedback kernel (h).
A. K1 Model
The response functions (r1 and h) of a representative K1 model are plotted in Fig. 6. In Fig. 6(a), r1 rises abruptly in the beginning from −0.6 mV, reaches the peak amplitude 10.3 mV at τ = 24 ms, and decays to lower than 1 mV (less than 10% of the peak) at 112 ms. In Fig. 6(b), h has a peak amplitude of 6.3 mV at the beginning and decays to lower than 0.6 mV (less than 10% of the peak) at 121 ms. The K1 model’s average prediction performance over all datasets in NMSE is 17.9% and SPER is 22.4%.
B. K2 Model
The response functions (r1, r2, and h) of a representative K2 model are plotted in Fig. 7. In Fig. 7(a), r1 rises to the peak 10.3 mV at 20 ms and decays to 1 mV at 118 ms. In Fig. 7(b), on the diagonal, r2 starts from −6.17 mV, rises to a minimum 0 mV at (60 ms, 60 ms), reaches the peak 1.79 mV at (90 ms, 90 ms), and decays to 0.14 mV at (190 ms, 190 ms). In general description, r2 response function is depressive for short-interval (less than 60 ms) input pairs, facilitative for longer interval (more than 60 ms) input pairs, and relatively ineffective to input pairs that have an interval longer than 190 ms. In Fig. 7(c), h has a peak amplitude 6.3 mV at 6 ms and decays to 0.6 mV at 33 ms. The K2 model’s average prediction performance over all datasets in NMSE is 15.1% and SPER is 20.2%.
Fig. 7.
Response functions of a K2 model. (a) Single-pulse feedforward response function (r1). (b) Paired-pulse feedforward response function (r2). (c) Feedback response function (h). The insets illustrate the relations between input pulses, output spike, and the time epoch τ.
C. K3 Model
The response functions (r1, r2, r3, and h) of a representative K3 model are plotted in Fig. 8. In Fig. 8(a), r1 rises to the peak 10.39 mV at 22 ms and decays to 0.96 mV at 113 ms. In Fig. 8(b), on the diagonal, r2 starts negatively at −1.28 mV, reaches the minimum −5.5 mV at (30 ms, 30 ms), rise to 0.3 mV at (70 ms, 70 ms), reaches the peak 2.3 mV at (110 ms, 110 ms), and decays to 0.19 mV at (220 ms, 220 ms). In Fig. 8(c), r3 starts at peak 12.6 mV at the beginning and decays to 0.95 mV in 50 ms. In general description, r3 is facilitative if the previous two pulses have intervals less than 60 ms to the current pulse. The facilitative effect of r3 is weak and relatively ineffective when the previous pulses have intervals longer than 60 ms. In Fig. 8(d), h has a peak amplitude 5.5 mV at the beginning and decays to 0.54 mV at 50 ms. The K3 model’s average prediction performance over all datasets in NMSE is 14.4% and SPER is 18.8%.
D. PSP Waveform Prediction
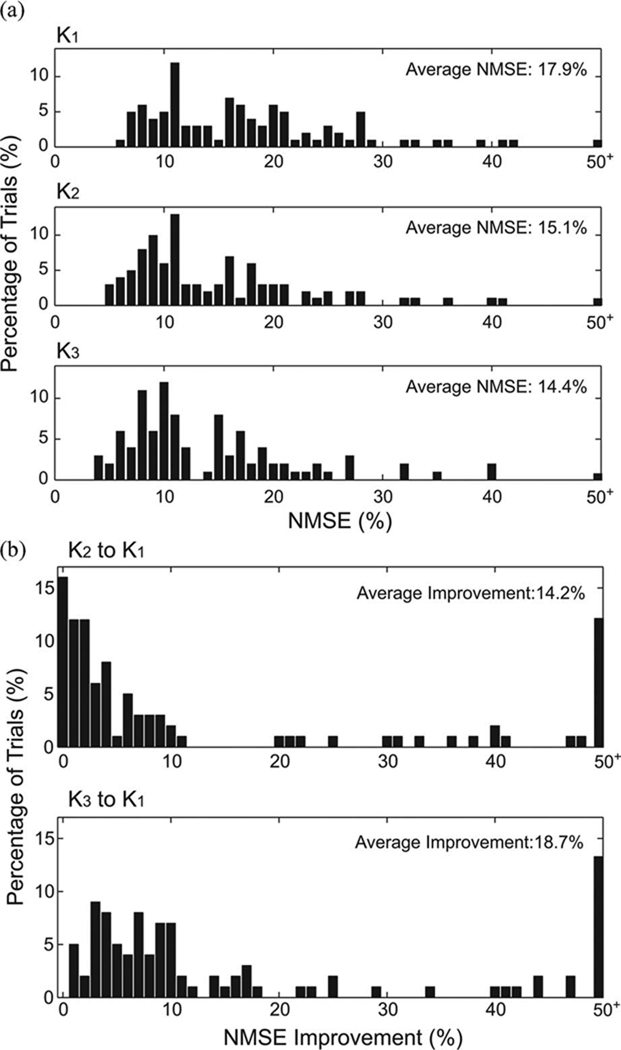
The PSP waveform prediction was evaluated with NMSE. The distribution of out-of-sample NMSEs to all datasets are shown in Fig. 9 (N = 98). The average NMSEs to K1, K2, and K3 models are 17.9%, 15.1%, and 14.4%, respectively [see Fig. 9(a)]. Moreover, the NMSE improvement from K1 to K2 is 14.2% and from K1 to K3 is 18.7% [see Fig. 9(b)].
Fig. 9.
Distributions of NMSEs and NMSE improvements with increasing model orders. (a) NMSE histograms of K1, K2, and K3. (b) NMSE improvement histograms.
E. Spike Prediction
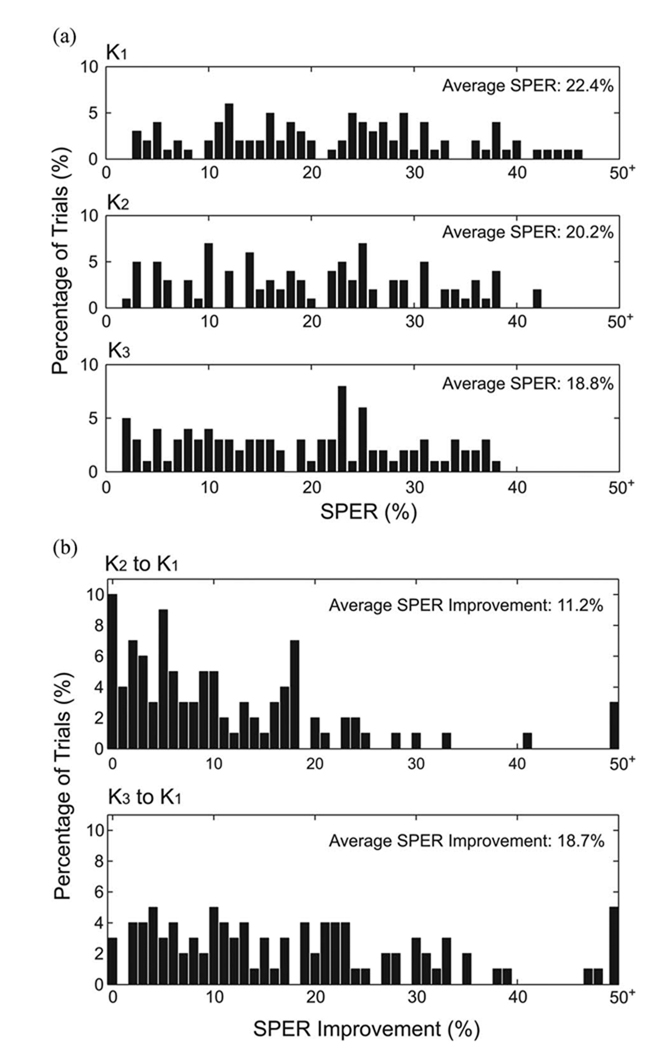
Spike trains are predicted by using the estimated kernels and the optimal thresholds, as described in Section II. The distribution of SPERs of all datasets is shown in Fig. 10. The average SPERs to K1, K2, and K3 are 22.4%, 20.2%, and 18.8%, respectively [see Fig. 10(a)]. The SPER improvement from K1 to K2 is 11.2% and from K1 to K3 is 18.7% [see Fig. 10(b)].
Fig. 10.
Distributions of SPERs and SPER improvements with increasing model orders. (a) SPER histograms of K1, K2, and K3. (b) SPER improvement histograms.
IV. Discussion
The nonlinear dynamical single-neuron model described in this paper is genuinely data-driven. In other words, all model parameters are simultaneously constrained by using experimental data (intracellular recording) with rigorously defined error measures, i.e., NMSE and SPER. No arbitrary manipulation of model parameters in regard to error terms is involved. More importantly, all data constraining the model parameters are derived from a single experimental set for which broadband input conditions are imposed on the preparation. As argued elsewhere [31], [50], these represent ideal conditions for modeling input–output nonlinear dynamics of a neurobiological system. Finally, the model captures subthreshold and suprathreshold activities and their interactions in a single mathematical formalism.
The model described here is a general one. It is a hybrid, combining both mechanistic (parametric) and input–output (non-parametric) components. Principles of neuronal processes common to all spike-input and spike-output neurons, e.g., biological signal generation and flow (see Fig. 2), determine the model structure. On the other hand, the specific properties that are variable from neuron to neuron are captured and quantified with descriptive model parameters that are directly constrained by intracellular recording data. This hybrid representation of both parametric and nonparametric model components partitions data variance with respect to mechanistic sources, and thus, imposes physiological definitions to the model components and facilitates the biological interpretations of the parameters. In addition, this hybrid structure representation conducts the estimation power of each model component to specific dynamics of the designated neuronal processes, producing more accurate estimations as opposed to capturing the neuron input–output transformation as a whole with a single nonparametric model component. This model is general enough to be applied to any spike-input and spike-output neuron, and flexible enough to capture neuron-to-neuron differences.
In general, achieving both high accuracy and high efficiency in a single-model formalism is difficult. High model accuracy usually is achieved by including a large number of open parameters, though unfortunately, this often reduces computational efficiency. High computational efficiency usually is achieved by simplifying the modeling methodology; however, model accuracy is inevitably compromised. Our results show that the model described in this study achieved both high accuracy and high efficiency. The average model accuracy in predicting PSP measured by NMSE is 14.4% and average suprathreshold spiking activity measured by SPER is 18.8%. Moreover, the modeling procedures can be performed easily using a PC (AMD Phenom 9750), and the total number of open parameters is relatively small, e.g., ten open parameters in the case of the first-order model (K1), 16 in the case of the second-order model (K2), and 26 in the case of the third-order model (K3).
The model shown here is an extension of an earlier approach developed by our laboratory [30]. In that study, Song et al. demonstrated the feasibility of using a similar model structure to capture the nonlinear dynamics when the input–output signals are extracellularly recorded unitary activities (spikes). Due to the different modeling goals and data-collecting paradigms, there are three major differences between the neuron model used by Song et al. and the neuron model described in this study: 1) the number of model inputs; 2) the noise term before threshold; and 3) the parameter estimation method. First, the model by Song et al. utilized extracellularly recorded ensemble of spike trains, and thus, was a multi-input and multioutput (MIMO) model. Since each CA1 neurons can potentially receive inputs from multiple CA3 neurons, it is reasonable to include all observed inputs in the model, and then, downselect them with statistical methods [49]. By contrast, in the experimental preparation of this study, recorded CA1 neurons received artificially delivered stimulation pulses from one stimulation source. In other words, the synapses of the intracellularly recorded CA1 neurons were activated simultaneously. This resulted in an SISO formalism.
Second, the extracellular MIMO model by Song et al. and the intracellular SISO model developed here dealt with noise differently. There are two major sources of stochastic activity in a neuron: 1) unobserved inputs and 2) intrinsic randomness of underlying mechanisms [51]–[53]. Both sources exist in the experimental context of the extracellular MIMO model. Thus, it is well-founded for the MIMO model to include a noise term to capture those stochastic activities. By contrast, in this study, the synaptic connections between CA3 and CA1 neurons were surgically eliminated so that no spontaneous activity occurred. This experimental preparation drastically reduced the stochastic level of the recorded CA1 neuron system and resulted in a model structure without an explicit noise term.
As to the last difference in parameter estimation method, extracellularly recorded all-or-none action potentials do not provide direct information about subthreshold membrane potential. This lack of subthreshold information along with the introduction of a noise term led the MIMO model to the utilization of a maximum-likelihood method for parameter estimation. On the other hand, intracellular whole-cell patch clamp traces continuously the membrane potential in both subthreshold and suprathreshold regimes. This information-rich data along with a low noise level enabled the use of least-squares estimation to estimate the model parameters in this study.
Despite the good performance, there are still several possible ways to improve/extend the model described in this report. First, neuron threshold has been reported to be dynamical as opposed to a constant [54], [55]. Although the average SPER of our model was already low, we are compelled to incorporate a dynamical threshold in future model developments to more completely capture the neuron input–output dynamics. We also expect spike prediction accuracy to be increased by this extension. Second, to enhance the physiological plausibility of the model, a necessary development would be to extend the current intracellular SISO model to an MISO model by delivering independent asynchronous stimulation trains to different CA1 input areas through multiple stimulation electrodes and modifying the modeling methodology correspondingly. Third, the stimulation paradigm and modeling methodology applied here are developed mainly to study short-term synaptic plasticity. In hippocampal and other cortical neurons, higher stimulation mean frequency may lead to longer changes of the input–output properties [28], such as long-term synaptic plasticity. The current modeling strategy then needs to be modified in order to track such long-term changes [56], [57]. Finally, this model can be combined with other modeling/experimental methods to study the underlying mechanisms of neurons. Specifically, by building nonlinear dynamical models of neurons as described here with and without a certain pharmacological manipulation, e.g., application of an agonist/antagonist of a certain type of ionic channel, we can quantify the functional contribution of a certain mechanism to the overall system behavior and gain further understandings and insights to it [44].
Acknowledgments
This work was supported in part by the National Science Foundation (NSF) (University of Southern California (USC) Biomimetic MicroElectronics Engineering Research Center), by the Defense Advanced Research Projects Agency (DARPA) (USC REMIND Program), by the National Institute of Biomedical Imaging and Bioengineering (NIBIB) (USC Biomedical Simulations Resource), and by the Office of Naval Research (ONR) under Grant N00014-10-1-0685.
Biographies

Ude Lu (S’05) received the B.S. degree in electrical and control engineering and the M.S. degree in biological science and technology from the National Chiao Tung University, Hsinchu, Taiwan, in 2000 and 2002, respectively. He is currently working toward the Ph.D. degree at the Department of Biomedical Engineering, University of Southern California, Los Angeles.
From 2002 to 2004, he was a Research Associate in the Institute of Biomedical Sciences of Academia Sinica, Taipei, Taiwan. His current research interests include nonlinear system analysis of single neuron, modeling input–output properties of neurological systems, electrophysiology of hippocampus, and long-term and short-term synaptic plasticity.
Mr. Lu is a member of the Biomedical Engineering Society and Society for Neuroscience.

Dong Song (S’02–M’04) received the B.S. degree in biophysics from the University of Science and Technology of China, Hefei, China, in 1994, and the Ph.D. degree in biomedical engineering from the University of Southern California (USC), Los Angeles, in 2003.
From 2004 to 2006, he was a Postdoctoral Research Associate at the Center for Neural Engineering, USC, where he is currently a Research Assistant Professor in the Department of Biomedical Engineering. His current research interests include nonlinear system analysis of nervous system, cortical neural prosthesis, electrophysiology of hippocampus, long-term and short-term synaptic plasticity, and the development of modeling methods incorporating both parametric and nonparametric modeling techniques.
Dr. Song is a member of the Biomedical Engineering Society and Society for Neuroscience.

Theodore W. Berger (M’03–SM’04–F’09) received the Ph.D. degree from Harvard University, Cambridge, MA, in 1976.
From 1977 to 1978, he conducted postdoctoral research at the University of California, Irvine. From 1978 to 1979, he was an Alfred P. Sloan Foundation Fellow at the Salk Institute. He joined the Departments of Neuroscience and Psychiatry, University of Pittsburgh, Pittsburgh, PA, in 1979, being promoted through to Full Professor in 1987. He is currently the David Packard Professor of engineering, a Professor of biomedical engineering and neuroscience, and the Director of the Center for Neural Engineering, University of Southern California, where he has been a Professor of biomedical engineering and neurobiology since 1992, and was appointed the David Packard Chair of Engineering in 2003. He has authored or coauthored more than 170 journal articles and book chapters. He is the coeditor of the Toward Replacement Parts for the Brain: Implantable Biomimetic Electronics as Neural Prostheses (MIT Press, 2005). In 1997, he became the Director of the Center for Neural Engineering, an organization that helps to unite USC faculty with cross-disciplinary interests in neuroscience, engineering, and medicine. His current research interests include the development of biologically realistic, experimentally based, mathematical models of higher brain (hippocampus) function, application of biologically realistic neural network models to real-world signal processing problems, very large-scale integration (VLSI)-based implementations of biologically realistic models of higher brain function, neuron–silicon interfaces for bidirectional communication between brain and VLSI systems, and next-generation brain-implantable, biomimetic signal processing devices for neural prosthetic replacement and/or enhancement of brain function.
Dr. Berger was the recipient of the James McKeen Cattell Award from the New York Academy of Sciences, the McKnight Foundation Scholar Award, and twice the NIMH Research Scientist Development Award. He was elected a Fellow of the American Association for the Advancement of Science. While at USC, he has received an NIMH Senior Scientist Award, was given the Lockheed Senior Research Award in 1997, was elected a Fellow of the American Institute for Medical and Biological Engineering in 1998, received a Person of the Year “Impact Award” by the AARP in 2004 for his work on neural prostheses, was a National Academy of Sciences International Scientist Lecturer in 2003, and an IEEE Distinguished Lecturer during 2004–2005. He received a “Great Minds, Great Ideas” Award from the EE Times in 2005, and in 2006, was awarded USC’s Associates Award for Creativity in Research and Scholarship.
Footnotes
Color versions of one or more of the figures in this paper are available online at http://ieeexplore.ieee.org
Contributor Information
Ude Lu, Email: ulu@usc.edu, Department of Biomedical Engineering, Center for Neural Engineering, University of Southern California, Los Angeles, CA 90089 USA.
Dong Song, Email: dsong@usc.edu, Department of Biomedical Engineering, Center for Neural Engineering, University of Southern California, Los Angeles, CA 90089 USA.
Theodore W. Berger, Email: berger@bmsr.usc.edu, Department of Biomedical Engineering, Center for Neural Engineering, University of Southern California, Los Angeles, CA 90089 USA.
References
- 1.Gerstner W, Kistler W. Spiking Neuron Models: Single Neurons, Populations, Plasticity. Cambridge, CA, U.K: Cambridge Univ. Press; 2002. [Google Scholar]
- 2.Koch C. Biophysics of Computation: Information Processing in Single Neurons. London, U.K: Oxford Univ. Press; 2004. [Google Scholar]
- 3.Koch C, Segev I. The role of single neurons in information processing. Nat. Neurosci. 2000;vol. 3:1171–1177. doi: 10.1038/81444. [DOI] [PubMed] [Google Scholar]
- 4.Herz AV, Gollisch T, Machens CK, Jaeger D. Modeling single-neuron dynamics and computations: A balance of detail and abstraction. Science. 2006;vol. 314:80–85. doi: 10.1126/science.1127240. [DOI] [PubMed] [Google Scholar]
- 5.Gerstner W, Naud R. Neuroscience. How good are neuron models? Science. 2009;vol. 326:379–380. doi: 10.1126/science.1181936. [DOI] [PubMed] [Google Scholar]
- 6.Izhikevich EM. Which model to use for cortical spiking neurons? IEEE Trans. Neural Netw. 2004 Sep.vol. 15(no. 5):1063–1070. doi: 10.1109/TNN.2004.832719. [DOI] [PubMed] [Google Scholar]
- 7.Poolos NP, Migliore M, Johnston D. Pharmacological upregulation of h-channels reduces the excitability of pyramidal neuron dendrites. Nat. Neurosci. 2002;vol. 5:767–774. doi: 10.1038/nn891. [DOI] [PubMed] [Google Scholar]
- 8.Hodgkin AL, Huxley AF. A quantitative description of membrane current and its application to conduction and excitation in nerve. J. Physiol. 1952;vol. 117:500–544. doi: 10.1113/jphysiol.1952.sp004764. [DOI] [PMC free article] [PubMed] [Google Scholar]
- 9.Poirazi P, Brannon T, Mel BW. Arithmetic of subthreshold synaptic summation in a model CA1 pyramidal cell. Neuron. 2003;vol. 37:977–987. doi: 10.1016/s0896-6273(03)00148-x. [DOI] [PubMed] [Google Scholar]
- 10.Bouteiller JM, Baudry M, Allam SL, Greget RJ, Bischoff S, Berger TW. Modeling glutamatergic synapses: Insights into mechanisms regulating synaptic efficacy. J. Integr. Neurosci. 2008;vol. 7:185–197. doi: 10.1142/s0219635208001770. [DOI] [PMC free article] [PubMed] [Google Scholar]
- 11.Song D, Wang Z, Berger TW. Contribution of T-type VDCC to TEA-induced long-term synaptic modification in hippocampal CA1 and dentate gyrus. Hippocampus. 2002;vol. 12:689–697. doi: 10.1002/hipo.10105. [DOI] [PubMed] [Google Scholar]
- 12.Carnevale NT, Hines ML. The NEURON Book. Cambridge, U.K: Cambridge Univ. Press; 2006. [Google Scholar]
- 13.Holmes WR, Rall W. Estimating the electrotonic structure of neurons with compartmental models. J. Neurophysiol. 1992;vol. 68:1438–1452. doi: 10.1152/jn.1992.68.4.1438. [DOI] [PubMed] [Google Scholar]
- 14.Kobayashi R, Tsubo Y, Shinomoto S. Made-to-order spiking neuron model equipped with a multi-timescale adaptive threshold. Frontiers in Comput. Neurosci. 2009;vol. 3 doi: 10.3389/neuro.10.009.2009. article 9. [DOI] [PMC free article] [PubMed] [Google Scholar]
- 15.Paninski L, Pillow JW, Simoncelli EP. Maximum likelihood estimation of a stochastic integrate-and-fire neural encoding model. Neural Comput. 2004;vol. 16:2533–2561. doi: 10.1162/0899766042321797. [DOI] [PubMed] [Google Scholar]
- 16.Paninski L, Pillow J, Simoncelli E. Comparing integrate-and-fire models estimated using intracellular and extracellular data. Neurocomputing. 2005;vol. 65–66:379–385. [Google Scholar]
- 17.Harty TP, Berger TW, Sclabassi RJ, Barrionuevo G. Doctor thesis. Pittsburgh, PA: Univ. Pittsburgh; 1998. Nonlinear systems analysis of the in vitro hippocampal dentate gyrus. I. Characterization of granule cell response to perforant path input. [Google Scholar]
- 18.Harty TP, Berger TW, Sclabassi RJ, Barrionuevo G. Doctor thesis. Pittsburgh, PA: Univ. Pittsburgh; 1998. Nonlinear systems analysis of the in vitro hippocampal dentate gyrus. II. Contribution of GABAA and GABAB receptor function. [Google Scholar]
- 19.Harty TP, Berger TW, Sclabassi RJ, Barrionuevo G. Doctor thesis. Pittsburgh, PA: Univ. Pittsburgh; 1998. Nonlinear systems analysis of the in vitro hippocampal dentate gyrus. III. Characterization of open-loop properties of the perforant path-granule cell projection. [Google Scholar]
- 20.Berger TW, Song D, Chan RH, Marmarelis VZ. The neurobiological basis of cognition: Identification by multi-input, multioutput nonlinear dynamic modeling: A method is proposed for measuring and modeling human long-term memory formation by mathematical analysis and computer simulation of nerve-cell dynamics. Proc. IEEE. 2010 Mar.vol. 98(no. 3):356–374. doi: 10.1109/JPROC.2009.2038804. [DOI] [PMC free article] [PubMed] [Google Scholar]
- 21.Izhikevich EM. Simple model of spiking neurons. IEEE Trans. Neural Netw. 2003 Nov.vol. 14(no. 6):1569–1572. doi: 10.1109/TNN.2003.820440. [DOI] [PubMed] [Google Scholar]
- 22.Izhikevich EM. Resonate-and-fire neurons. Neural Netw. 2001;vol. 14:883–894. doi: 10.1016/s0893-6080(01)00078-8. [DOI] [PubMed] [Google Scholar]
- 23.Rose RM, Hindmarsh JL. The assembly of ionic currents in a thalamic neuron. I. The three-dimensional model. Proc. R. Soc. Lond. B Biol. Sci. 1989;vol. 237:267–288. doi: 10.1098/rspb.1989.0049. [DOI] [PubMed] [Google Scholar]
- 24.Ermentrout B. Type I membranes, phase resetting curves, and synchrony. Neural Comput. 1996;vol. 8:979–1001. doi: 10.1162/neco.1996.8.5.979. [DOI] [PubMed] [Google Scholar]
- 25.Smith GD, Cox CL, Sherman SM, Rinzel J. Fourier analysis of sinusoidally driven thalamocortical relay neurons and a minimal integrate- and-fire-or-burst model. J. Neurophysiol. 2000;vol. 83:588–610. doi: 10.1152/jn.2000.83.1.588. [DOI] [PubMed] [Google Scholar]
- 26.Gholmieh G, Courellis S, Marmarelis V, Berger T. An efficient method for studying short-term plasticity with random impulse train stimuli. J. Neurosci. Methods. 2002;vol. 121:111–127. doi: 10.1016/s0165-0270(02)00164-4. [DOI] [PubMed] [Google Scholar]
- 27.Berger TW, Eriksson JL, Ciarolla DA, Sclabassi RJ. Nonlinear systems analysis of the hippocampal perforant path-dentate projection. III. Comparison of random train and paired impulse stimulation. J. Neurophysiol. 1988;vol. 60:1095–1109. doi: 10.1152/jn.1988.60.3.1095. [DOI] [PubMed] [Google Scholar]
- 28.Berger TW, Eriksson JL, Ciarolla DA, Sclabassi RJ. Nonlinear systems analysis of the hippocampal perforant path-dentate projection. II. Effects of random impulse train stimulation. J. Neurophysiol. 1988;vol. 60:1076–1094. doi: 10.1152/jn.1988.60.3.1077. [DOI] [PubMed] [Google Scholar]
- 29.Sclabassi RJ, Eriksson JL, Port RL, Robinson GB, Berger TW. Nonlinear systems analysis of the hippocampal perforant path-dentate projection. I. Theoretical and interpretational considerations. J. Neurophysiol. 1988;vol. 60:1066–1076. doi: 10.1152/jn.1988.60.3.1066. [DOI] [PubMed] [Google Scholar]
- 30.Song D, Chan RHM, Marmarelis VZ, Hampson RE, Deadwyler SA, Berger TW. Nonlinear dynamic modeling of spike train transformations for hippocampal-cortical prostheses. IEEE Trans. Biomed. Eng. 2007 Jun.vol. 54(no. 6):1053–1066. doi: 10.1109/TBME.2007.891948. [DOI] [PubMed] [Google Scholar]
- 31.Song D, Marmarelis VZ, Berger TW. Parametric and non-parametric modeling of short-term synaptic plasticity. Part I: Computational study. J. Comput. Neurosci. 2009;vol. 26:1–19. doi: 10.1007/s10827-008-0097-3. [DOI] [PMC free article] [PubMed] [Google Scholar]
- 32.Marmarelis VZ. Identification of nonlinear biological systems using Laguerre expansions of kernels. Ann. Biomed. Eng. 1993;vol. 21:573–589. doi: 10.1007/BF02368639. [DOI] [PubMed] [Google Scholar]
- 33.Blackstad TW. Commissural connections of the hippocampal region in the rat, with special reference to their mode of termination. J. Comput. Neurol. 1956;vol. 105:417–537. doi: 10.1002/cne.901050305. [DOI] [PubMed] [Google Scholar]
- 34.Storm-Mathisen J, Fonnum F. Localization of transmitter candidates in the hippocampal region. Prog. Brain Res. 1972;vol. 36:41–58. doi: 10.1016/S0079-6123(08)62507-8. [DOI] [PubMed] [Google Scholar]
- 35.Del Castillo J, Katz B. Quantal components of the end-plate potential. J. Physiol. 1954;vol. 124:560–573. doi: 10.1113/jphysiol.1954.sp005129. [DOI] [PMC free article] [PubMed] [Google Scholar]
- 36.Tsodyks MV, Markram H. The neural code between neocortical pyramidal neurons depends on neurotransmitter release probability. Proc. Nat. Acad. Sci. USA. 1997;vol. 94:719–723. doi: 10.1073/pnas.94.2.719. [DOI] [PMC free article] [PubMed] [Google Scholar]
- 37.Softky WR, Koch C. The highly irregular firing of cortical cells is inconsistent with temporal integration of random EPSPs. J. Neurosci. 1993;vol. 13:334–350. doi: 10.1523/JNEUROSCI.13-01-00334.1993. [DOI] [PMC free article] [PubMed] [Google Scholar]
- 38.Barnes CA, McNaughton BL, Mizumori SJ, Leonard BW, Lin LH. Comparison of spatial and temporal characteristics of neuronal activity in sequential stages of hippocampal processing. Prog. Brain Res. 1990;vol. 83:287–300. doi: 10.1016/s0079-6123(08)61257-1. [DOI] [PubMed] [Google Scholar]
- 39.Hampson RE, Heyser CJ, Deadwyler SA. Hippocampal cell firing correlates of delayed-match-to-sample performance in the rat. Behav. Neurosci. 1993;vol. 107:715–739. doi: 10.1037//0735-7044.107.5.715. [DOI] [PubMed] [Google Scholar]
- 40.Song D, Marmarelis VZ, Berger TW. Parametric and non-parametric models of short-term plasticity; Proc. 2nd Joint EMBS/BMES Conf; 2002. pp. 1964–1965. [Google Scholar]
- 41.Zucker RS, Regehr WG. Short-term synaptic plasticity. Annu. Rev. Physiol. 2002;vol. 64:355–405. doi: 10.1146/annurev.physiol.64.092501.114547. [DOI] [PubMed] [Google Scholar]
- 42.Jolivet R, Lewis TJ, Gerstner W. Generalized integrate-and-fire models of neuronal activity approximate spike trains of a detailed model to a high degree of accuracy. J. Neurophysiol. 2004;vol. 92:959–976. doi: 10.1152/jn.00190.2004. [DOI] [PubMed] [Google Scholar]
- 43.Alger BE, Nicoll RA. Pharmacological evidence for two kinds of GABA receptor on rat hippocampal pyramidal cells studied in vitro. J. Physiol. 1982;vol. 328:125–141. doi: 10.1113/jphysiol.1982.sp014256. [DOI] [PMC free article] [PubMed] [Google Scholar]
- 44.Berger TW, Chauvet G, Sclabassi RJ. A biologically based model of functional properties of the hippocampus. Neural Netw. 1994;vol. 7:1031–1064. [Google Scholar]
- 45.Keat J, Reinagel P, Reid RC, Meister M. Predicting every spike: A model for the responses of visual neurons. Neuron. 2001;vol. 30:803–817. doi: 10.1016/s0896-6273(01)00322-1. [DOI] [PubMed] [Google Scholar]
- 46.Marmarelis VZ. Nonlinear Dynamic Modeling of Physiological Systems. New York: Wiley; 2004. [Google Scholar]
- 47.Zanos TP, Courellis SH, Berger TW, Hampson RE, Deadwyler SA, Marmarelis VZ. Nonlinear modeling of causal interrelationships in neuronal ensembles. IEEE Trans. Neural Syst. Rehabil. Eng. 2008 Aug.vol. 16(no. 4):336–352. doi: 10.1109/TNSRE.2008.926716. [DOI] [PMC free article] [PubMed] [Google Scholar]
- 48.Coleman TF, Li Y. On the convergence of interior-reflective Newton methods for nonlinear minimization subject to bounds. Math. Program. 1994;vol. 67:189–224. [Google Scholar]
- 49.Song D, Chan RH, Marmarelis VZ, Hampson RE, Deadwyler SA, Berger TW. Nonlinear modeling of neural population dynamics for hippocampal prostheses. Neural Netw. 2009;vol. 22:1340–1351. doi: 10.1016/j.neunet.2009.05.004. [DOI] [PMC free article] [PubMed] [Google Scholar]
- 50.Song D, Wang Z, Marmarelis VZ, Berger TW. Parametric and non-parametric modeling of short-term synaptic plasticity. Part II: Experimental study. J. Comput. Neurosci. 2009;vol. 26:21–37. doi: 10.1007/s10827-008-0098-2. [DOI] [PMC free article] [PubMed] [Google Scholar]
- 51.Schneidman E, Freedman B, Segev I. Ion channel stochasticity may be critical in determining the reliability and precision of spike timing. Neural Comput. 1998;vol. 10:1679–1703. doi: 10.1162/089976698300017089. [DOI] [PubMed] [Google Scholar]
- 52.Destexhe A, Contreras D. Neuronal computations with stochastic network states. Science. 2006;vol. 314:85–90. doi: 10.1126/science.1127241. [DOI] [PubMed] [Google Scholar]
- 53.Chance FS, Abbott LF, Reyes AD. Gain modulation from background synaptic input. Neuron. 2002;vol. 35:773–782. doi: 10.1016/s0896-6273(02)00820-6. [DOI] [PubMed] [Google Scholar]
- 54.Henze DA, Buzsaki G. Action potential threshold of hippocampal pyramidal cells in vivo is increased by recent spiking activity. Neuroscience. 2001;vol. 105:121–130. doi: 10.1016/s0306-4522(01)00167-1. [DOI] [PubMed] [Google Scholar]
- 55.Sekerli M, Del Negro CA, Lee RH, Butera RJ. Estimating action potential thresholds from neuronal time-series: New metrics and evaluation of methodologies. IEEE Trans. Biomed. Eng. 2004 Sep.vol. 51(no. 9):1665–1672. doi: 10.1109/TBME.2004.827531. [DOI] [PubMed] [Google Scholar]
- 56.Chan RH, Song D, Berger TW. Tracking temporal evolution of nonlinear dynamics in hippocampus using time-varying volterra kernels; Proc. IEEE Conf. Eng. Med. Biol. Soc; 2008. Aug., pp. 4996–4999. [DOI] [PubMed] [Google Scholar]
- 57.Chan RH, Song D, Berger TW. Nonstationary modeling of neural population dynamics; Proc. IEEE Conf. Eng. Med. Biol. Soc; 2009. Sep., pp. 4559–4562. [DOI] [PubMed] [Google Scholar]


