Abstract
Purpose: We present a novel algorithm for computer simulation of breast anatomy for generation of anthropomorphic software breast phantoms. A realistic breast simulation is necessary for preclinical validation of volumetric imaging modalities.Methods: The anthropomorphic software breast phantom simulates the skin, regions of adipose and fibroglandular tissue, and the matrix of Cooper’s ligaments and adipose compartments. The adipose compartments are simulated using a seeded region-growing algorithm; compartments are grown from a set of seed points with specific orientation and growing speed. The resulting adipose compartments vary in shape and size similar to real breasts; the adipose region has a compact coverage by adipose compartments of various sizes, while the fibroglandular region has fewer, more widely separated adipose compartments. Simulation parameters can be selected to cover the breadth of variations in breast anatomy observed clinically.Results: When simulating breasts of the same glandularity with different numbers of adipose compartments, the average compartment volume was proportional to the phantom size and inversely proportional to the number of simulated compartments. The use of the software phantom in clinical image simulation is illustrated by synthetic digital breast tomosynthesis images of the phantom. The proposed phantom design was capable of simulating breasts of different size, glandularity, and adipose compartment distribution. The region-growing approach allowed us to simulate adipose compartments with various size and shape. Qualitatively, simulated x-ray projections of the phantoms, generated using the proposed algorithm, have a more realistic appearance compared to previous versions of the phantom.Conclusions: A new algorithm for computer simulation of breast anatomy has been proposed that improved the realism of the anthropomorphic software breast phantom.
Keywords: modeling, visualization, validation, simulation of breast image acquisition
INTRODUCTION
Breast cancer screening and diagnostic imaging are increasingly multimodality. Mammography, the standard for early cancer screening, provides high spatial-resolution 2D information about the breast morphology. Dynamic contrast-enhanced (DCE) breast magnetic resonance imaging (MRI) provides additional functional information related to tissue vascular kinetics. Due to the high sensitivity to malignant tumor development, DCE-MRI has been recommended for screening in women with high risk of breast cancer.1 Breast ultrasound has been used in evaluation of palpable lesions in younger women. In addition, several recently developed imaging modalities have been investigated for their clinical use, including digital breast tomosynthesis (DBT), dedicated computed tomography (CT) of the breast, contrast-enhanced (CE) digital mammography, and CE-DBT.
Validation and optimization of newly developed imaging modalities require both preclinical and clinical studies. Preclinical studies usually involve analysis of the images of physical breast phantoms which simulate appropriate physical properties of breast tissues. Due to their simplified design, such phantoms offer a very limited representation of the complex anatomy of the breast. An alternative breast phantom based upon a realistic simulation of the breast anatomy would be very beneficial for preclinical validation of novel imaging modalities. The potential benefit of realistic breast anatomy simulation can be illustrated with the following two examples. First, we have used simulated images of our anthropomorphic software breast phantom for the optimization of a commercial DBT reconstruction method.2 Selection of reconstruction parameters to optimize the estimation of breast density was based upon a comparison between the reconstructed phantom slices and the ground truth information of the simulated tissues. In another application, the geometric accuracy of DBT reconstruction was validated in the presence of realistically simulated parenchymal patterns.3
The clinical realism of our phantom is reflected in the appearance of the parenchymal pattern which makes up the anatomical noise in projection mammography. In mammography, the parenchymal pattern, formed by the overlapping projections of breast anatomical structures,4 exhibits a power spectrum with 1∕fβ (β ≈ 3) proportionality to the spatial frequency.5 Several methods for 2D simulation of parenchymal patterns have been proposed in the form of clustered lumpy background6, 7 or random fields based upon a 1∕f process.8 These methods can produce images which successfully match some statistical properties of clinical mammograms. Due to their 2D approach, however, they cannot simulate the appearance of the same breast when imaged by different modalities, especially 3D imaging modalities.
An alternative to direct simulation of the anatomical noise in clinical images is 3D modeling of breast anatomical structures. There have been several efforts to develop realistic software phantoms by simulating the 3D breast anatomical composition. Taylor et al. simulated growth of the breast ductal network using a fractal description of duct lengths, diameters, and branching angles.9 They selected the breast shape from the images acquired with the use of structured light.10 Bliznakova et al.11 introduced a hybrid method that simulates normal breast tissue structures and abnormalities using a combination of geometric primitives and breast anatomical noise approximated by a clustered lumpy background.6 Use of their software phantom in diverse applications has been reported.11, 12, 13, 14
Recently, Li et al. proposed a software breast phantom developed from a postprocessed clinical data set acquired by breast CT.15, 16 Such design guarantees a very high degree of realism; however, it represents a single breast composition and lacks flexibility to cover wide anatomical variations. In a similar approach, 3D images of mastectomy specimens were used for development of software phantoms by Hoeschen et al.17 and O’Connor et al.18
Modeling breast anatomy can be used for simulation of multimodality imaging; individual modalities are simulated by applying the corresponding image acquisition model, with appropriate physical properties (i.e., the linear x-ray attenuation coefficient or MRI relaxation times) associated to each modeled tissue type.
We previously built anthropomorphic 3D software breast phantoms by simulating the arrangement of large and medium scale anatomical structures, as visualized by subgross histological slices and clinical mammograms.19, 20, 21, 22, 23 The large scale structures included a region composed predominantly of adipose tissue (adipose region) and a region composed predominantly of fibroglandular tissue (fibroglandular region). The medium scale structures, namely, adipose compartments and Cooper’s ligaments, were previously simulated by spherical geometric primitives and spherical shells, respectively (as shown in Fig. 3 of Ref. 9). We also simulated the breast ductal network based upon a random binary tree model.24 These software phantoms have been used in the analysis of parenchymal pattern25 and breast ductal branching pattern,26, 27, 28 tissue specific breast dosimetry,29, 30 radiation therapy design,31, 32, 33 evaluation of a method for noise and dose reduction in mammography (Refs. 34, 35), validation of algorithms for mammogram registration,36, 37, 38 registration between mammograms and DBT projection images,39, 40 and analysis of breast tissue deformation during mammographic compression.41 These applications have confirmed the phantom’s ability to simulate breast parenchyma visualized as anatomical noise in mammograms. Synthetic images yielded similar mean values and the range of several clinically measured parenchymal descriptors, namely, size distribution, texture energy, and fractal dimension.25 Limitations of our original design were primarily related to the sharp, overly geometric boundary between the adipose and fibroglandular regions, and the uniform spherical shape of the adipose compartments. These features are noticeable in simulated x-ray images of the breast phantom, thus diminishing realism, especially at small spatial scales.
Figure 3.
Orthogonal slices of a phantom showing the skin and the large-scale adipose (gray) and fibroglandular (white) regions in: (a) coronal view; (b) vertical view; and (c) horizontal view. Dashed line indicates the phantom’s plane of symmetry. Simulated internal anatomical structures of the adipose and fibroglandular regions (namely, adipose compartments and Cooper’s ligaments) are not shown.
We present here a novel algorithm for computer simulation of the breast anatomy for generating software phantoms. In this novel algorithm the internal adipose compartments and Cooper’s ligaments have been simulated using seeded region-growing. Analysis of the dependence of the average compartment volume on the phantom size and the number of compartments is presented. The use of the software phantom is illustrated by simulating digital breast tomosynthesis (DBT) images of the phantom.
BREAST ANATOMY
The dominant tissues of the breast are skin, fibroglandular tissue, adipose tissue, and pectoral muscle; these are readily identifiable in subgross histological slices42 and clinical breast images. The surface of the breast is covered by the skin, made up of cutaneous and subcutaneous layers; these layers are not distinguishable in breast radiographs. The skin thickness varies in normal breasts between 0.5–3 mm.43, 44
Within the breast, a matrix of connective and fibroglandular tissues spans from the chest wall to the skin. Contained within the matrix is a mixture of adipose tissue, fibrous connective tissue, and ductal and lobular glandular tissue. The adipose tissue is organized into macroscopically visible accumulations in the form of irregularly shaped compartments (Fig. 1). The adipose compartments are surrounded by connective tissue structures called Cooper’s ligaments.45 The Cooper’s ligaments extend from the skin to the chest wall and provide structural support to the breast.
Figure 1.
Subgross (thick) histologic slice (left) showing the distribution of fibroglandular and adipose tissues. An enlarged detail (right) shows individual adipose compartments (e.g., indicated by dotted lines), each are several mm in size. (Images acquired with the help of Dr. Carolyn Mies, Hospital of the University of Pennsylvania).
The breast rests upon the pectoralis muscles, which connect the sternum, clavicle, and shoulder; the pectoralis muscles influence the positioning and compression of the breast during clinical imaging exams. In addition to the listed tissues, the breast also includes vascular and lymphatic vessels and nervous tissue.
In clinical x-ray images, the breast anatomy is visualized by x-ray attenuation differences between the various tissue types. At x-ray energies routinely used in clinical breast imaging, the linear x-ray attenuation coefficients of the fibrous and glandular tissue are practically the same and are equal to approximately twice the adipose tissue attenuation coefficients.46 The breast ductal network is not routinely distinguishable from the surrounding fibroglandular tissue in clinical mammograms. Portions of the ductal network may be observed when dilated, calcified, or enhanced by injection of an iodine-based contrast agent in galactography.47, 48
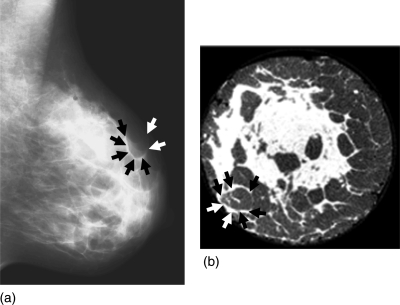
An example of a clinical mammogram is shown in Fig. 2a. Figure 2b shows a coronal slice through a reconstructed breast CT volume of a mastectomy specimen.46 The adipose compartments and Cooper’s ligaments are visible in both images. They are more easily distinguishable in the reconstructed breast CT slice. In the mammogram they overlap due to the projective mammographic image acquisition. Note the variations in size and shape of adipose compartments in different breast regions.
Figure 2.
(a) A clinical mammogram showing projections of Cooper’s ligaments which form adipose compartments. (b) A breast CT slice of a mastectomy specimen (courtesy of Dr. Stephen Glick, University of Massachusetts, Worcester, MA). (Examples of Cooper’s ligaments are indicated by the arrows).
MATERIALS AND METHODS
Our anthropomorphic software breast phantom is divided into three large scale regions: (1) the skin region, (2) the adipose region, and (3) the fibroglandular region. The following anatomical structures have been modeled: (a) the skin, with cutaneous and subcutaneous tissues simulated together as one layer, (b) fatty tissue arranged into adipose compartments of various size and shape throughout the phantom, (c) fibroglandular tissue simulated in the phantom fibroglandular region, (d) Cooper’s ligaments in the phantom adipose region. The adipose compartments in the adipose and fibroglandular regions are simulated using a seeded region-growing algorithm. The adipose region, located peripherally in the phantom, has a compact coverage by adipose compartments of various sizes; the fibroglandular region, located in the phantom center, has fewer, more separated adipose compartments, as seen in Fig. 2. For simplicity of illustration, the anthropomorphic phantoms analyzed in this study do not include simulated ducts.
Simulation of adipose and fibroglandular phantom regions
The breast outline and large scale phantom regions are simulated assuming vertical symmetry. The plane of symmetry [A-A′, shown in Fig. 3b], is parallel to the image plane of the mammographic mediolateral view. The breast outline is approximated by portions of two ellipsoidal surfaces, representing the upper and lower portions of the breast, attached horizontally at the nipple level. The outline is covered by a layer simulating skin; the thickness of the skin layer can be selected by the user.
In the phantom interior, ellipsoidal surfaces approximate the border between the adipose and fibroglandular regions (shown as gray and white, respectively, in Fig. 3); this border is simulated separately within the upper and lower portions of the phantom. At the beginning of the simulation procedure the user can interactively specify the length of ellipsoidal axes defining the shape and size of the phantom outline, as well as the size, shape, and position of the border between the adipose and fibroglandular regions.
The ellipsoidal approximation of the fibroglandular region is also used for initial selection of the breast phantom glandularity. The breast glandularity, also referred to as the breast density, describes the amount of dense (i.e., nonadipose) tissue in the breast. We define the glandularity of the anthropomorphic software phantom as the percentage of phantom volume occupied by the simulated dense tissue, including the fibroglandular tissue, Cooper’s ligaments, and skin.
Simulation of breast adipose compartments and Cooper’s ligaments based upon the region-growing algorithm
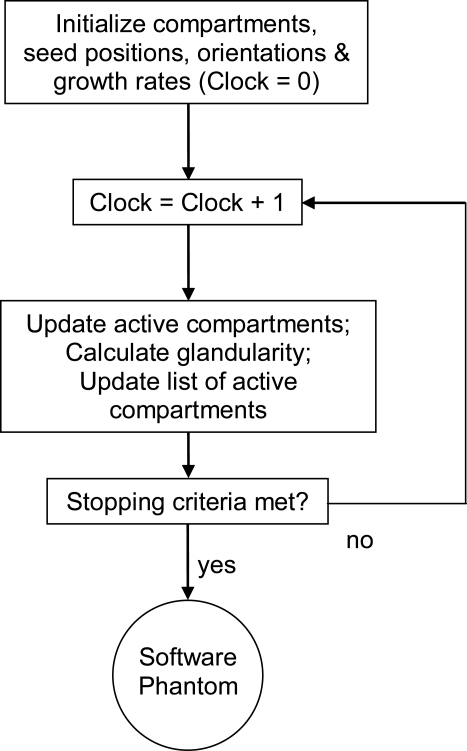
An iterative region-growing algorithm is used to simulate the breast adipose compartments and Cooper’s ligaments in the software phantom. Figure 4 shows a flow chart corresponding to the region-growing algorithm.
Figure 4.
Flow chart of the iterative region-growing procedure used for simulation of the adipose compartments and Cooper’s ligaments in the breast software phantom.
The simulation is initialized by selection of seed points. A compartment is then grown from each seed, assuming an initial ellipsoidal shape without constraints, and user-selected growing speed and orientation. The growth of all compartments continues simultaneously until the user-selected stopping criteria are met. The stopping criteria are continuously checked by tracking a list of actively updated compartments and by tracking the phantom glandularity during the region growing procedure. Each compartment is grown until it comes in contact with a neighboring compartment, the skin, the chest wall, or the border between the adipose and the fibroglandular phantom regions; the boundary voxels in contact with the neighboring object then become inactive. With this growing procedure, the shapes of the compartments are gradually transformed from being ellipsoidal to irregularly shaped; these more realistically represent the breast anatomy. The compartments in the adipose region are simulated first, followed by simulation of the compartments in the fibroglandular region; this approach provides more control over the phantom glandularity.
Initialization of the region-growing procedure
The user initializes the region-growing procedure by defining the number of seed points. The seeds are randomly positioned within the breast volume. As described above, each compartment is grown assuming an ellipsoidal shape initially with randomly selected axis ratios, and randomly selected growth speeds. The initial orientation of each compartment follows heuristically determined rules, illustrated in Fig. 5. The compartments are positioned approximately radial to the nipple–chest wall midline [Fig. 5b], and they fan out from the nipple to the chest wall [Fig. 5c]. Initially, each compartment is oriented so that its shortest axis corresponds to the surface normal of an ellipsoidal line passing through the nipple and the compartment seed point.
Figure 5.
Illustration of the compartment orientation scheme at the initialization of the region-growing procedure. (a) The compartment seeded at point A is oriented so that its shortest axis corresponded to the surface normal of an ellipsoid passing through the nipple and the seed point A. The initial distribution of the compartments is illustrated in (b) coronal and (c) vertical phantom sections.
Iterative region-growing procedure
During the region-growing procedure, each compartment is iteratively modified based upon the flow chart shown in Fig. 4. Additional control over the compartment shape is provided by varying the growth rates for individual compartments; different growth rates are implemented using a virtual clock. The fastest growing compartment determines the smallest time unit of the virtual clock. Each compartment is updated after a certain number of time units, depending on the compartment’s growth rate. The compartment update procedure includes (i) calculation of the compartment’s updated borders, (ii) successive testing of all boundary voxels to be included in the updated compartment (described below), and (iii) update of the list of active boundary voxels.
A unique table is created for each compartment to keep track of its active boundary voxels during the growing procedure. The table initially contains only the compartment seed point. During the compartment update, the six- (or 26-) neighborhood of each active boundary voxel are tested; we use six-neighborhood testing for computational expedience. Based on the test outcome, the table is updated to include newly acquired active boundary voxels, active boundary voxels, and to discard those voxels that become inactive or internal. A boundary voxel becomes internal if no neighboring objects (i.e., other compartments, the skin, or the border between the adipose and the fibroglandular phantom regions) are found in its six-neighborhood; the compartment’s existing internal voxels are ignored during the six-neighborhood testing. All noninternal voxels from the 6-neighborhood are included in the list of active boundary voxels.
Once a neighboring object has appeared in a 6-neighborhood of a compartment’s boundary voxel, the voxel becomes inactive; this prevents the expansion of another compartment to this voxel. When no active voxels remain in the table, it would indicate that the associated compartment has grown to full contact with its neighboring objects, and it can be deleted from the list of active compartments.
Stopping criteria of the region-growing procedure
Different stopping criteria are used for the region-growing procedures in the adipose and fibroglandular regions of the software phantom. In the adipose phantom region, all compartments grow until they are in full contact with their neighboring compartments, the skin, or the breast boundary. To provide for a less geometric appearance in synthetic images, the compartments are allowed to penetrate the border between the adipose and fibroglandular regions. The extent of penetration is controlled by reducing the growth rate beyond the border.
The adipose compartments in the fibroglandular region of real breasts are smaller and less compactly distributed compared to the compartments in the adipose phantom region. Therefore, we simulated the adipose compartments in the fibroglandular phantom region using a different stopping criterion. The region-growing procedure in the fibroglandular region is stopped before all the compartments become inactive; this is achieved by using the desired phantom glandularity as a stopping criterion. Simulated adipose compartments within the fibroglandular region replace fibroglandular tissue with fat, thus effectively reducing the initial phantom glandularity. To control the phantom glandularity, we track the glandularity values during the region-growing procedure; growth is stopped when the desired glandularity is achieved.
Statistical methods for characterization of the software breast phantom
The adipose compartments’ size distribution was used to characterize the software phantom parenchymal properties. Histograms of the compartment volumes were computed as a function of the number of the initially selected seed points and the phantom size. The compartment volume histograms were computed for a set of 212 phantoms, each with 450 ml volume. The phantoms had the same outline and the same border between the adipose and fibroglandular regions, and various distributions of adipose compartments; the numbers of adipose compartments were selected from the Poisson distribution.
Imaging simulations
We have simulated DBT exams with a two step procedure. First, the software phantom is deformed using a finite-element model to simulate breast compression during the DBT exam; this compression is similar to mammographic compression. A finite-element tissue deformation model has been implemented using the Abaqus software package (version 6.6, DS Simulia Corp., Providence, R.I.), based upon the model proposed by Ruiter et al. for registration of mammograms and breast MR images.50 Briefly, the whole breast is modeled as homogenous, isotropic, neo-Hookean, and nearly incompressible (Poisson ratio ν = 0.475) material, with a Young’s elasticity modulus of E = 48.6 kPa (Ref. 20); these material properties yield the most realistic range of compression forces, as shown in previous experiments.41, 50
Second, the x-ray projections of the compressed phantom are simulated using a mono-energetic x-ray acquisition model without scatter. Assuming an x-ray energy of 20 keV, values of the linear x-ray attenuation coefficients are 0.456 cm−1 for adipose tissue, 0.802 cm−1 for glandular and connective tissue and skin,46, 51 and 0.94 × 10⁻³ cm−1 for air.52 The simulated DBT acquisition geometry assumes a source–detector distance of 66 cm, with the x-ray tube positioned within an angular range of (−18.6, 18.6) degrees, with a separation of 2.66°, corresponding to a DBT prototype system (Senographe DS, GE Healthcare, Chalfont St. Giles, UK). The x-ray detector model assumes 100 μm∕pixel spatial resolution with a 23 cm × 19 cm field-of-view.
RESULTS
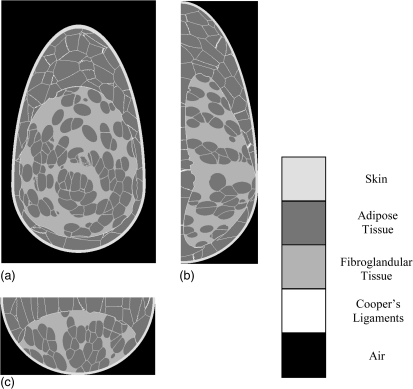
Figure 6 shows three orthogonal slices of a 450 ml phantom. Simulated tissue structures are represented by different gray values assigned to skin, adipose tissue in the adipose region, Cooper’s ligaments, adipose tissue in the fibroglandular region, and fibroglandular tissue.
Figure 6.
Three orthogonal slices of a breast phantom realization: (a) Coronal view; (b) Vertical view; (c) Horizontal view.
Breast phantoms with different size and glandularity
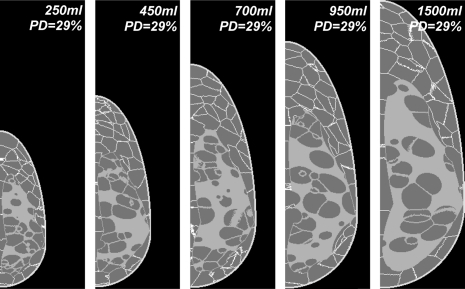
Figure 7 illustrates the simulation of various breast sizes. Shown are the central slices of five phantoms, with breast volumes of 250, 450, 700, 950, and 1500 ml. The volume selection was guided in part by the published breast volumes measured in 355 women with different bra cup sizes.53 The phantoms shown were generated with an isotropic spatial resolution of 500 μm and a glandularity of 29%.
Figure 7.
Central slices through five anthropomorphic software breast phantoms corresponding to various simulated breast sizes.
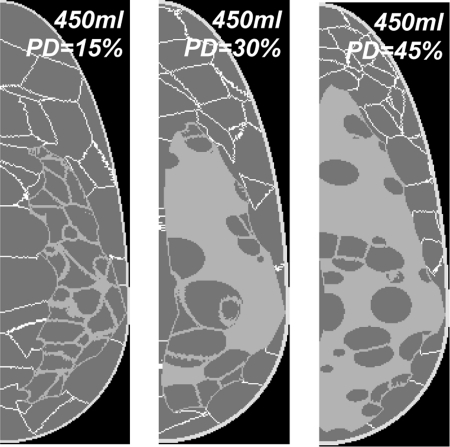
Figure 8 shows central slices through three 450 ml phantoms generated with different glandularities. The phantoms have a spatial resolution of 500 μm.
Figure 8.
Central slices of three 450 ml phantoms with glandularity of (left to right) 15%, 30%, and 45%.
Breast phantoms with different number and distribution of adipose compartments
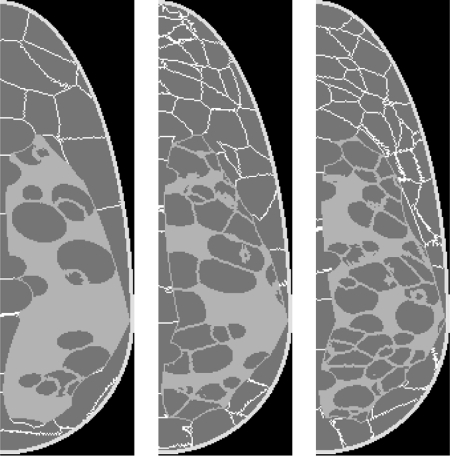
Simulated breasts with different numbers of adipose compartments are illustrated in Fig. 9. Three 450 ml phantoms with 500 μm resolution were generated by initializing (left to right) 100, 200, and 300 seeds in the adipose phantom region, and 67, 133, and 200 seeds in the fibroglandular region, respectively, with glandularity of 29%. The average compartment volumes in the adipose (fibroglandular) region are 2.30 ml (1.26 ml), 1.16 ml (0.63 ml), and 0.78 ml (0.39 ml), respectively.
Figure 9.
Central slices of three phantom realizations with different adipose compartments sizes.
Volume of simulated compartments as a function of the number of compartments and the phantom size
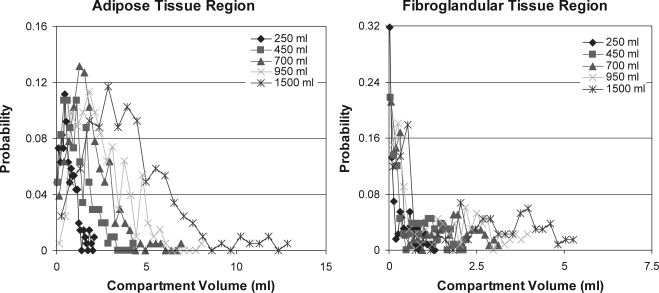
Figure 10 shows histograms of the adipose compartment volumes computed in phantoms of various volumes. The volume histograms were computed separately for the compartments within the adipose and fibroglandular phantom regions. The phantoms were generated with a spatial resolution of 500 μm, 200 compartments in the adipose region and 133 compartments in the fibroglandular region, and glandularity of 29% ± 0.6%. (cross-sections of the analyzed phantoms were shown in Fig. 7).
Figure 10.
Histograms of the volumes of adipose compartments simulated within the adipose region (left) and fibroglandular region (right) for various phantom sizes. (Note different scale used in the two graphs).
The average volumes of the compartments in the adipose and fibroglandular regions, computed based upon the histograms from Fig. 10, are shown in Table TABLE I. (central row). Table TABLE I. also shows the average compartment volumes for the phantoms with 100 compartments in the adipose region and 67 compartments in the fibroglandular region (top row), as well as for the phantoms with 300 adipose and 200 fibroglandular region compartments (bottom row).
Table 1.
Average volumes of the compartments simulated in the adipose (bold) and fibroglandular (normal) regions of phantoms of various volumes and different numbers of compartments.
| Mean volume (ml) of compartments in adipose (bold) and fibroglandular (normal) phantom regions | Phantom volume | |||||
|---|---|---|---|---|---|---|
| (ml) | ||||||
| 250 | 450 | 700 | 950 | 1500 | ||
| Number of compartments in adipose (bold) and fibroglandular (normal) regions | 100 | 1.3 ± 0.8 | 2.3 ± 1.4 | 3.6 ± 2.0 | 4.9 ± 2.6 | 7.7 ± 4.4 |
| 67 | 0.7 ± 0.7 | 1.3 ± 1.3 | 2.0 ± 1.7 | 2.5 ± 2.7 | 4.0 ± 4.0 | |
| 200 | 0.6 ± 0.4 | 1.2 ± 0.8 | 1.8 ± 1.1 | 2.5 ± 1.4 | 3.9 ± 2.3 | |
| 133 | 0.3 ± 0.4 | 0.6 ± 0.6 | 1.0 ± 1.0 | 1.4 ± 1.2 | 2.0 ± 1.6 | |
| 300 | 0.4 ± 0.3 | 0.8 ± 0.5 | 1.2 ± 0.8 | 1.7 ± 1.0 | 2.7 ± 1.7 | |
| 200 | 0.2 ± 0.2 | 0.4 ± 0.4 | 0.6 ± 0.6 | 0.8 ± 0.8 | 1.2 ± 1.2 | |
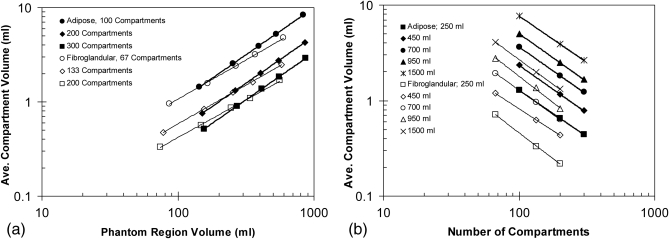
Figure 11 shows a log–log plot of the average compartment volumes (from Table TABLE I.) as a function of the number of compartments and the phantom size; the phantom size is expressed by the volume of the adipose or fibroglandular phantom region, as shown in Table TABLE II.. (The difference between the total phantom volume and the sum of adipose and fibroglandular regions volume corresponds to the volume occupied by Cooper’s ligaments and the skin). Table TABLE III. shows the slopes and intercepts of the power law fits (i.e., the linear fits of the log–log plots) of the average compartment volume as a function of the phantom size. The fitted slope is equal to 1.03 ± 0.013 for compartments in the adipose region, and 0.89 ± 0.030 for compartments in the fibroglandular region. Table TABLE IV. shows the slopes and intercepts of the power law fits of the average compartment volume as a function of the number of compartments. The fitted slope is equal to −0.99 ± 0.017 for compartments in the adipose region, and −1.03 ± 0.070 for compartments in the fibroglandular region.
Figure 11.
Log–log plots of the average volumes of simulated adipose compartments as function of (a) the phantom size (with the number of compartments used as a parameter) and (b) the number of compartments (with the phantom volume used as a parameter). The lines represent the power law fits.
Table 2.
Volumes of the adipose (bold) and fibroglandular (normal) regions of phantoms of various volume and different numbers of compartments.
| Volume (ml) of adipose (bold) and fibroglandular (normal) regions | Phantom volume (ml) | |||||
|---|---|---|---|---|---|---|
| 250 | 450 | 700 | 950 | 1500 | ||
| Number of compartments in adipose (bold) and fibroglandular (normal) regions | 100 | 143.4 ± 0.9 | 254.6 ± 2.0 | 392.0 ± 3.0 | 528.3 ± 4.6 | 833.4 ± 3.3 |
| 67 | 86.0 ± 0.9 | 164.7 ± 2.0 | 266.6 ± 3.0 | 370.8 ± 4.6 | 597.5 ± 3.3 | |
| 200 | 151.7 ± 0.8 | 263.7 ± 2.0 | 404.0 ± 2.4 | 546.2 ± 3.4 | 854.9 ± 4.8 | |
| 133 | 77.6 ± 0.8 | 155.6 ± 2.0 | 254.6 ± 2.4 | 352.9 ± 3.4 | 575.9 ± 4.8 | |
| 300 | 155.4 ± 1.1 | 271.0 ± 2.7 | 413.8 ± 2.5 | 557.3 ± 3.1 | 870.0 ± 7.9 | |
| 200 | 73.9 ± 1.1 | 148.2 ± 2.7 | 244.8 ± 2.5 | 341.8 ± 3.1 | 560.9 ± 7.9 | |
Table 3.
Power law fit parameters of the average volumes of simulated adipose compartments as a function of the number of simulated compartments and the phantom region volumes.
| Fit parameters | Goodness of fit | |||
|---|---|---|---|---|
| Slope | Intercept | |||
| Number of compartments in adipose (bold) and fibroglandular (normal) regions | 100 | 1.00 | −2.00 | 1.0000 |
| 67 | 0.83 | −1.63 | 0.9992 | |
| 200 | 1.00 | −2.30 | 1.0000 | |
| 133 | 0.82 | −1.87 | 0.9998 | |
| 300 | 1.00 | −2.48 | 1.0000 | |
| 200 | 0.80 | −1.97 | 0.9989 | |
Table 4.
Power law fit parameters of the average volumes of simulated adipose compartments as a function of the number of simulated compartments and the phantom size.
| Adipose (bold) and fibroglandular (normal) phantom regions | Phantom volume (ml) | |||||
|---|---|---|---|---|---|---|
| 250 | 450 | 700 | 950 | 1500 | ||
| Fit parameters | Slope | −0.97 | −1.00 | −0.99 | −1.01 | −0.97 |
| −1.08 | −0.92 | −1.02 | −1.09 | −1.04 | ||
| Intercept | 2.05 | 2.37 | 2.55 | 2.72 | 2.82 | |
| 2.01 | 1.91 | 2.32 | 2.64 | 2.68 | ||
| Goodness of fit (R2) | 1.000 | 0.9997 | 0.9999 | 1.0000 | 1.0000 | |
| 0.9994 | 0.9999 | 0.9999 | 0.9970 | 1.0000 | ||
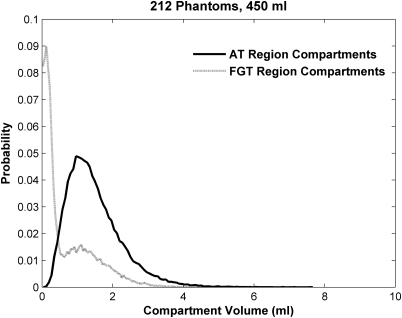
Figure 12 shows volume histograms of all compartments from the adipose and fibroglandular regions of 212 phantoms generated with the number of compartments selected from a Poisson distribution. The number of compartments in the adipose region (mean and SD) was 201.8 ± 12.8, range 167–231, and in the fibroglandular region 129.2 ± 10.3, range 103–157.
Figure 12.
Volume histograms of adipose compartments simulated in adipose and fibroglandular regions from 212 phantoms generated with the compartment numbers selected from a Poisson distribution.
Simulated DBT projections and reconstructed images
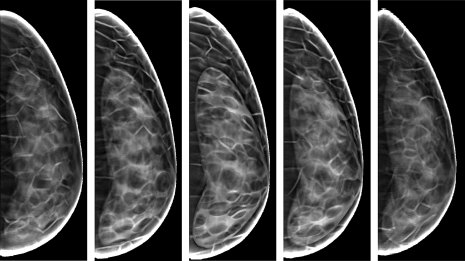
Figure 13 shows five simulated DBT projections of the phantom shown in Fig. 6. These five projections were chosen as being representative of the fifteen projections used for DBT reconstruction. A corresponding DBT reconstructed phantom central slice (i.e., slice through the nipple) is shown in Fig. 14. The compressed phantom thickness was 5 cm, equal to 50% of the uncompressed phantom thickness. The reconstructed images were obtained using a backprojection filtered reconstruction algorithm.2, 3
Figure 13.
Simulated DBT projections of the software breast phantom from Fig. 6 acquired under the simulated x-ray tube angles of (left to right): −18.6, −8.0, 0, 8.0, and 18.6°.
Figure 14.
Slices reconstructed from the simulated DBT projections of the software phantom shown in Fig. 6, corresponding to the distance from the breast support of (left to right): 8.5, 17.0, 25.6, 34.1, and 42.7 mm. The compressed breast thickness was 51.2 mm. (DBT images reconstructed using an algorithm developed by Real-Time Tomography, LLC).
Quality of simulated phantom images was visually assessed by clinical radiologists from the Breast Imaging Center of the Hospital of the University of Pennsylvania, who emphasized the high level of realism. Examples of their comments about the digital mammograms simulated using phantoms of various glandularities included:54 “Images appear fairly realistic,” “Ligaments prominent with lower density––as in clinical images,” “Denser phantoms appear more realistic––tissue appears fairly realistic in terms of distribution and density.”
DISCUSSION
We have proposed a new algorithm for generating anthropomorphic software breast phantoms. Based upon the region-growing method, simulated adipose compartments and the border between the adipose and fibroglandular regions have a less regular appearance, thus improving the realism of the synthetic images.
The phantom provides ground truth information about simulated tissues and flexibility in covering wide anatomical variations. The ground truth information is generally not available in clinical images; it would require histological analysis of every imaged breast, including normal ones. Great flexibility of the phantom design is provided through a list of user-controlled simulation parameters, defining the size and shape of the breast outline, the border between the adipose and fibroglandular regions, and the seed point location, orientation, and growth speed for each adipose compartment. As illustrated in Figs. 789, the proposed phantom design successfully simulated variations in breast size, glandularity, and parenchymal pattern.
The phantom glandularity depends on the size of the breast, the size of the fibroglandular region, and the number and size of simulated compartments in the fibroglandular region. Figure 8 shows three phantom realizations with large differences in glandularity, which are primarily controlled by the size of the fibroglandular region. In comparison, smaller differences in glandularity are generated by varying the number of adipose compartments in the fibroglandular region, while keeping the size of the fibroglandular region the same.
Use of simulated images may be helpful to overcome the limited range of anatomical variations observed in clinical studies. Although clinical images provide a high level of realism, the small number of available cases effectively limits the range of variations. Different distributions of the adipose compartments results in variations of the breast parenchymal pattern.
The average volume of the compartments simulated in the adipose and fibroglandular phantom regions was directly proportional to the region volumes, as shown in Table TABLE III.. Larger deviation from unity (0.89 vs 1.03) in the slope of the log–log plot for the fibroglandular region compartments compared to the adipose region compartments could be related to the procedure for growing adipose region compartments; those regions are allowed to penetrate the border between the adipose and fibroglandular regions, thus effectively reducing the fibroglandular region volume. The average compartment volume was also inversely proportional to the number of simulated compartments, as shown in Table TABLE IV.. The observed dependence could be expected as simulated compartments fill almost completely the adipose phantom region (except for the voxels belonging to the Cooper’s ligaments). In the fibroglandular region, the total volume filled with simulated compartments is determined by the desired phantom glandularity. Since we simulated phantoms of the same glandularity (29%), the sum of the fibroglandular region compartment volumes was proportional to the phantom volume.
The improved control over the phantom generation and improved realism of the tissue simulation provided by the new algorithm facilitate wider phantom use in development and optimization of breast imaging modalities and image processing methods. Applications of the software phantom which have been supported by the new phantom design include:
-
(i)
Validation and optimization of DBT reconstruction methods. We have used the ground truth information of the simulated anatomy provided by the phantom in a task-based optimization of a commercial DBT reconstruction method,2 and for validation of DBT reconstruction geometric accuracy.3
-
(ii)
Comparison of power spectra descriptors calculated from simulated phantom DBT projections and reconstructed images. We have calculated power spectrum beta exponent values5, 55 using the simulated DBT projections and reconstructed images of our anthropomorphic software phantom. Simulated images exhibited a range of beta exponent values comparable with clinical data.56, 57
-
(iii)
Analyses of the effects of the anatomical variations and acquisition parameters on the properties of simulated images. Synthetic images of the phantom have been used in analysis of the effects of DBT acquisition parameters on reconstructed image texture.58 Improved realism of the simulated anatomy is beneficial for psychophysical studies; synthetic images generated with our phantom have been also used in an ongoing observer study of tumor visibility in DBT.59
-
(iv)
Development of physical phantoms for the purpose of rapid prototyping. The novel phantom design has been used for developing the first prototype 3D anthropomorphic physical phantom corresponding to a 450 ml, 42% glandular breast.60, 61
-
(v)
Simulation of multimodality breast imaging. We have used the proposed phantom design to simulate magnetic resonance and ultrasound tomography images of the breast. Simulated ultrasound breast tomography images have been used for validation of a method for estimating breast glandularity based upon the sound speed values.54
Software phantoms based upon anatomically derived rules for tissue simulation (including our phantom) are complementary to the phantoms based directly upon individual clinical image sets (e.g., Refs. 15, 16). While the latter provides a high level of realism, the former has advantages in terms of flexibility and known ground truth. These advantages justify the separate development of these two distinct phantom types.
CONCLUSIONS
Our previously developed anthropomorphic software breast phantom has been redesigned using a region-growing algorithm. The proposed algorithm was capable of simulating breast phantoms of different volume, glandularity, and adipose compartment distribution. The region-growing based approach allowed us to simulate adipose compartments with various size and shape and to reduce geometric appearance of the border between the adipose and fibroglandular regions. Qualitatively, simulated images of the phantom generated using the proposed algorithm have more realistic appearance compared to previous versions of the phantom.
ACKNOWLEDGMENTS
This work is supported by Susan G. Komen Breast Cancer Foundation Research Grant BCTR133506, NIH Delaware IdeA Networks of Biomedical Research Excellence (INBRE Grant, NSF Research Grant IIS-0916690, and NIH Grant NIH-R01-CA102758). The authors would like to thank Dr. S. J. Glick, University of Massachusetts, for providing the breast CT images of mastectomy specimen, Dr. C. Mies, University of Pennsylvania, for the assistance with acquiring photographs of the whole-breast pathological sections, Dr. S. C. Gavenonis and Dr. E. F. Conant, Breast Imaging Center, University of Pennsylvania, for their help with visual assessment of simulated image quality, and S. Ng for the use of the DBT reconstruction algorithm developed by the Real-Time Tomography, LLC.
References
- et al., “American cancer society guidelines for breast screening with MRI as an adjunct to mammography,” Ca-Cancer J. Clin. 57, 75–89 (2007). 10.3322/canjclin.57.2.75 [DOI] [PubMed] [Google Scholar]
- Bakic P. R., Ng S., Ringer P., Carton A.-K., Conant E. F., and Maidment A. D. A., Validation and optimization of digital breast tomosynthesis reconstruction using an anthropomorphic software breast phantom,” SPIE Medical Imaging: Physics of Medical Imaging, Vol. 7622, edited by Samei E. and Pelc N., San Diego, CA, 2010. [Google Scholar]
- Bakic P. R., Ringer P., Kuo J., Ng S., and Maidment A. D. A., “Analysis of geometric accuracy in digital breast tomosynthesis reconstruction,” in Digital Mammography (IWDM), edited by Martí J., Oliver A., Freixenet J., and Martí R., Lecture Notes in Computer Science (Springer-Verlag, Berlin Heidelberg, 2010), Vol. 6136, pp. 62–69. [Google Scholar]
- Wolfe J. N., Risk for breast cancer development determined by mammographic parenchymal pattern,” Cancer 37(5), 2486–2492 (1976). [DOI] [PubMed] [Google Scholar]
- Burgess A. E., “Mammographic structure: Data preparation and spatial statistics analysis,” SPIE Medical Imaging: Image Processing, edited by Hanson K. M., San Diego, CA, 1999, Vol. 3661, pp. 642–653. [Google Scholar]
- Bochud F. O., Abbey C. K., and Eckstein M. P., “Statistical texture synthesis of mammographic images with clustered lumpy backgrounds,” Opt. Express 4(1), 33–42 (1999). 10.1364/OE.4.000033 [DOI] [PubMed] [Google Scholar]
- et al., “Mammographic texture synthesis: Second-generation clustered lumpy backgrounds using a genetic algorithm,” Opt. Express 16(11), 7595–7607 (2008). 10.1364/OE.16.007595 [DOI] [PubMed] [Google Scholar]
- Heine J.J., Deans S. R., Velthuizen R. P., and Clarke L. P., On the statistical nature of mammograms,” Med. Phys. 26(11), 2254–2265 (1999). 10.1118/1.598739 [DOI] [PubMed] [Google Scholar]
- Taylor P. and Owens R., “Simulated mammography using synthetic 3Dbreasts,” in Digital Mammography, Nijmegen, 1998, edited by Karssemeijer N., Thijsen M., Hendriks J., and van Erning L., Computational Imaging and Vision (Kluwer, Dordrecht, 1998), Vol. 13, pp. 283–290. [Google Scholar]
- Taylor P., Owens R., and Ingram D., “3D fractal modelling of breast growth,” in Fifth International Workshop on Digital Mammography, 2000–2001, edited by Yaffe M. J. (Medical Physics Publishing, Toronto, Canada, 2000), pp. 785–791. [Google Scholar]
- Bliznakova K., Bliznakov Z., Bravou V., Kolitsi Z., and Pallikarakis N., “A three-dimensional breast software phantom for mammography simulation,” Phys. Med. & Biol. 48(22), 3699–3719 (2003). 10.1088/0031-9155/48/22/006 [DOI] [PubMed] [Google Scholar]
- Zyganitidis C., Bliznakova K., and Pallikarakis N., “A novel simulation algorithm for soft tissue compression,” Med. Biol. Eng. Comput. 45(7), 661–669 (2007). 10.1007/s11517-007-0205-y [DOI] [PubMed] [Google Scholar]
- A. Ma K.W., Gunn S., and Darambara D. G., “Introducing DeBRa: A detailed breast model for radiological studies,” Phys. Med. Biol. 54, 4533–4545 (2009). 10.1088/0031-9155/54/14/010 [DOI] [PubMed] [Google Scholar]
- Bliznakova K., Suryanarayanan S., Karellas A., and Paiilikarakis N., “Evaluation of an improved algorithm for producing realistic 3D breast software phantoms: Application for mammography,” Med. Phys. 37(11), 5604–5617 (2010). 10.1118/1.3491812 [DOI] [PMC free article] [PubMed] [Google Scholar]
- Li C. M., Segars W. P., Lo J. Y., Veress A. I., Boone J. M., and J. T.Dobbins, III, “Computerized 3D breast phantom with enhanced high-resolution detail,” SPIE Medical Imaging: Physics of Medical Imaging, edited by Samei E. and Hsieh J., Vol. 7258, Lake Buena Vista, FL, 2009. [Google Scholar]
- Li C. M., Segars W. P., Tourassi G. D., Boone J. M., and Dobbins J. T., I, “Methodology for generating a 3D computerized breast phantom from empirical data,” Med. Phys. 36(7), 3122–3131 (2009). 10.1118/1.3140588 [DOI] [PMC free article] [PubMed] [Google Scholar]
- Hoeschen C., Fill U., Zankl M., Panzer W., Regulla D., and Dohring W., “A high resolution voxel phantom of the breast for dose calculations in mammography,” Radiat. Prot. Dosim. 114 (1–3), 406–409 (2005). [DOI] [PubMed] [Google Scholar]
- O’Connor J.M., Das M., Didier C., Mah’D M., and Glick S.J., “Comparison of two methods to develop breast models for simulation of breast tomosynthesis and CT,” in Digital Mammography (IWDM), edited by Krupinski E. A., Lecture Notes in Computer Science (Springer-Verlag, Berlin Heidelberg, 2008), Vol. 5116, pp. 417–425. [Google Scholar]
- Bakic P. R., Brzakovic D., Brzakovic P., and Zhu Z., An approach to using a generalized breast model to segment digital mammograms,” in Eleventh Symposium on Computer-Based Medical Systems, Lubbock, TX, 1998, Vol. 3659, pp. 84–89.
- Bakic P. R., Brzakovic D., and Zhu Z., “Anatomic segmentation of mammograms via breast model,” in Digital Mammography, Nijmegen, 1998, edited by Karssemeijer N., Thijsen M., Hendriks J., and van Erning L., Computational Imaging and Vision (Kluwer, Dordrecht, 1998), Vol. 13, pp. 291–294. [Google Scholar]
- Bakic P. R. and Brzakovic D., “Simulation of digital mammogram acquisition,” SPIE Medical Imaging: Physics of Medical Imaging, edited by Boone J. M. and J. T.Dobbins, III, San Diego, CA, 1999, Vol. 3659 pp. 866–877. [Google Scholar]
- Bakic P. R., Albert M., Brzakovic D., and Maidment A. D. A., “Mammogram synthesis using a 3D simulation. I. Breast tissue model and image acquisition simulation,” Med. Phys. 29(9), 2131–2139 (2002). 10.1118/1.1501143 [DOI] [PubMed] [Google Scholar]
- Bakic P. R., Carton A.-K., Kontos D., Zhang C., Troxel A. B., and Maidment A. D. A., “Breast percent density estimation from mammograms and central tomosynthesis projections,” Radiology, 252, 40–49 (2009). [DOI] [PMC free article] [PubMed] [Google Scholar]
- Viennot X. G., Eyrolles N., Janey N., and Arques D., “Combinatorial analysis of ramified patterns and computer imagery of trees,” Comput. Graph 23, 31–40 (1989). 10.1145/74334.74336 [DOI] [Google Scholar]
- Bakic P. R., Albert M., Brzakovic D., and Maidment A. D. A., “Mammogram synthesis using a 3D simulation. II. Evaluation of synthetic mammogram texture,” Med. Phys. 29(9), 2140–2151 (2002). 10.1118/1.1501144 [DOI] [PubMed] [Google Scholar]
- Bakic P. R., Albert M., Brzakovic D., and Maidment A. D. A., “Evaluation of breast ductal network using ramification matrices,” in Digital Mammography IWDM 2002, Sixth International Workshop on Digital Mammography, edited by Peitgen H.-O. (Springer-Verlag, Berlin Heidelberg, 2002), pp. 249–252. [Google Scholar]
- Bakic P. R., Albert M., Brzakovic D., and Maidment A. D. A., “Mammogram synthesis using a three-dimensional simulation. III. Modeling and evaluation of the breast ductal network,” Med. Phys. 30(7), 1914–1925 (2003). 10.1118/1.1586453 [DOI] [PubMed] [Google Scholar]
- Bakic P. R., Albert M., and Maidment A. D. A., “Classification of galactograms with ramification matrices: Preliminary results,” Acad. Radiol. 10(2), 198–204 (2003). 10.1016/S1076-6332(03)80045-4 [DOI] [PubMed] [Google Scholar]
- Dance D. R., Hunt R., Bakic P. R., Maidment A. D. A., and Sandborg M., “Computer simulation of x-ray mammography using high resolution voxel phantoms,” Med. Phys. 30, 1456 (2003). [Google Scholar]
- Dance D. R., Hunt R., Bakic P. R., Maidment A. D. A., and Sandborg M., “Computer simulation of x-ray mammography using high resolution voxel phantoms,” Med. Phys. 30(6), 1456 (2003). 10.1093/rpd/nch510 [DOI] [Google Scholar]
- Mundy D. W. and Jevremovic T., “Monte Carlo assessment of boron neutron capture therapy for the treatment of breast cancer,” Nuclear Technology and Radiation Protection 20(1), 27–32 (2005). [Google Scholar]
- Mundy D. W., Herb W., and Jevremovic T., “Radiation binary targeted therapy for HER-2 positive breast cancers: Assumptions, theoretical assessment and future directions,” Phys. Med. Biol. 51, 1377–1391 (2006). 10.1088/0031-9155/51/6/001 [DOI] [PubMed] [Google Scholar]
- Goncalves-Carralves M. L. S. and Jevremovic T., “Numerical assessment of radiation binary targeted therapy for HER-2 positive breast cancers: Advanced calculations and radiation dosimetry,” Phys. Med. Biol. 52, 4245–4264 (2007). 10.1088/0031-9155/52/14/015 [DOI] [PubMed] [Google Scholar]
- Tischenko O., Hoeschen C., Dance D.R., Hunt R.A., Maidment A.D.A., and Bakic P.R., “Evaluation of a novel method of noise reduction using computer-simulated mammograms,” Radiat. Prot. Dosim. 114 (1–3) 81–84 (2005). [DOI] [PubMed] [Google Scholar]
- Hoeschen C., Tischenko O., Dance D. R., Hunt R. A., Bakic P. R., and Maidment A. D. A., “Testing a wavelet based noise reduction method using computer simulated mammograms, SPIE Medical Imaging: Physics of Medical Imaging, edited by Flynn M. J., San Diego, CA, 2005, Vol. 5745, pp. 969–978.
- Richard F. J. P., Bakic P. R., and Maidment A. D. A.: “Non-rigid registration of mammograms obtained with variable breast compression: a phantom study,” in Biomedical Image Registration (WBIR) edited by Gee J. C., Maintz J.B.A., and Vannier M.W., Lecture Notes in Computer Science, (Springer-Verlag, Berlin Heidelberg: 2003), Vol. 2717, pp. 281–290. [Google Scholar]
- Bakic P. R.Richard F. J. P., and Maidment A. D. A., “Effect of breast compression on registration of successive mammograms,” in Digital Mammography (IWDM), Seventh International Workshop on Digital Mammography, edited by Pisano E. (The University of North Carolina, Biomedical Research Imaging Center, Chapel Hill, 2005), pp. 691–697.
- Richard F. J. P., Bakic P. R., and Maidment A. D. A., “Mammogram registration: A phantom-based evaluation of compressed breast thickness variation effects,” IEEE Trans. Med. Imaging 25(2), 188–197 (2006). 10.1109/TMI.2005.862204 [DOI] [PubMed] [Google Scholar]
- Bakic P. R., Richard F. J. P., and Maidment A. D. A., “Registration of mammograms and breast tomosynthesis images,” in Digital Mammography (IWDM), edited by Astley S. M., Brady M., Rose C., and Zwiggelaar R., Lecture Notes in Computer Science 4046, 498–503, (Springer-Verlag, Berlin Heidelberg: 2006). 10.1007/11783237_67 [DOI] [Google Scholar]
- Bakic P. R., Richard F. J. P., and Maidment A. D. A., “2D-to-3D x-ray breast image registration,” in Biomedical Image Registration (WBIR), edited by Pluim J. P. W., Likar B., and Gerritsen F. A., Lecture Notes in Computer Science (Springer-Verlag, Berlin Heidelberg, 2006), Vol. 4057, pp. 84–91. [Google Scholar]
- Ruiter N. V., Zhang C., Bakic P. R., Carton A.-K., Kuo J., and Maidment A. D. A., “Simulation of tomosynthesis images based on an anthropomorphic software breast tissue phantom,” SPIE Medical Imaging: Visualization, Image-guided Procedures, and Modeling, edited by Miga M. I. and Cleary K. R., Vol. 6918San Diego, CA, 2008. [Google Scholar]
- S. Wellings R., Jensen H. M., and Marcum R. G., “An atlas of the subgross pathology of the human breast,” J. Natl. Cancer Inst. 55, 231–273 (1975). [PubMed] [Google Scholar]
- Pope T. L., Read M. E., Medsker T., Buschi A. J., and Brenbridge A. N., “Breast skin thickness: Normal range and cause of thickening shown on film-screen mammography,” J. Canadian Assoc. Radiol. 35(4), 365–368 (1984). [PubMed] [Google Scholar]
- Ulger H., Erdogan N., Kumanlioglu S., and Unue E., “Effect of age, breast size, menopausal and hormonal status on mammographic skin thickness,” Skin Res. Technol. 9(3), 284–289 (2003). 10.1034/j.1600-0846.2003.00027.x [DOI] [PubMed] [Google Scholar]
- Cooper A., On the Anatomy of the Breast (Longman, London, 1840). [Google Scholar]
- Johns P. C. and Yaffe M. J., “X-ray characterisation of normal and neoplastic breast tissues,” Phys. Med. & Biol. 32(6), 675–695 (1987). 10.1088/0031-9155/32/6/002 [DOI] [PubMed] [Google Scholar]
- Dinkel H. P. et al. , “Predictive value of galactographic patterns for benign and malignant neoplasms of the breast in patients with nipple discharge,” Br. J. Radiol. 73(871), 706–714 (2000). [DOI] [PubMed] [Google Scholar]
- Hou M. F., Huang T. J., Liu G. C., “The diagnostic value of galactography in patients with nipple discharge,” Clin. Imaging 25, 75–81 (2001). 10.1016/S0899-7071(01)00256-X [DOI] [PubMed] [Google Scholar]
- Glick S. J., “Breast CT,” Annu. Rev. Biomed. Eng. 9, 501–526 (2007). 10.1146/annurev.bioeng.9.060906.151924 [DOI] [PubMed] [Google Scholar]
- Ruiter N. V., Stotzka R., Muller T.-O., Gemmeke H., Reichenbach J. R., and Kaiser W. A., Model-based registration of x-ray mammograms and MR images of the female breast,” IEEE Trans. Nucl. Sci. 53(1), 204–211 (2006). 10.1109/TNS.2005.862983 [DOI] [Google Scholar]
- Hammerstein G. R., Miller D. W., and White D. R., “Absorbed radiation dose in mammography,” Radiology 130, 485–491 (1979). [DOI] [PubMed] [Google Scholar]
- Hubbell J. H. and Seltzer S. M., Tables of X-Ray Mass Attenuation Coefficients and Mass Energy-Absorption Coefficients (National Institute of Standards and Technology, 1996). [Google Scholar]
- Ringberg A., Bageman E., Rose C., Ingvar C., and Jernstrom H., “Of cup and bra size: Reply to a prospective study of breast size and premenopausal breast cancer incidence,” Int. J. Cancer 119(9), 2242–2243 (2006). 10.1002/ijc.v119:9 [DOI] [PubMed] [Google Scholar]
- Bakic P. R.et al. , “Comparison of 3D and 2D breast density estimation from synthetic ultrasound tomography images and digital mammograms of anthropomorphic software breast phantoms,” SPIE Medical Imaging: Physics of Medical Imaging, edited by Pelc N. J., Samei E., and Nishikawa R. M., Vol. 7961, Lake Buena Vista, FL, 2011. [Google Scholar]
- Engstrom E., Reiser I., and Nishikawa R. M., “Comparison of power spectra for tomosynthesis projections and reconstructed images,” Med. Phys. 36, 1753–1758 (2009). 10.1118/1.3116774 [DOI] [PMC free article] [PubMed] [Google Scholar]
- Bakic P. R., Lau B., Carton A.-K., Reiser I., Nishikawa R., and Maidment A. D. A., “An anthropomorphic software breast phantom for tomosynthesis simulation: power spectrum analysis of phantom projections,” In: Digital Mammography (IWDM), edited by edited by Martí J., Oliver A., Freixenet J., and Martí R., Lecture Notes in Computer Science (Springer-Verlag, Berlin Heidelberg, 2010), Vol. 6136, pp. 452–458. [Google Scholar]
- Lau B., Bakic P. R., Reiser I., Carton A.-K., Maidment A. D. A., Nishikawa R., and, “An anthropomorphic software breast phantom for tomosynthesis simulation: Power spectrum analysis of phantom reconstructions,” Med. Phys. 37, 3437 (2010) [Google Scholar]
- Kontos D., Zhang C., C., Ruiter, Bakic P. R., and Maidment A. D. A., “Evaluating the effect of tomosynthesis acquisition parameters on image texture: A study based on an anthropomorphic breast tissue software model,” in Digital Mammography (IWDM), edited by Krupinski E. A., Lecture Notes in Computer Science, (Springer-Verlag, Berlin Heidelberg, 2008), Vol. 5116, pp. 681–688. [Google Scholar]
- Young S., Park S., Anderson K., Badano A., Myers K. J., and Bakic P. R., “Estimating DBT performance in detection tasks with variable-background phantoms,” SPIE Medical Imaging: Physics of Medical Imaging, edited by Samei E. and Hsieh J., Vol. 7258, Lake Buena Vista, FL, 2009. [Google Scholar]
- Carton A.-K., Bakic P. R., Ullberg C., and Maidment A. D. A., “Development of a 3D high-resolution physical anthropomorphic breast phantom,” SPIE Medical Imaging: Physics of Medical Imaging, edited by Samei E. and Pelc N. J., San Diego, CA, 2010. [Google Scholar]
- Carton A.-K., Bakic P. R., Ullberg C., Derand H., and Maidment A. D. A., “Development of a physical 3D anthropomorphic breast phantom,” Med. Phys. 38(2), 891–896 (2011). 10.1118/1.3533896 [DOI] [PMC free article] [PubMed] [Google Scholar]


