

Summary
To sustain tumor growth, cancer cells must be able to adapt to fluctuations in energy availability. We have identified a single microRNA that controls glioma cell proliferation, migration, and responsiveness to glucose deprivation. Abundant glucose allows relatively high miR-451 expression, promoting cell growth. In low glucose, miR-451 levels decrease, slowing proliferation but enhancing migration and survival. This allows cells to survive metabolic stress and seek out favorable growth conditions. In glioblastoma patients, elevated miR-451 is associated with shorter survival. The effects of miR-451 are mediated by LKB1, which it represses through targeting its binding partner, CAB39 (MO25α). Overexpression of miR-451 sensitized cells to glucose deprivation, suggesting that its downregulation is necessary for robust activation of LKB1 in response to metabolic stress. Thus, miR-451 is a regulator of the LKB1/AMPK pathway, and this may represent a fundamental mechanism that contributes to cellular adaptation in response to altered energy availability.
Introduction
Glioblastoma multiforme (GBM) is the most common and aggressive glial tumor, with ∼10,000 new cases per year in the USA (Hess et al., 2004). Median survival is 14 months, even with the most effective regimen of surgery followed by concomitant radiation and temozolomide chemotherapy (Stupp et al., 2005). GBM is characterized by the hallmarks of cellular heterogeneity, rapid proliferation, angiogenesis, extensive invasion, hypoxia, and necrosis (Giese et al., 2003; Furnari et al., 2007).
To sustain proliferation, many cancer cells alter their metabolism and utilize glycolysis, even in normoxic conditions (the “Warburg Effect”) (Warburg, 1956; Kim and Dang, 2006). This requires sufficient glucose and facilitates rapid cell growth through generating intermediates for the synthesis of essential cellular components (Vander Heiden et al., 2009). Cancer cells ensure an adequate glucose supply through increased angiogenesis and migration. However, in rapidly growing tumors such as GBM, where glucose may fluctuate, cells must engage adaptive strategies to survive periods of metabolic stress (Jones and Thompson, 2009). In normal cells, the 5′-adenosine monophosphate activated protein kinase (AMPK) pathway is the major cellular sensor of energy availability (Hardie, 2007), but its function in cancer is not clear. We have identified a mechanism in which glioma cell survival, motility, and proliferation are coordinately regulated by a single microRNA (miR-451) that regulates AMPK signaling in response to glucose levels in glioma cells through modulating the activity of its upstream activator LKB1.
AMPK is activated by metabolic stress to promote energy conservation and glucose uptake, allowing cells to survive periods of low energy availability. Allosteric interaction with elevated intracellular AMP, which acts to inhibit dephosphorylation of AMPK (Davies et al., 1995; Sanders et al., 2007), and phosphorylation at Thr172 by the protein kinase LKB1 are necessary for AMPK activation under conditions of bioenergetic stress (Hawley et al., 2003; Woods et al., 2003). AMPK phosphorylation by LKB1 leads to 100-fold activation compared with AMP binding alone (Hawley et al., 1995; Stein et al.,2000). LKB1 is active as a heterotrimeric complex with Ste-20-related adaptor (STRAD) and calcium-binding protein 39 (CAB39, also known as MO25α), a scaffold protein that increases the activity of LKB1 ∼10-fold (Hawley et al., 2003; Boudeau et al., 2003; Baas et al., 2004).
AMPK activation leads to an extensive range of cellular alterations, including the blockade of protein synthesis, mediated by reduced mTOR activity. mTOR regulates translation initiation and is a downstream effector of Akt (Inoki et al., 2002; Potter et al., 2002; Easton and Houghton, 2006). mTOR is regulated by the tuberous sclerosis complex (TSC1/2), which acts by integrating opposing upstream inputs from Akt (Inoki et al., 2002) and from AMPK (Inoki et al., 2003). AMPK also inhibits mTOR activation through phosphorylation of Raptor (Gwinn et al., 2008). Mutations in LKB1 and TSC1/2 are associated with inherited cancer syndromes (Hezel and Bardeesy, 2008; Shaw et al., 2004). LKB1/AMPK signaling also regulates cell morphology and polarity (Lee et al., 2007; Williams and Brenman, 2008) and thus may allow the coordination of cellular energy status with other processes, including cell polarization. LKB1 phosphorylates and activates a family of related downstream protein kinases in addition to AMPK (Lizcano et al., 2004). These include microtubule affinity-regulating kinases (MARKs), which play key roles in regulating cell polarity (Williams and Brenman, 2008).
MicroRNAs (miRs) are ∼22 nucleotide single-stranded non-coding RNAs that act as key regulators of gene expression, typically by reducing translation of target mRNAs with partial complementarity in their 3′ untranslated regions (UTRs) (Kloosterman and Plasterk, 2006; Bartel, 2009). miR dysregulation is a general feature of cancer, including GBM, and has been associated with tumor suppressor and oncogenic activities (Esquela-Kerscher and Slack, 2006; Lawler and Chiocca, 2009). Many alterations in miRs have been reported in cancer, but for most of these, their functional significance is not yet known.
We have found that miR-451 controls the balance of cell proliferation and migration in response to metabolic stress in glioma cells. This is due to its ability to regulate LKB1 signaling via direct targeting of CAB39. miR-451 levels are reduced by glucose deprivation, and overexpression of miR-451 sensitizes cells to low glucose, suggesting that its downregulation is required for robust activation of LKB1 and downstream pathways, including AMPK. Thus, miR-451 is a component of the LKB1/AMPK pathway, which may function in glioma to allow cells to survive metabolic stress and seek out favorable growth conditions, facilitating tumor growth.
Results
miR-451 Is Downregulated in Migrating Glioma Cells
To identify miRs involved in glioma migration, we performed a microarray screen using RNA extracted from a 3D glioma spheroid migration assay at day 0 and after extensive migration (day 3) (Figure 1A). Alterations previously associated with cell migration were observed, including upregulation of miR-21 (Gabriely et al., 2008) and downregulation of miR-126 (Crawford et al., 2008). The largest change was the downregulation of miR-451 in migrating cells (Figure 1B). miR-451 downregulation was validated by qRT-PCR using RNA from three GBM cell lines at days 0 and 3 of migration in the spheroid assay (Figure 1C). This showed a reduction in miR-451 levels of at least 10-fold at day 3. miR-451 was undetectable at day 6 (data not shown). miR-451 downregulation was blocked by LiCl (Figure 1C), a potent inhibitor of glioma cell migration in the spheroid assay (Nowicki et al., 2008). Thus, miR-451 is downregulated in glioma spheroid assays in a migration-dependent manner.
Figure 1. miR-451 Is Downregulated in Glioma Cell Migration.

(A) Representative images of RFP-labeled glioma cells in the spheroid assay at day 0 and day 3 are shown. RNA was extracted from multiple spheroid assays for subsequent profiling.
(B) Scatter plot showing miR profiling data for U87 cells at day 0 and day 3 of the spheroid migration assay. The largest alterations are marked in red (upregulated) and green (downregulated). miR precursors are marked with asterisks. miR-451 is labeled in bold.
(C) Downregulation of miR-451 was validated by qRT-PCR in three independent glioma cell lines at day 0 and day 3 of migration in the spheroid assay. X12 cells were incubated with 20 mM LiCl to block migration. Values are expressed as mean relative miR-451 expression level ± SD. *p < 0.01.
miR-451 Reduces Migration but Promotes Glioma Cell Proliferation
We then examined the effects of miR-451 expression on glioma migration. Stable miR-451 expression or transfection of pre-miR-451 oligonucleotides reduced migration by ∼60% in spheroid assays (Figure 2A). This was also observed in scratch and transwell assays (Figure 2B). Reduced migration in the absence of extracellular matrix suggests that miR-451 affects intrinsic mechanisms of cell motility. In support of this, a change in cell morphology was observed in miR-451-expressing X12 glioma cells (Figure 2C), with extensive retraction of the long, slender protrusions that characterize these cells. This supports a role for miR-451 in the regulation of migration through effects on the cytoskeleton.
Figure 2. miR-451 Controls Migration and Proliferation in Glioma Cell Lines.
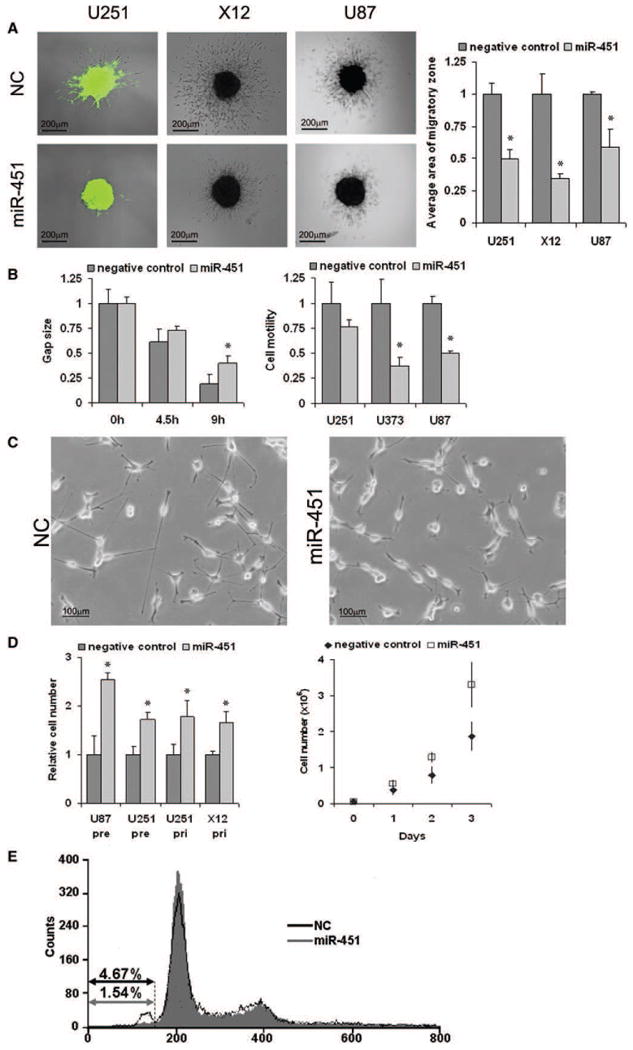
(A) Effect of miR-451 expression on glioma spheroid migration. (Left) Representative images of spheroid migration of control U251 and X12 glioma cells (NC) or transduced with pri-miR-451 vector and U87 cells transfected with negative control miR (NC) or miR-451 precursors. Migratory zones were quantified after 48 hr of migration (right), expressed as mean area of migration ± SD. *p < 0.01.
(B) Effects of miR-451 in additional motility assays. Control U251 glioma cells (NC) or cells transduced with miR-451 vector were subjected to a wound-healing/ scratch assay. Gap size was measured after the time indicated and is shown as a fraction of control (mean relative migration ± SD) (left). Three glioma cell lines were transfected with either negative control miR or miR-451 precursors. U251 and U373 cell lines were used for transwell assays with Matrigel-coated inserts, and U87 cells were used in a noncoated assay (right). Data are expressed as mean migration relative to controls ± SD.
(C) miR-451 expression causes changes in cell morphology. Representative images of X12 glioma cells stably expressing empty vector (NC) and miR-451 are shown.
(D) Effect of miR-451 expression on proliferation. Cell number was quantified after 72 hr of growth (left). Cells were either transiently transfected with negative control miR and miR-451 precursors (pre) or stably transfected with empty vector or miR-451 vector (pri). (Right) A growth curve of U251 cells stably expressing miR-451 compared with controls. Data are expressed as mean ± SD.
(E) Effect of miR-451 expression on apoptosis. Flow cytometry was performed on propidium iodide-stained U251 cells stably expressing miR-451 compared with empty vector controls (NC). The percentage of cells in the sub-G0 fraction is shown.
Further examination of miR-451-transfected glioma cells revealed a consistent increase in cell proliferation, with almost twice as many cells after 72 hr in culture compared with controls (Figure 2D). Flow cytometry revealed a decrease in the sub-G0 fraction in miR-451-expressing U251 cells (Figure 2E). Thus, in addition to inhibiting glioma cell migration, miR-451 expression promotes cell proliferation, at least in part through reducing basal levels of apoptosis.
CAB39 Is a Functionally Relevant miR-451 Target
Interrogation of the Targetscan v4.2 database for potential miR-451 targets revealed a low number of conserved targets (14), each with one predicted miR-451 binding site. The putative target CAB39 was of particular interest due to its known function in LKB1/AMPK regulation. CAB39 mRNA levels increased 4-fold in glioma spheroid migration (Figure 3A), and CAB39 mRNA and protein levels were reduced in miR-451-transfected cells (Figures 3B and 3C), whereas antisense miR-451 resulted in increased CAB39 levels (Figure 3C). The expression of a luciferase/CAB39 3′UTR reporter plasmid was blocked by miR-451 in a dose-dependent manner. This effect was abolished by mutation of the predicted miR-451 binding site (Figure 3D). Thus, miR-451 directly regulates CAB39 expression by binding its predicted 3′UTR target sequence.
Figure 3. Identification and Characterization of CAB39 as a Target of miR-451.

(A) CAB39 mRNA levels increase during the course of a spheroid migration assay. Cells were harvested at day 0 and day 3 of migration and analyzed for CAB39 mRNA levels by qRT-PCR. Relative CAB39 mRNA expression is shown as mean ± SD.
(B) Effect of miR-451 on CAB39 mRNA levels. Cells were either transiently transfected with negative control miR and miR-451 precursors (pre) or stably transfected with empty vector or miR-451-expressing vector (pri). CAB39 mRNA levels were measured by qRT-PCR and expressed as mean ± SD.
(C) Effect of miR-451 alterations on CAB39 protein levels. Glioma cell lines were either transiently transfected with negative control miR (NC) and miR-451 precursors (pre) or stably transfected with empty vector (NC) or miR-451-expressing vector (pri) (left). U251 cells were transiently transfected with negative control miR (NC), miR-451 precursor as a positive control (451), or anti-miR-451 (a451) (right). Cell lysates were blotted with anti-CAB39 antibody, and anti-α-tubulin antibody was used as a loading control.
(D) Direct targeting of CAB39 3′UTR by miR-451. COS7 cells were cotransfected with luciferase/CAB39 3′UTR reporter vector (WT) and either 40 nM or 60 nM negative control miR or miR-451. A reporter vector with a mutated miR-451-binding site in the CAB39 3′UTR (mut) was used as a control. Luciferase levels are expressed as mean relative to controls ± SD; *p < 0.01. Wild-type and mutated miR-451 target sites within the CAB39 3′-UTR are shown below.
(E) Effect of CAB39 downregulation on glioma cell proiferation. LN229 glioma cells were transfected with siRNA against CAB39 or negative control siRNA, and cell number was quantified after 48 hr of growth and expressed as mean relative growth ± SD. Corresponding cell lysates blotted with anti-CAB39 antibody and anti-α-tubulin antibody as a loading control are shown below.
(F) Effect of CAB39 downregulation on glioma cell migration. CAB39 siRNA-transfected glioma cells were analyzed in the spheroid migration assay. Representative images of spheroid migration of LN229 and U87 glioma cells transfected with negative control siRNA (NC) or CAB39 siRNA are shown (left). Migratory zones were quantified after 48 hr and are shown as mean ± SD (right).
We then found that CAB39 siRNA caused an increase in glioma cell proliferation (Figure 3E) and also reduced cell migration in the spheroid assay by ∼50% (Figure 3F). Thus, CAB39 knockdown leads to a similar phenotype of increased proliferation and decreased migration, as seen with miR-451 treatment. This suggests that CAB39 is a functionally relevant miR-451 target in glioma cells.
miR-451 Is Expressed in Patient GBMs and Indicates a Poor Prognosis
qRT-PCR showed that mature miR-451 is expressed in patient GBMs at a higher mean level than in matched normal adjacent brain tissue (Figure 4A), in agreement with previous microarray analysis (Godlewski et al., 2008). However, the overexpression of miR-451 was variable between tumor samples. Three from five paired samples showed significant upregulation (between 2- and 6-fold) of miR-451 compared with adjacent brain devoid of gross tumor.
Figure 4. miR-451 Expression in Patient Tumors and Localization by In Situ Hybridization.

(A) miR-451 levels were measured in paired GBM and nonpathologic adjacent normal tissue by qRT-PCR. Each patient sample pair is marked with a different color, and overall values are expressed as mean ± SD.
(B) Representative ISH staining for miR-451 expression in GBM samples (top) and normal brain (bottom) is shown. The signal is blue, and counterstain is pink.
(C) Expression of miR-451 in areas around blood vessels in tumors. Representative ISH staining is shown. Blood vessel is labeled BV.
(D) Localization of miR-451, CAB39, and proliferative marker Ki67 in brain tumor samples. Representative hematoxylin staining (upper- and lower-left panels), ISH staining for miR-451 (upper- and lower-right panels, blue), and immunostaining for CAB39 (upper-right panel, red) and Ki67 (lower-right panel, red) are shown. Overall staining (left) was converted to fluorescence signal (right) using the Nuance system. Colocalization is visualized in green. Quantification of positive cell numbers in multiple fields for miR-451/CAB39 (top graph) and miR-451/Ki67 (bottom graph) is shown as mean ± SD.
(E) Association of miR-451 expression with patient survival (Kaplan-Meier plot) in GBM. Data were obtained from The Cancer Genome Atlas. p = 0.036. See also Figure S1.
In situ hybridization (ISH) confirmed that miR-451 was readily detectable in patient samples compared with normal brain (Figure 4B). miR-451 showed a striking spatial distribution, with groups of positive cells in linear and concentric patterns evident around a subset of blood vessels (Figure 4C). These miR-451-expressing cells pathologically resemble tumor rather than endothelial cells. A steady decrease in miR-451-positive cells was evident with increasing distance from these blood vessels. As predicted by in vitro data, miR-451 did not colocalize with CAB39 in patient tumor samples, whereas Ki67 showed strong colocalization, demonstrating that miR-451 expression is associated with increased cell proliferation in vivo (Figure 4D).
We then generated Kaplan-Meier curves based on miR-451 levels in patient specimens in The Cancer Genome Atlas database (http://cancergenome.nih.gov). This showed a significant reduction in survival in patients expressing high levels of miR-451 (Figure 4E). Sixteen patients with high miR-451 levels had a median survival of ∼280 days, whereas 23 patients with low miR-451 levels had a median survival of ∼480 days. Thus, miR-451 may promote GBM proliferation in vivo and also is a candidate prognostic indicator.
miR-451 Affects LKB1-Regulated Signal Transduction Pathways
CAB39 functions as a scaffold protein that promotes LKB1 activity through stabilization of the LKB1/STRAD/CAB39 complex. In order to verify the significance of LKB1/AMPK signaling in glioma, we carried out immunoblotting of patient glioma samples. CAB39, LKB1, and AMPK were all readily detectable, suggesting that the pathway is intact in glioma (Figure S1A available online). LKB1 was also expressed in four distinct glioma cell lines but was absent in HeLa cells (Figure S1B), as shown by Lizcano et al. (2004). In order to investigate the effect of miR-451 on LKB1 complex formation in glioma cells, we immunoprecipitated LKB1 and detected coimmunoprecipitated STRAD and CAB39 by western blot. In control cells, CAB39 and STRAD were easily detected in LKB1 immunoprecipitates. After treatment with either miR-451 or CAB39 siRNA, the amounts of CAB39 and STRAD were substantially reduced, indicating disruption of the LKB1 complex (Figure 5A). Furthermore, a 6-fold reduction in activity of LKB1 was detected using in vitro kinase assays of endogenous LKB1 immunoprecipitated from glioma cells (Figure 5B). Further analysis of downstream signaling pathways was performed, using phospho-specific antibodies to detect AMPK Thr172 phosphorylation by LKB1, the AMPK substrates ACC (Ser79), Raptor (Ser792), and TSC2 (Ser1387), as well as p70 ribosomal S6 kinase (Thr389) and ribosomal S6 protein (Ser235/236), as indicators of mTOR activation. This showed that miR-451 expression in U251 glioma cells leads to reduced AMPK Thr172 phosphorylation, reduced AMPK substrate phosphorylation, and upregulation of mTOR activity, as expected due to reduced AMPK activity (Figure 5C). In HeLa cells, which are known to lack LKB1 (Lizcano et al., 2004), AMPKThr172 phosphorylation was not detected, and mTOR activity was not altered by miR-451 treatment, demonstrating that the effects of miR-451 on mTOR activity are dependent on LKB1 (Figure 5D). Similar to miR-451, CAB39 siRNA reduced AMPK phosphorylation and increased mTOR activation (Figure 5D). Taken together, these data show that miR-451 directly targets and downregulates CAB39, resulting in reduced LKB1-dependent phosphorylation of AMPK and increased mTOR activation. Similar results were observed in three additional glioma cell lines (Figure S2A). In contrast, treatment of cells with anti-miR-451 increased CAB39 levels and AMPK phosphorylation, supporting the hypothesis that miR-451 targets this pathway (Figure S2B).
Figure 5. miR-451 Affects Pathways Involved in Proliferation and Migration via LKB1 Signaling.

(A) Effect of miR-451 expression and CAB39 downregulation on LKB1/STRAD/CAB39 complex stability. LKB1 was immunoprecipitated (IP) from U251 cells transfected with negative control oligonucleotides (NC), miR-451 precursor, or siRNA CAB39 and was blotted with anti-CAB39 and anti-STRAD antibodies. Input controls were blotted with anti-CAB39, anti-STRAD, and anti-LKB1 antibodies, and anti-α-tubulin antibody was used as a loading control.
(B) Effect of miR-451 expression on LKB1 activity in a linked peptide phosphorylation assay. Data are shown as mean phosphate incorporation ± SD. U251 cells were transfected with negative control miR (NC) and miR-451 precursor and were subjected to LKB1 IP followed by a kinase assay. Input controls were blotted with anti-CAB39 antibody, and anti-α-tubulin antibody was used as a loading control.
(C) Effect of miR-451 expression on AMPK phosphorylation and downstream pathways, including mTOR. Western blotting was carried out on U251 glioma cells transfected with negative control miR (NC) or miR-451 precursors. Anti-CAB-39, anti-phospho-AMPK, anti-AMPK, anti-phospho-Raptor, anti-Raptor, anti-phos-pho-ACC, anti-ACC, anti-phospho-TSC2, anti-TSC2, anti-phospho-p70S6K, anti-p70S6K, anti-phospho-ribosomal protein S6, and anti-ribosomal protein S6 antibodies were blotted, and anti-α-tubulin antibody was used as a loading control.
(D) Effect of miR-451 expression and CAB39 downregulation on mTOR signaling. U251 glioma cells and HeLa cells deficient in LKB1 were used. Western blotting was performed after transfection with negative control miR or negative control siRNA (NC), miR-451, and siRNA CAB39. Anti-CAB39, anti-phospho-AMPK, anti-AMPK, and anti-phospho-ribosomal protein S6 antibodies were blotted, and anti-α-tubulin antibody was used as a loading control.
(E) Effect of miR-451 expression on LKB1 downstream target protein MARK3 phosphorylation. MARK3 was immunoprecipitated (IP) from U251 cells transfected with negative control miR (NC) or miR-451 precursor and blotted with anti-phospho-MARKs antibody. Input controls were blotted with anti-CAB39 and anti-MARK3 antibodies, and anti-α-tubulin antibody was used as a loading control.
(F) Effect of glucose deprivation on glioma cell migration. U87 spheroid migration was observed in several glucose concentrations. Representative images of spheroid migration in 2.25 g/l glucose versus 0.3 g/l glucose after 6 hr are shown (left). Migratory zones were quantified and expressed as mean area of migration ± SD. *p < 0.01 (right). See also Figure S2.
Immunoblotting showed no effects of miR-451 on levels of LKB1 or CAB39L (MO25β), supporting a role for CAB39 as the principal target of miR-451 (Figure S2C). miR-451 did not affect Akt phosphorylation or the levels of CaMKK2, a calcium-sensitive activator of AMPK (Figure S2C). miR-451 had no effect on calcium ionophore-induced AMPK activation by CaMKK2 in HeLa cells (Figure S3A). Together, these data suggest that the effects of miR-451 on AMPK Thr172 phosphorylation are mediated by LKB1.
To address the effects of miR-451 on pathways involved in cell migration, we examined phosphorylation of MARKs, which are substrates of LKB1 (Lizcano et al., 2004) implicated in the regulation of microtubule dynamics and cortical neuron migration (Sapir et al., 2008). Reduced MARK3-activating phosphorylation was observed after transfection of miR-451 (Figure 5E), indicating that miR-451 can affect cytoskeletal components involved in migration in the brain.
This data suggests a relationship between a major glucose-sensing pathway and glioma migration. In order to further examine the relationship between metabolic responses to glucose deprivation and glioma cell migration, we examined the effect of modulating glucose on glioma migration. A significant increase in migration could be observed in glioma spheroid migration assays in low (0.3 g/l) glucose (Figure 5F). Similar observations were made in transwell and scratch assays (data not shown). These data suggest that LKB1 signaling is involved in glioma migration and provide a molecular explanation for the reciprocal effects of miR-451 on proliferation and migration.
miR-451 Downregulation Is Necessary for Glioma Cell Survival in Response to Glucose Deprivation
We hypothesized that miR-451 may act as a switch that can regulate the balance of migration and proliferation in response to extracellular stimuli. Of interest, we found that glucose withdrawal led to a marked reduction in miR-451 levels. This was not observed in HeLa cells, suggesting that LKB1 plays a role in miR-451 regulation (Figure 6A). We also found that LKB1-independent activation of AMPK using a calcium ionophore did not alter miR-451 levels (Figure S3B). We then found that siRNA knockdown of LKB1 caused an elevation of miR-451 levels, in contrast with AMPK siRNA treatment, which had no significant effects (Figure 6B). The reciprocal relationship between LKB1 activity and miR-451 levels suggests a potential LKB1-dependent feedback loop that may enhance the cellular response to metabolic stress in response to reduced glucose levels.
Figure 6. Glucose and LKB1 Regulate miR-451 Levels, and miR-451 Reduction Is Critical for the Cellular Response to Glucose Withdrawal.

(A) Effect of glucose deprivation on miR-451 expression levels. Cells were cultured for 24 hr in normal (+, glucose 4.5 g/l) or reduced glucose (−, glucose 0.3 g/l) medium. miR-451 levels were then measured by qRT-PCR and expressed as mean relative to normal medium controls ± SD.
(B) Effect of AMPK and LKB1 downregulation on miR-451 expression. U87, U251,and U373 glioma cells were transfected with negative control siRNA, AMPKα1 siRNA, or LKB1 siRNA. miR-451 levels were measured 48 hr after transfection by qRT-PCR and expressed as mean relative to controls ± SD (left). Corresponding western blots with anti-AMPK, anti-LKB1, and anti-α-tubulin antibody as a loading control are shown below (right).
(C) Effect of miR-451 expression on glucose deprivation-dependent AMPK activation. U251 cells were transfected either with negative control miR (NC) or miR-451 precursor and grown in normal (+, glucose 4.5 g/l) or reduced glucose (−, glucose 0.3 g/l) medium for 18 hr. Cell lysates were blotted with anti-CAB39, anti-phospho-AMPK, anti-AMPK, anti-phospho-Raptor, and anti-Raptor antibodies. Anti-α-tubulin antibody was used as a loading control.
(D) Effect of miR-451 expression on cellular response to glucose deprivation. U251 cells were transfected either with negative control miR (NC) or miR-451 precursor and were grown in normal (+, glucose 4.5 g/l) or reduced glucose (−, glucose 0.3 g/l) medium for 24 hr. Cell number was quantified by crystal violet staining and was expressed as mean cell number relative to controls ± SD. *p < 0.01. See also Figure S3.
To determine the importance of miR-451 in the response to metabolic stress in glioma cells, we investigated the effects of glucose deprivation on glioma cells transfected with pre-miR-451 oligonucleotides. AMPKThr172 and Raptor Ser792 phosphorylation in response to low glucose were largely blocked in miR-451-expressing U251 cells (Figure 6C). Low glucose conditions also resulted in higher CAB39 expression in control cells, corresponding with the lower level of miR-451 (Figures 6A and 6C). Low glucose caused a significant drop in cell number in miR-451-transfected cells, whereas control cells were able to survive (Figure 6D). This data shows that miR-451 downregulation plays a critical role in cellular responses to glucose withdrawal by allowing proper activation of LKB1 and its downstream substrates, including AMPK. Based on these observations, we propose that miR-451 regulation of LKB1 plays a key role in the response of glioma cells to glucose deprivation by regulating the balance of glioma cell proliferation, migration, and survival in response to metabolic alterations.
Discussion
The ability of cancer cells to resist adverse conditions such as hypoxia and metabolic stress is necessary for sustained tumor growth and strongly influences tumor behaviors, including proliferation, survival, angiogenesis, and migratory capacity. In this study, we identified miR-451 as a glioma-expressed miR that regulates the balance of proliferation and migration in glioma cells in response to changes in glucose levels. miR-451 regulates LKB1 activity through direct targeting of CAB39, a component of the active LKB1 complex. Glucose deprivation caused a reduction in miR-451 levels. Also, disruption of LKB1 signaling by constitutive miR-451 expression alters the activity of pathways downstream of LKB1, including reduced AMPK phosphorylation, and leads to impaired cell survival in response to glucose withdrawal. Thus, miR-451 plays an essential role in LKB1/AMPK signaling in glioma cells. When glucose is sufficient, elevated miR-451 levels lead to reduced LKB1/AMPK pathway activation. This facilitates cell proliferation by allowing unrestrained mTOR activity and reducing apoptosis. In contrast, when glucose is limiting, miR-451 levels decline, allowing increased CAB39 expression and activation of AMPK by LKB1-mediated phosphorylation. This promotes cell survival in response to metabolic stress and activates pathways involved in glioma motility. These findings are outlined by the model shown in Figure 7.
Figure 7. Proposed Role of miR-451 in the Regulation of LKB1 Signaling in Response to Glucose.
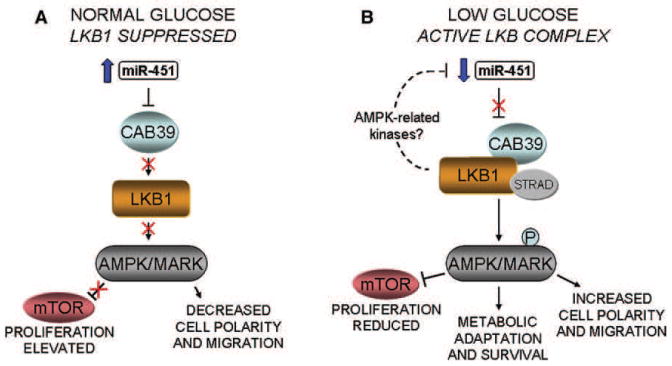
(A) Under normal glucose conditions, higher levels of miR-451 suppress the expression of CAB39 through directly targeting its 3′UTR. This leads to repression of LKB1 activity and, consequently, reduced activity of substrates, including AMPK and MARKs. The reduced levels of AMPK allow unrestrained mTOR activation, promoting cell proliferation.
(B) Under conditions of reduced glucose, declining miR-451 levels result in increased expression of CAB39 and stabilization of the active LKB1 signaling complex. This results in the phosphorylation and activation of LKB1 substrates, including AMPK and MARKs, leading to: (1) reduced cell proliferation through reduced mTOR activity; (2) initiation of responses to metabolic stress, leading to adaptation and cell survival; (3) increased cell polarity and activation of migration pathways through phosphorylation of MARKs and effects on the cytoskeleton. The dashed line illustrates a potential feedback loop between LKB1 and miR-451, which may be mediated via additional AMPK-related kinase substrates of LKB1 and which allow a sustained and robust response to glucose deprivation.
It is not yet clear how glucose acts to reduce miR-451 levels. Our data point toward a potential feedback loop involving repression of miR-451 in response to increased LKB1 activity. Such feedback loops have been increasingly described for miRs and their targets (Visvanathan et al., 2007; Wang et al., 2008; Xu et al., 2009). In the case of miR-451 and LKB1 signaling, miR-451 may act to lock the pathway in the “off” position until repressed by low glucose, when the absence of the miR leads to the pathway being constitutively “on.” This suggests that the function of the potential LKB1/miR-451 loop is to provide a robust response to glucose deprivation and also to act as a safeguard against aberrant pathway activation in response to minor fluctuations in cellular energy status. Thus, in glioma cells, the miR-451/LKB1 pathway may facilitate the rapid and robust adaptation to changing microenvironmental conditions. Tumor cells must be highly adaptive in response to this challenging and dynamic microenvironment, in which cells face hypoxia, acidity, and limited nutrient availability as the tumor grows. Thus, molecular mediators that govern the response of cancer cells to their microenvironment play a vital role in disease outcome. Our data suggest that miR-451 may potentially play such a role in glioblastoma. Importantly, observations made in patient GBM samples are consistent with in vitro observations. For example, the proliferative effects of miR-451 may also explain the poorer prognosis observed in patients with elevated miR-451 expression. Related to this, recent studies have demonstrated that elevated glucose in glioblastoma patients is related to shorter survival (McGirt et al., 2008; Derr et al., 2009).
The effects of miR-451 on LKB1 activity are likely to be mediated directly by CAB39. The expression of other pathway components examined were unaltered by miR-451 treatment. It would seem that, in the glioma cells used in this study, LKB1 activity is sensitive to comparatively modest alterations in the levels of CAB39 expression. The partial CAB39 knockdown caused by miR-451 treatment led to marked destabilization of the LKB1/STRAD/CAB39 complex in coimmunoprecipitation studies and reduced kinase activity ∼6-fold. This may allow miR-451 to have a pronounced effect on LKB1 signaling in glioma cells.
LKB1/AMPK signaling may act as a tumor suppressor by opposing the effects of Akt. Thus, when glucose is sufficient, miR-451 acts as an oncogene by suppressing LKB1/AMPK signaling. Mutations in LKB1 and TSC1/2 are associated with the inherited cancer disorders, Peutz-Jegher's syndrome (Giardiello et al., 1987; Lizcano et al., 2004; Hezel and Bardeesy, 2008) and tuberous sclerosis (Inoki et al., 2003), respectively. Importantly, LKB1, CAB39, and AMPK components are all expressed in GBM according to our observations and microarray databases, and no mutations have been identified in GBM. This allows the pathway to be used for regulation of metabolic stress after downregulation of miR-451.
The role of LKB1/AMPK pathway activation in migration is less well studied. The importance of LKB1 in cell polarity is well known, and recent studies have implicated cell polarity proteins in the cellular reorganization necessary for cancer cell migration (Etienne-Manneville, 2008). In the brain, LKB1 is required for centrosome orientation in migrating neurons (Asada et al., 2007), and AMPK plays a role in astrocyte morphology (Favero and Mandell, 2007). MARK protein kinases, which are involved in microtubule stability and share homology with AMPK, are also activated by LKB1 (Lizcano et al., 2004). MARK family kinases are essential for the migration of cortical neurons (Sapir et al., 2008). MARK3 phosphorylation decreased in miR-451-expressing cells, indicating that this pathway operates in glioma cells. The activation of cytoskeletal proteins by LKB1 provides the means by which tumor cells under conditions of metabolic stress may be able to polarize and migrate to another region with a better glucose supply. LKB1 plays a role in the activation of numerous AMPK-related kinases in addition to AMPK and MARK family kinases (Lizcano et al., 2004). The role of these in glioma is unknown, and their contribution to the effects reported here, including migration and the potential LKB1/miR-451 feedback loop, will be the subject of future studies.
AMPK has been reported to act upstream of myosin light chain 2 (MLC2) (Lee et al., 2007), which is known to be required for glioma cell movement in the brain (Beadle et al., 2008). Although MLC2 is not a direct substrate of AMPK (Bultot et al., 2009), it may also play a downstream role in the effects of miR-451 on glioma migration. Importantly, we were able to show that low glucose levels lead to a transient increase in glioma cell migration. Tumor cells may encounter low glucose conditions regularly in the highly proliferative and hypoxic microenvironments typical of GBM and other aggressive tumor types.
A recent report showed that miR-451 levels were reduced in CD133+ glioma cells (Gal et al., 2008). CD133 is a putative marker of glioma stem cells (Singh et al., 2004); however, this is not yet fully understood, and another recent report showed that CD133 is a marker of bioenergetic stress in glioma cells (Griguer et al., 2008). Thus, the downregulation of miR-451 in CD133+ cells reported by Gal et al. (2008) may be a result of the effects of bioenergetic stress. Of interest, decreased miR-451 levels were observed in gastric and colorectal tumor samples compared to normal tissues, and downregulation of miR-451 correlates with poor prognosis in this cancer type. In these cells, miR-451 was shown to target macrophage migration inhibitory factor (MIF) (Bandres et al., 2009). MIF is a known activator of AMPK signaling (Miller et al., 2008), thus supporting the idea that a major function of miR-451 may be to suppress AMPK. This observation emphasizes that this is a complex pathway that may operate in different ways depending on the tumor type.
Our observations thus identify a miR that regulates LKB1/ AMPK signaling. This may explain how a cellular response designed to resist metabolic stress functions in the decision of cancer cells to migrate or proliferate and adapt to their surroundings in response to fluctuations in glucose availability. Further studies may highlight the functions of miR-451 in the context of the in vivo tumor microenvironment, the contribution of additional miR-451 targets, and the identification of elements of the transcriptional machinery that take part in this process.
Experimental Procedures
Cell Culture
U87MG, U251MG, U373MG, LN229, HeLa, and COS-7 cells were from ATCC and cultured in DMEM containing 10% FCS. X12 and X14 human GBM cells were obtained from Dr. C. David James (Mayo Clinic, Rochester, MN).
Antibodies and Reagents
Anti-CAB-39, AMPK (phospho-Thr172), total AMPK, phospho-MARKs, Raptor (phospho-Ser792), total Raptor, total ACC, total TSC2, p70S6K (phospho-Thr389), rpS6 (phospho-Ser235/236), total rpS6, AKT (phospho-Ser473), and total AKT (Cell Signaling Technology, Waltham, MA); α-Tubulin, CAB39L, and CAMKK2 (Sigma-Aldrich, St. Louis, MO); ACC (phospho-Ser79), C-TAK1 (MARK3), and p70S6K (Upstate/Millipore, Billerica, MA); STRAD and LKB1 (Santa Cruz Biotechnology, Santa Cruz, CA); TSC2 (phospho-Ser1387) (gift from Dr D.G. Hardie, University of Dundee, UK); Ki67 (Abcam, Cambridge, MA); HRP-conjugated secondary antibodies (GE Healthcare, Piscataway, NJ). A23187 ionophore was purchased from Sigma-Aldrich.
Microarray
Human miRs were profiled using the OSU custom chip as described (Godlewski et al., 2008). RNA was prepared from spheroids in type I collagen (Nowicki et al., 2008). Collagen was removed by treatment with 0.1 mg/ml collagenase III (Sigma-Aldrich) for 30 min at 37°C. Cells were collected by centrifugation, and RNA was isolated using Trizol (Invitrogen, Carlsbad, CA).
Vector Construction
A DNA fragment containing the hsa-miR-451 locus situated at chromosome 17 (17q11.2) plus 370 bp upstream and downstream from the 72 bp miR-451 precursor was amplified from U87 cell genomic DNA and cloned into pCDH-cGFP (System Biosciences, Mountain View, CA). Oligonucleotides identical with a fragment of the Cab-39 gene 3′ untranslated region sequence encompassing the target sequence for miR-451 were annealed and cloned into pMIR-REPORT (Ambion, Austin, TX). For the mutated construct, the miR-451 target site aacggtt was substituted with a ccattgg fragment.
Real-Time PCR
miR-451 expression analysis was carried out using the miR real-time PCR detection kit (Applied Biosystems, Foster City, CA) and the Applied Biosystems 7500 Real-Time PCR System, with human 18S rRNA as an endogenous control. cDNAs for RT-PCR were synthesized using iScript (BioRad, Hercules, CA). mRNA expression analysis was carried out using Power SYBR Green (Applied Biosystems) with human Cab-39 and 18S rRNA primers.
Transfection of Cell Lines
Transfection of pre-miRs and anti-miR-451 oligos (25–75 nM; Ambion, Austin, TX), siRNAs (QIAGEN, Valencia, CA), and plasmids were done with Lipofectamine 2000 (Invitrogen). The pCDH-miR-451 plasmid was used for establishing U251MG and X12 cell lines constitutively expressing miR-451, according to manufacturer's instructions. Stable cell lines were sorted by green fluorescence.
Cell Growth Assays
Equal numbers of cells were plated in triplicate in 24-well culture plates and stained with crystal violet. Propidium iodide exclusion and flow cytometry-based cell-cycle analysis was carried out using the Becton Dickinson FACSCalibur system.
Luciferase Reporter Assays
For luciferase assays, the wild-type or mutated Cab-39 3′UTR reporter plasmid pGL3 was cotransfected with negative control miR or pre-miR-451 into COS-7 cells. Targeting efficiency was determined by measuring luciferase levels in a Fluostar Optima plate reader (BMG Labtech) in triplicate.
Cell Migration Assays
Spheroids, transwell, and scratch/wound healing assays were carried out as described previously (Nowicki et al., 2008).
Immunoprecipitation and Kinase Assay
Immunoprecipitation was performed as previously described (Bronisz et al., 2006). LKB1/AMPK activity-linked peptide assay was performed as previously described (Lizcano et al., 2004). Bacterial-expressed AMPK heterotrimer, LKB1 antibody, and the AMPK peptide substrate (AMARA) were kind gifts from Dr S.A. Hawley (University of Dundee, UK).
In Situ Hybridization
The combined detection of miR-451, Cab-39, and Ki67 by ISH was performed as previously described (Godlewski et al., 2008). Tumor samples were obtained as approved by the Ohio State University IRB. LNA-modified, 5′ end digoxygenin-conjugated probes were obtained from Exiqon (Denmark). Staining signals were converted to fluorescence and quantified using the Nuance EX multispectral imaging system (CRi, Woburn, MA).
Statistical Analysis
Samples were analyzed pairwise by Student's t test. Statistically significant differences (p < 0.01) are marked with asterisks.
Supplementary Material
Acknowledgments
Grant support was received from Esther L. Dardinger Endowment for Neuro-oncology and Neurosciences, American Brain Tumor Association (M.O.N.), and The Jeffrey Thomas Hayden Foundation Postdoctoral Fellowship (J.G.).
Footnotes
Accession Numbers: Microarray data were deposited in the ArrayExpress database according to MIAME recommendations (accession number E-MEXP-2567).
Supplemental Information: Supplemental Information includes three figures and can be found with this article online at doi:10.1016/j.molcel.2010.02.018.
References
- Asada N, Sanada K, Fukada Y. LKB1 regulates neuronal migration and neuronal differentiation in the developing neocortex through centrosomal positioning. J Neurosci. 2007;27:11769–11775. doi: 10.1523/JNEUROSCI.1938-07.2007. [DOI] [PMC free article] [PubMed] [Google Scholar]
- Baas AF, Kuipers J, van der Wel NN, Batlle E, Koerten HK, Peters PJ, Clevers HC. Complete polarization of single intestinal epithelial cells upon activation of LKB1 by STRAD. Cell. 2004;116:457–466. doi: 10.1016/s0092-8674(04)00114-x. [DOI] [PubMed] [Google Scholar]
- Bandres E, Bitarte N, Arias F, Agorreta J, Fortes P, Agirre X, Zarate R, Diaz-Gonzalez JA, Ramirez N, Sola JJ, et al. microRNA-451 regulates macrophage migration inhibitory factor production and proliferation of gastrointestinal cancer cells. Clin Cancer Res. 2009;15:2281–2290. doi: 10.1158/1078-0432.CCR-08-1818. [DOI] [PubMed] [Google Scholar]
- Bartel DP. MicroRNAs: target recognition and regulatory functions. Cell. 2009;136:215–233. doi: 10.1016/j.cell.2009.01.002. [DOI] [PMC free article] [PubMed] [Google Scholar]
- Beadle C, Assanah MC, Monzo P, Vallee R, Rosenfeld SS, Canoll P. The role of myosin II in glioma invasion of the brain. Mol Biol Cell. 2008;19:3357–3368. doi: 10.1091/mbc.E08-03-0319. [DOI] [PMC free article] [PubMed] [Google Scholar]
- Boudeau J, Baas AF, Deak M, Morrice NA, Kieloch A, Schutkowski M, Prescott AR, Clevers HC, Alessi DR. MO25alpha/beta interact with STRADalpha/beta enhancing their ability to bind, activate and localize LKB1 in the cytoplasm. EMBO J. 2003;22:5102–5114. doi: 10.1093/emboj/cdg490. [DOI] [PMC free article] [PubMed] [Google Scholar]
- Bronisz A, Sharma SM, Hu R, Godlewski J, Tzivion G, Mansky KC, Ostrowski MC. Microphthalmia-associated transcription factor interactions with 14-3-3 modulate differentiation of committed myeloid precursors. Mol Biol Cell. 2006;17:3897–3906. doi: 10.1091/mbc.E06-05-0470. [DOI] [PMC free article] [PubMed] [Google Scholar]
- Bultot L, Horman S, Neumann D, Walsh MP, Hue L, Rider MH. Myosin light chains are not a physiological substrate of AMPK in the control of cell structure changes. FEBS Lett. 2009;583:25–28. doi: 10.1016/j.febslet.2008.11.022. [DOI] [PubMed] [Google Scholar]
- Crawford M, Brawner E, Batte K, Yu L, Hunter MG, Otterson GA, Nuovo G, Marsh CB, Nana-Sinkam SP. MicroRNA-126 inhibits invasion in non-small cell lung carcinoma cell lines. Biochem Biophys Res Commun. 2008;373:607–612. doi: 10.1016/j.bbrc.2008.06.090. [DOI] [PubMed] [Google Scholar]
- Davies SP, Helps NR, Cohen PT, Hardie DG. 5′-AMP inhibits dephosphorylation, as well as promoting phosphorylation, of the AMP-activated protein kinase. Studies using bacterially expressed human protein phosphatase-2C alpha and native bovine protein phosphatase-2AC. FEBS Lett. 1995;377:421–425. doi: 10.1016/0014-5793(95)01368-7. [DOI] [PubMed] [Google Scholar]
- Derr RL, Ye X, Islas MU, Desideri S, Saudek CD, Grossman SA. Association between hyperglycemia and survival in patients with newly diagnosed glioblastoma. J Clin Oncol. 2009;27:1082–1086. doi: 10.1200/JCO.2008.19.1098. [DOI] [PMC free article] [PubMed] [Google Scholar]
- Easton JB, Houghton PJ. mTOR and cancer therapy. Oncogene. 2006;25:6436–6446. doi: 10.1038/sj.onc.1209886. [DOI] [PubMed] [Google Scholar]
- Esquela-Kerscher A, Slack FJ. Oncomirs - microRNAs with a role in cancer. Nat Rev Cancer. 2006;6:259–269. doi: 10.1038/nrc1840. [DOI] [PubMed] [Google Scholar]
- Etienne-Manneville S. Polarity proteins in migration and invasion. Oncogene. 2008;27:6970–6980. doi: 10.1038/onc.2008.347. [DOI] [PubMed] [Google Scholar]
- Favero CB, Mandell JW. A pharmacological activator of AMP-activated protein kinase (AMPK) induces astrocyte stellation. Brain Res. 2007;1168:1–10. doi: 10.1016/j.brainres.2007.06.087. [DOI] [PMC free article] [PubMed] [Google Scholar]
- Furnari FB, Fenton T, Bachoo RM, Mukasa A, Stommel JM, Stegh A, Hahn WC, Ligon KL, Louis DN, Brennan C, et al. Malignant astrocytic glioma: genetics, biology, and paths to treatment. Genes Dev. 2007;21:2683–2710. doi: 10.1101/gad.1596707. [DOI] [PubMed] [Google Scholar]
- Gabriely G, Wurdinger T, Kesari S, Esau CC, Burchard J, Linsley PS, Krichevsky AM. MicroRNA 21 promotes glioma invasion by targeting matrix metalloproteinase regulators. Mol Cell Biol. 2008;28:5369–5380. doi: 10.1128/MCB.00479-08. [DOI] [PMC free article] [PubMed] [Google Scholar]
- Gal H, Pandi G, Kanner AA, Ram Z, Lithwick-Yanai G, Amariglio N, Rechavi G, Givol D. MIR-451 and Imatinib mesylate inhibit tumor growth of Glioblastoma stem cells. Biochem Biophys Res Commun. 2008;376:86–90. doi: 10.1016/j.bbrc.2008.08.107. [DOI] [PubMed] [Google Scholar]
- Giardiello FM, Welsh SB, Hamilton SR, Offerhaus GJ, Gittelsohn AM, Booker SV, Krush AJ, Yardley JH, Luk GD. Increased risk of cancer in the Peutz-Jeghers syndrome. N Engl J Med. 1987;316:1511–1514. doi: 10.1056/NEJM198706113162404. [DOI] [PubMed] [Google Scholar]
- Giese A, Bjerkvig R, Berens ME, Westphal M. Cost of migration: invasion of malignant gliomas and implications for treatment. J Clin Oncol. 2003;21:1624–1636. doi: 10.1200/JCO.2003.05.063. [DOI] [PubMed] [Google Scholar]
- Godlewski J, Nowicki MO, Bronisz A, Williams S, Otsuki A, Nuovo G, Raychaudhury A, Newton HB, Chiocca EA, Lawler S. Targeting of the Bmi-1 oncogene/stem cell renewal factor by microRNA-128 inhibits glioma proliferation and self-renewal. Cancer Res. 2008;68:9125–9130. doi: 10.1158/0008-5472.CAN-08-2629. [DOI] [PubMed] [Google Scholar]
- Griguer CE, Oliva CR, Gobin E, Marcorelles P, Benos DJ, Lancaster JR, Jr, Gillespie GY. CD133 is a marker of bioenergetic stress in human glioma. PLoS ONE. 2008;3:e3655. doi: 10.1371/journal.pone.0003655. [DOI] [PMC free article] [PubMed] [Google Scholar]
- Gwinn DM, Shackelford DB, Egan DF, Mihaylova MM, Mery A, Vasquez DS, Turk BE, Shaw RJ. AMPK phosphorylation of raptor mediates a metabolic checkpoint. Mol Cell. 2008;30:214–226. doi: 10.1016/j.molcel.2008.03.003. [DOI] [PMC free article] [PubMed] [Google Scholar]
- Hardie DG. AMP-activated/SNF1 protein kinases: conserved guardians of cellular energy. Nat Rev Mol Cell Biol. 2007;8:774–785. doi: 10.1038/nrm2249. [DOI] [PubMed] [Google Scholar]
- Hawley SA, Selbert MA, Goldstein EG, Edelman AM, Carling D, Hardie DG. 5′-AMP activates the AMP-activated protein kinase cascade, and Ca2+/calmodulin activates the calmodulin-dependent protein kinase I cascade, via three independent mechanisms. J Biol Chem. 1995;270:27186–27191. doi: 10.1074/jbc.270.45.27186. [DOI] [PubMed] [Google Scholar]
- Hawley SA, Boudeau J, Reid JL, Mustard KJ, Udd L, Mäkelä TP, Alessi DR, Hardie DG. Complexes between the LKB1 tumor suppressor, STRAD alpha/beta and MO25 alpha/beta are upstream kinases in the AMP-activated protein kinase cascade. J Biol. 2003;2:28. doi: 10.1186/1475-4924-2-28. [DOI] [PMC free article] [PubMed] [Google Scholar]
- Hess KR, Broglio KR, Bondy ML. Adult glioma incidence trends in the United States, 1977-2000. Cancer. 2004;101:2293–2299. doi: 10.1002/cncr.20621. [DOI] [PubMed] [Google Scholar]
- Hezel AF, Bardeesy N. LKB1; linking cell structure and tumor suppression. Oncogene. 2008;27:6908–6919. doi: 10.1038/onc.2008.342. [DOI] [PubMed] [Google Scholar]
- Inoki K, Li Y, Zhu T, Wu J, Guan KL. TSC2 is phosphorylated and inhibited by Akt and suppresses mTOR signalling. Nat Cell Biol. 2002;4:648–657. doi: 10.1038/ncb839. [DOI] [PubMed] [Google Scholar]
- Inoki K, Li Y, Xu T, Guan KL. Rheb GTPase is a direct target of TSC2 GAP activity and regulates mTOR signaling. Genes Dev. 2003;17:1829–1834. doi: 10.1101/gad.1110003. [DOI] [PMC free article] [PubMed] [Google Scholar]
- Jones RG, Thompson CB. Tumor suppressors and cell metabolism: a recipe for cancer growth. Genes Dev. 2009;23:537–548. doi: 10.1101/gad.1756509. [DOI] [PMC free article] [PubMed] [Google Scholar]
- Kim JW, Dang CV. Cancer's molecular sweet tooth and the Warburg effect. Cancer Res. 2006;66:8927–8930. doi: 10.1158/0008-5472.CAN-06-1501. [DOI] [PubMed] [Google Scholar]
- Kloosterman WP, Plasterk RH. The diverse functions of micro-RNAs in animal development and disease. Dev Cell. 2006;11:441–450. doi: 10.1016/j.devcel.2006.09.009. [DOI] [PubMed] [Google Scholar]
- Lawler S, Chiocca EA. Emerging functions of microRNAs in glioblastoma. J Neurooncol. 2009;92:297–306. doi: 10.1007/s11060-009-9843-2. [DOI] [PubMed] [Google Scholar]
- Lee JH, Koh H, Kim M, Kim Y, Lee SY, Karess RE, Lee SH, Shong M, Kim JM, Kim J, Chung J. Energy-dependent regulation of cell structure by AMP-activated protein kinase. Nature. 2007;447:1017–1020. doi: 10.1038/nature05828. [DOI] [PubMed] [Google Scholar]
- Lizcano JM, Göransson O, Toth R, Deak M, Morrice NA, Boudeau J, Hawley SA, Udd L, Mäkelä TP, Hardie DG, Alessi DR. LKB1 is a master kinase that activates 13 kinases of the AMPK subfamily, including MARK/PAR-1. EMBO J. 2004;23:833–843. doi: 10.1038/sj.emboj.7600110. [DOI] [PMC free article] [PubMed] [Google Scholar]
- McGirt MJ, Chaichana KL, Gathinji M, Attenello F, Than K, Ruiz AJ, Olivi A, Quiñones-Hinojosa A. Persistent outpatient hyperglycemia is independently associated with decreased survival after primary resection of malignant brain astrocytomas. Neurosurgery. 2008;63:286–291. doi: 10.1227/01.NEU.0000315282.61035.48. discussion 291. [DOI] [PubMed] [Google Scholar]
- Miller EJ, Li J, Leng L, McDonald C, Atsumi T, Bucala R, Young LH. Macrophage migration inhibitory factor stimulates AMP-activated protein kinase in the ischaemic heart. Nature. 2008;451:578–582. doi: 10.1038/nature06504. [DOI] [PubMed] [Google Scholar]
- Nowicki MO, Dmitrieva N, Stein AM, Cutter JL, Godlewski J, Saeki Y, Nita M, Berens ME, Sander LM, Newton HB, et al. Lithium inhibits invasion of glioma cells; possible involvement of glycogen synthase kinase-3. Neuro-oncol. 2008;10:690–699. doi: 10.1215/15228517-2008-041. [DOI] [PMC free article] [PubMed] [Google Scholar]
- Potter CJ, Pedraza LG, Xu T. Akt regulates growth by directly phosphorylating Tsc2. Nat Cell Biol. 2002;4:658–665. doi: 10.1038/ncb840. [DOI] [PubMed] [Google Scholar]
- Sanders MJ, Ali ZS, Hegarty BD, Heath R, Snowden MA, Carling D. Defining the mechanism of activation of AMP-activated protein kinase by the small molecule A-769662, a member of the thienopyridone family. J Biol Chem. 2007;282:32539–32548. doi: 10.1074/jbc.M706543200. [DOI] [PubMed] [Google Scholar]
- Sapir T, Sapoznik S, Levy T, Finkelshtein D, Shmueli A, Timm T, Mandelkow EM, Reiner O. Accurate balance of the polarity kinase MARK2/Par-1 is required for proper cortical neuronal migration. J Neurosci. 2008;28:5710–5720. doi: 10.1523/JNEUROSCI.0911-08.2008. [DOI] [PMC free article] [PubMed] [Google Scholar]
- Shaw RJ, Bardeesy N, Manning BD, Lopez L, Kosmatka M, DePinho RA, Cantley LC. The LKB1 tumor suppressor negatively regulates mTOR signaling. Cancer Cell. 2004;6:91–99. doi: 10.1016/j.ccr.2004.06.007. [DOI] [PubMed] [Google Scholar]
- Singh SK, Hawkins C, Clarke ID, Squire JA, Bayani J, Hide T, Henkelman RM, Cusimano MD, Dirks PB. Identification of human brain tumour initiating cells. Nature. 2004;432:396–401. doi: 10.1038/nature03128. [DOI] [PubMed] [Google Scholar]
- Stein SC, Woods A, Jones NA, Davison MD, Carling D. The regulation of AMP-activated protein kinase by phosphorylation. Biochem J. 2000;345:437–443. [PMC free article] [PubMed] [Google Scholar]
- Stupp R, Mason WP, van den Bent MJ, Weller M, Fisher B, Taphoorn MJ, Belanger K, Brandes AA, Marosi C, Bogdahn U, et al. European Organisation for Research and Treatment of Cancer Brain Tumor and Radiotherapy GroupsNational Cancer Institute of Canada Clinical Trials Group. Radiotherapy plus concomitant and adjuvant temozolomide for glioblastoma. N Engl J Med. 2005;352:987–996. doi: 10.1056/NEJMoa043330. [DOI] [PubMed] [Google Scholar]
- Vander Heiden MG, Cantley LC, Thompson CB. Understanding the Warburg effect: the metabolic requirements of cell proliferation. Science. 2009;324:1029–1033. doi: 10.1126/science.1160809. [DOI] [PMC free article] [PubMed] [Google Scholar]
- Visvanathan J, Lee S, Lee B, Lee JW, Lee SK. The micro-RNA miR-124 antagonizes the anti-neural REST/SCP1 pathway during embryonic CNS development. Genes Dev. 2007;21:744–749. doi: 10.1101/gad.1519107. [DOI] [PMC free article] [PubMed] [Google Scholar]
- Wang H, Garzon R, Sun H, Ladner KJ, Singh R, Dahlman J, Cheng A, Hall BM, Qualman SJ, Chandler DS, et al. NF-kappaB-YY1-miR-29 regulatory circuitry in skeletal myogenesis and rhabdomyosarcoma. Cancer Cell. 2008;14:369–381. doi: 10.1016/j.ccr.2008.10.006. [DOI] [PMC free article] [PubMed] [Google Scholar]
- Warburg O. On the origin of cancer cells. Science. 1956;123:309–314. doi: 10.1126/science.123.3191.309. [DOI] [PubMed] [Google Scholar]
- Williams T, Brenman JE. LKB1 and AMPK in cell polarity and division. Trends Cell Biol. 2008;18:193–198. doi: 10.1016/j.tcb.2008.01.008. [DOI] [PubMed] [Google Scholar]
- Woods A, Johnstone SR, Dickerson K, Leiper FC, Fryer LG, Neumann D, Schlattner U, Wallimann T, Carlson M, Carling D. LKB1 is the upstream kinase in the AMP-activated protein kinase cascade. Curr Biol. 2003;13:2004–2008. doi: 10.1016/j.cub.2003.10.031. [DOI] [PubMed] [Google Scholar]
- Xu N, Papagiannakopoulos T, Pan G, Thomson JA, Kosik KS. MicroRNA-145 regulates OCT4, SOX2, and KLF4 and represses pluripotency in human embryonic stem cells. Cell. 2009;137:647–658. doi: 10.1016/j.cell.2009.02.038. [DOI] [PubMed] [Google Scholar]
Associated Data
This section collects any data citations, data availability statements, or supplementary materials included in this article.