

Abstract
We present a theoretical model for steady-state radial and longitudinal oxygen transport in arterioles containing flowing blood (plasma and red blood cells) and surrounded by living tissue. This model combines a detailed description of convective and diffusive oxygen transport inside the arteriole with a novel boundary condition at the arteriolar lumen surface, and the results provide new mass transfer coefficients for computing arteriolar O2 losses based on far-field tissue O2 tension and in the presence of spatially distributed capillaries. A numerical procedure is introduced for calculating O2 diffusion from an arteriole to a continuous capillary-tissue matrix immediately adjacent to the arteriole. The tissue O2 consumption rate is assumed to be constant and capillaries act as either O2 sources or sinks depending on the local O2 environment. Using the model, O2 saturation (SO2) and tension (PO2) are determined for the intraluminal region of the arteriole, as well as for the extraluminal region in the neighbouring tissue. Our model gives results that are consistent with available experimental data and previous intraluminal transport models, including appreciable radial decreases in intraluminal PO2 for all vessel diameters considered (12–100µm) and slower longitudinal decreases in PO2 for larger vessels than for smaller ones, and predicts substantially less diffusion of O2 from arteriolar blood than do models with PO2 specified at the edge of the lumen. The dependence of the new mass transfer coefficients on vessel diameter, SO2 and far-field PO2 is calculated allowing their application to a wide range of physiological situations. This novel arteriolar O2 transport model will be a vital component of future integrated models of microvascular regulation of O2 supply to capillary beds and the tissue regions they support.
Keywords: microvascular oxygen transport, intraluminal resistance, precapillary oxygen loss, theoretical model, longitudinal gradient, periarteriolar oxygen tension, mass transfer coefficient
1. INTRODUCTION
Longitudinal PO2 gradients have been reported for arterioles by Duling and Berne [1], and it has been suggested that precapillary oxygen losses in the microcirculation might play an important role in the local regulation of blood flow by affecting the inlet capillary PO2 thus altering capillary-tissue O2 exchange. It has been observed that oxygen levels in the blood can diminish by up to two-thirds along the arteriolar tree before entering the capillary bed. Although it is not fully understood why this happens, Ellsworth and Pittman [2] have provided evidence that some of the O2 leaving the arterioles diffuses to erythrocytes flowing through nearby capillaries resulting in an increase in their O2 saturation. There have been very few experiments to measure PO2 longitudinal changes along arterioles themselves and PO2 radial changes in and around arterioles. New state-of-the-art PO2 measurements have been made in the hamster cheek pouch microcirculation using an automated system based on phosphorescence quenching (Bertuglia et al. [3]). A 7% drop in hemoglobin O2 saturation (SO2) was measured along an arteriole of 500 microns as well as significant PO2 drops across the vessel wall and into 100 µm of tissue. Such oxygen losses in arterioles have also been shown experimentally by Carvalho and Pittman [4]. Although it is clear that arterioles are losing substantial amounts of oxygen by diffusion, obtaining details of radial oxygen variations inside arterioles remains a challenge despite these recent experimental advances.
The present work is motivated by a desire to understand the role played by arterioles in both delivering O2 and controlling the O2 supply distribution. As noted above, arterioles can deliver O2 to tissue by diffusion as well as deliver O2 to smaller vessels by convection. Arterioles are also the site where the local blood flow (and hence O2) distribution is regulated through dynamic changes in diameters and flow resistance [5]. One of the mechanisms for microvascular blood flow regulation that is under current investigation depends on the oxygen saturation-dependent release by red blood cells (RBCs) of the signaling molecule ATP [6]. Increased RBC ATP release due to decreased O2 saturation results in a vasodilation signal that conducts upward through the microvascular tree. This signal can originate in arterioles, capillaries or venules. The regulation system has been modeled using a radially-averaged description of O2 and ATP transport [7]; however, there are details of the system that remain to be investigated and require inclusion of both radial and longitudinal variations as well as time-dependent changes. Therefore, it is of interest to develop a realistic model of O2 transport from an arteriole to the surrounding tissue that can be used to study diffusive delivery of O2 and also oxygen-based flow regulation in microvascular networks which requires accurate and efficient estimates of O2 loss from arterioles.
Popel and Gross [8] presented a mathematical model of oxygen transport in the precapillary microcirculation. This model, which included a continuum description of the role of capillaries as sinks/sources in the surrounding tissue, was used to simulate oxygen distributions in arterioles of the hamster cheek pouch. Theoretical predictions of transmural and longitudinal oxygen tension (PO2) gradients were in qualitative agreement with experimental data. Subsequently, a mathematical model was developed by Weerappuli and Popel [9] to study the effect of capillary convection on oxygen transport around arterioles that are surrounded by capillaries. These capillaries carry unidirectional flow perpendicular to the arteriole. A convection equation describing the steady-state oxygen tension in the tissue was solved numerically in polar coordinates. From these numerical results a prediction of longitudinal gradients of hemoglobin-oxygen saturation along arterioles and venules was obtained. Although the previous two models did investigate the role of tissue properties on O2 diffusion from arterioles, they did not include radial variations in intraluminal O2.
In considering O2 transport from arterioles, radial variations in intraluminal O2 are important for two reasons. First, radial O2 gradients inside an arteriole imply an inherent resistance to diffusive transport of O2 from the vessel. Krogh’s original model of capillary-tissue O2 transport [10], for example, does not consider intraluminal resistance. However, this resistance is now known to be important in determining O2 losses from capillaries and has been calculated using a detailed intracapillary model [11]. Intraluminal resistance is similarly important in determining O2 losses from arterioles [12]. The second reason that radial variations in intraluminal O2 are important is that they determine the PO2 environment in and around the vessel, which can affect the function of RBCs (as described above) and other cells (e.g., endothelial and smooth muscle).
To assess intraluminal resistance in arterioles, Hellums and co-workers [13,14,15] have developed a model for intraluminal oxygen transport in arteriole-size vessels (‘large capillaries’), where the vessel is considered to be embedded in a thin film of silicone rubber in order to match an in vitro experimental system [16, 17]. The model takes into account convection of plasma and RBCs in a cell-rich region together with a thin cell-free region of plasma. The model contains four coupled partial differential equations describing diffusion of free O2 in the cell-free layer, in the plasma surrounding RBCs, and in RBCs, and diffusion of hemoglobin-bound O2 in RBCs. Three of these equations are non-linear because of the slope of the oxyhemoglobin dissociation curve. These equations have a term defined as the reaction rate, which is the rate of oxygen dissociation from hemoglobin per unit volume of RBC. Since no hemoglobin escapes from the RBCs, the total heme concentration within the RBC remains constant. The convective terms have plasma and RBC velocity profiles together with a radial distribution of hematocrit. In simulating the experimental results of Boland et al. [16], transport in the silicone rubber phase is incorporated as a boundary condition at the capillary wall as described by Lemon et al. [17].
Using an intravascular O2 transport model similar to that of Nair [13], Chen et al. [18] solved the coupled mass transport equations for O2 and NO (nitric oxide) to determine their distribution inside the lumen of an arteriole and in the surrounding tissue. The purpose of this investigation was to study the effect of RBCs near the arteriole wall on NO and O2 transport. Results were computed at the middle of a 250 micron long arteriole (15 micron luminal diameter) and showed a change in intravascular PO2 of ~10 mmHg from the centerline to the plasma-RBC core interface. The effect of the presence or absence of RBCs near the endothelium was studied while varying the endothelial surface layer and plasma layer thicknesses. Chen et al. [19] investigated the co-transport of NO and O2 in an arteriole–venule pair surrounded by capillary-perfused tissue. Their O2 transport results suggested that the capillary bed around the paired arteriole and venule could significantly facilitate release of O2 into the surrounding tissue. However, as in [18], their assumptions were such that tissue PO2 rapidly fell to zero away from the arteriole-venule pair due to the absence of an independent capillary O2 supply. Similarly, the model of arteriolar NO-O2 transport described by Gundersen et al. [20] did not contain a realistic model of capillary-supplied tissue. Therefore, while these models provided new insights into intraluminal transport of NO and O2, they did not adequately consider the effect of the surrounding tissue.
In this paper, we utilize the simplified model of Nair et al. [13] describing the intraluminal problem of oxygen transport in an arteriole containing a RBC-rich core with a plasma sleeve region joined to it. In this model, the four partial differential equations describing free and hemoglobin-bound O2 transport [14] are reduced to one non-linear equation and one linear equation by: (1) assuming chemical equilibrium within the RBCs between oxygen and oxyhemoglobin, and (2) neglecting intracellular and extracellular boundary layer resistances. Here we consider the same nonlinear partial differential equation (PDE) used by Nair et al. [13] to describe O2 transport in the RBC-rich core (see also Hellums et al. [12]) together with a steady-state convection-diffusion equation describing O2 transport in the cell-free plasma region. A novel solution is presented for the oxygen transport from such an arteriole to a continuous capillary-tissue matrix immediately adjacent to the arteriole. The transport of oxygen in the capillary-tissue matrix is described in a similar fashion to [8] and [21]. As discussed by Goldman [21], oxygen transport in oxygen-consuming capillary-perfused tissue differs from transport by pure diffusion. Therefore, the use of a capillary-tissue matrix outside the arteriole provides a more realistic boundary condition than would alternative assumptions such as fixed PO2 or O2 flux on the boundary of the lumen, or the use of a purely diffusive medium surrounding the arteriole with specified far-field boundary conditions.
For the capillary-tissue matrix, a one-dimensional (1D) reaction-diffusion equation in cylindrical coordinates is presented that models oxygen delivery by capillaries and oxygen diffusion and consumption. The tissue O2 consumption rate is assumed to be constant, and a PO2-dependent description is given of the dual role of capillaries as sources and sinks. A steady-state analytical solution is presented which we incorporate via a boundary condition in the intraluminal problem involving the arteriole itself. The governing equation for oxygen transport in the arteriole is solved numerically in cylindrical coordinates using a Crank-Nicholson algorithm, and the solution includes parameters needed in the analytical solution describing oxygen transport in the tissue.
It is important to know to what extent such factors as blood flow rate, vascular diameter, and tissue PO2 influence both longitudinal and radial PO2 gradients in arterioles. The model presented here can be solved to determine saturation along the length of an arteriole with prescribed PO2 values at the inlet of the vessel and in the tissue far from the vessel. In this paper, we first present the governing equations of oxygen transport in arterioles and then develop the boundary condition used for the capillary-tissue matrix. Next we describe a numerical procedure using the Crank-Nicholson method to solve the coupled arteriole-tissue problem and present verification of our intraluminal transport model. Finally, we present results for longitudinal and radial changes in arteriolar O2 and arteriole-tissue mass transfer coefficients for O2 obtained with our model, and discuss our results in the context of available experimental data and related models.
2. MATHEMATICAL MODEL
2.1 Intraluminal Oxygen Transport
The geometry of the present mathematical model is shown in Figure 1. The intravascular model considers a core region (r < Rr) containing a mixture of plasma and RBCs surrounded by a cell-free plasma layer (Rr < r < Rc) of thickness δ = Rc − Rr. The extravascular model considers a tissue layer (r> Rc) containing a continuous distribution of capillaries.
Figure 1.
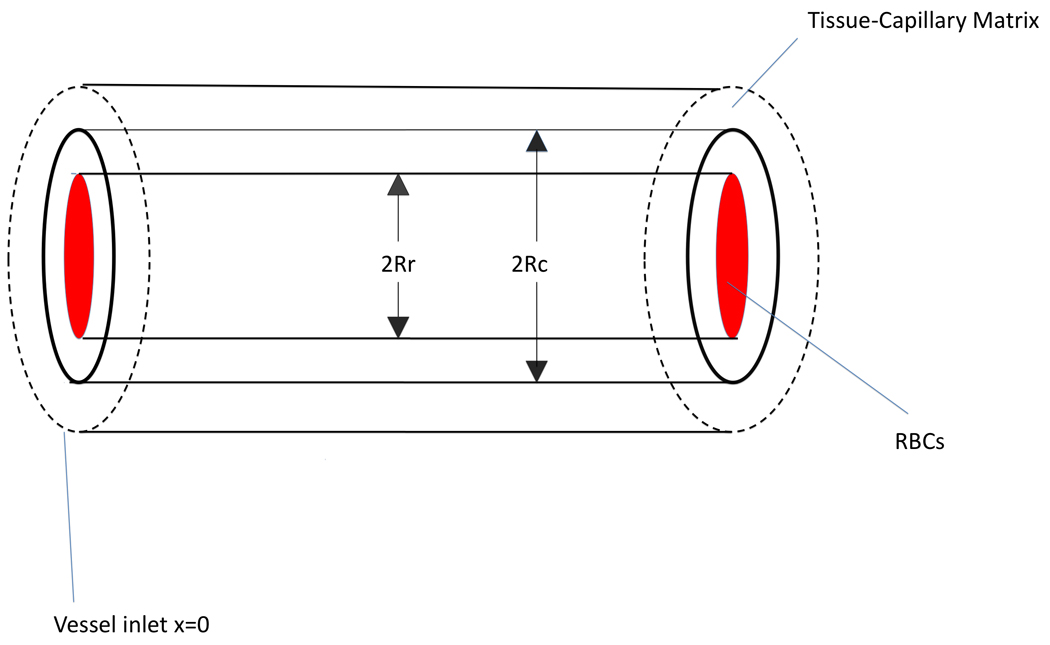
Geometry of mathematical model used.
The equations governing oxygen transport in the arteriole are [12]:
| (1a) |
| (1b) |
where the subscript ‘p’ denotes values in the plasma and the subscript ‘rbc’ denotes values in the RBCs. The term is the slope of the oxyhemoglobin dissociation curve and is a nonlinear function of P (see Nair et al. [13]). This dissociation curve can be approximated by the Hill equation:
| (2) |
where n is an empirical constant and P50 is the oxygen tension that yields S = 0.5. HbT is the total heme concentration which is equal to four times the hemoglobin concentration due to the fact that there are four heme groups on each hemoglobin molecule. Dp is the O2 diffusion coefficient in plasma and has units of cm2/s, and αrbc and αp are the solubilities of O2 in the RBCs and plasma, respectively, and have units of M/mmHg. Differentiating the Hill equation with respect to P gives the following equation
| (3) |
As a result of (3), the governing equation for PO2 becomes a nonlinear parabolic partial differential equation.
The functions , and Vrbc(r) in Equation (1a) are now defined. It is assumed that there are many RBCs at any cross-section of the arteriole. The distribution of RBCs is such that hematocrit is higher at the center of the arteriole and lower near the wall. The RBC distribution given by Nair et al. [14] is
| (4) |
where we determine the constants hm and m in the Appendix.
Convective transport in the cell-free (plasma) and cell-rich (RBCs) regions involves specific assumed velocity profiles. These are given as the following parabolic profiles [14]:
| (5) |
where the velocity in the cell-rich region is a slight deviation from Poiseuille flow represented by the blunting factor Bl. Finally, the velocity of the RBCs is given as
| (6) |
where slp is called the slip velocity.
In reference [14] a method is described for determining the parameters a, b, hm, and m but specific values for these parameters are not given. In the Results section we give values for a, b, hm, and m which are obtained using Maple to solve four equations in four unknowns. The four equations (shown in Appendix) represent continuity of plasma velocities given by Equation (5) at r = Rr, overall RBC mass balance using the discharge hematocrit, overall plasma mass balance, and the tube hematocrit. In the present model, blood flow is scaled according the vessel cross-section so that velocity is approximately constant for all vessel sizes (1.10–1.14 cm/s at the centreline).
Equations (1a)–(1b) require one boundary condition in x and two in r. For the boundary condition in x, we specify a constant inlet PO2 at x =0: P(0, r)=Pin. The first boundary condition in r is zero flux at r =0: ∂P/∂r=0. For the second boundary condition in r, rather than specify PO2 at the lumen surface (r = Rc), we require that intraluminal PO2 match an analytical solution describing O2 transport in the surrounding tissue.
2.2 Tissue Boundary Condition
We now consider a model of radial O2 transport in tissue that can be solved analytically to obtain a boundary condition for the preceding intraluminal transport problem. This steady state 1D model of tissue PO2 is given by the following [21]
| (7) |
where Dt and α are the tissue O2 diffusion coefficient and solubility respectively (units of cm2/s and M/mmHg), M0 is the local O2 consumption rate (units of M/s), P* is the average capillary PO2, and κ is a constant that depends on the capillary mass transfer coefficient and density and represents the average flux of O2 for a given difference between tissue (P) and capillary (P*) PO2. Note that this model does not consider O2 diffusion in the tissue in the direction parallel to the vessel (i.e., in x).
Equation (7) can be put in the form
| (8a) |
| (8b) |
A is assumed positive [21] and represents the balance between capillary O2 supply and tissue O2 consumption when P = 0 (maximum O2 flux into the tissue), while B determines how O2 flux into the tissue decreases for P > 0.
Equation (8a) is solved subject to the boundary conditions at the surface of the arteriole (r = Rc when a separate vessel wall is not considered) and far from the arteriole. These conditions are: P(Rc) = Pw and . Implementing the boundary conditions at the surface of the arteriole and at infinity we get the solution
| (9) |
where K0 is the zeroth order modified Bessel function of the second kind.
We now use this solution to obtain the boundary condition at r = Rc for the intraluminal problem. We first solve Equation (1b) to define a boundary condition for Equation (1a). In [13], for essentially the same intravascular transport model used here, Nair et al. showed that neglecting convection in the cell-free layer did not alter O2 transport results in comparison to a similar model [14] that included convective transport in the cell-free layer. Therefore, we assume that convective transport of O2 in the region Rr ≤ r ≤ Rc is small relative to transport by diffusion and set to zero in Equation (1b). We then have the following equation and general solution in the cell-free region:
| (10) |
| (11) |
where A1 and A2 are constants to be determined and the gradient in the cell-free region is
| (12) |
Continuity of PO2 values and fluxes at Rc and Rr gives
| (13) |
| (14) |
where 't' subscripts denote tissue values, 'r' subscripts denote values in the cell-rich region, and Pw = Pt(Rc). This gives four equations in 4 unknowns, Pw,A1,A2,Pr(Rr):
| (15) |
| (16) |
| (17) |
| (18) |
Solving for A1, using the derivative flux in Eq. (13), and differentiating Pt w.r.t. r gives an equation which can be solved for Pw.
| (19) |
From Equation (17)
| (20) |
Solving for Pw:
| (21) |
| (22) |
Equations (21) and (22) together define our tissue model boundary condition. This boundary condition is used in the numerical solution of Equation (1a) by means of the Crank-Nicholson method.
2.3 Inclusion of an Avascular Vessel Wall
Popel and Gross [8] have solved the problem of oxygen transport through an avascular oxygen-consuming wall surrounded by an external region of tissue described by Equation (8a). However, in [8] radial oxygen gradients inside the vessel were not considered. Therefore, we add a vessel wall to our model to determine its effect on oxygen transport. We have confirmed the analytical solutions of [8] (p.H682, Equation 3) for the case where the penetration depth given is , with B given by Equation (8b). An arteriole is considered with inner radius Rc, outer radius Re (including the wall), and constant oxygen consumption Mw. The Fick equation is solved in the wall of the arteriole together with Equation (8a) in the tissue region. The PO2 in the wall region (Rc ≤ r ≤ Re) is then given by:
where
With the solution for Pw(r) shown we calculate the saturation by means of a similar approach as in Equation (21). Differentiating Pw(r) and using
Pw is obtained and the boundary condition is determined. We used this boundary condition numerically as in the vessel-tissue model described above.
3. NUMERICAL METHODS
3.1 Solution of Coupled Vessel-Tissue Problem
Discretizing Equation (1a) using the Crank-Nicholson (C-N) method as a function of radius distance r and longitudinal distance x gives the following system of algebraic equations:
| (23) |
where i = 1,2,…,Nr and j = 1,2,…,Nx, and Nr and Nx are the number of subdivisions in the radial and axial directions of the vessel, respectively. Also
| (24) |
The accuracy of finite-difference formulas for partial differential equations is usually characterized by the approximation order of the local truncation error as determined by Taylor expansions. The local truncation error of the C-N formula is O(Δx2 + Δr2) where Δx and Δr are the finite-difference grid spacings in the x and r directions, respectively.
The left side of Equation 22 is approximated by a first-order formula for the derivative of P w.r.t. r:
| (25) |
where for clarity we let N = Nr and suppress the second subscript on Pij. Note that PN+1 = Pr(Rr).
Simplifying the above we set:
| (26) |
| (27) |
After a few steps we arrive at:
| (28) |
Equation (28) is the desired relation for the PO2 at the edge of the cell-rich region of the vessel (r = Rr) in the discretization of Equation (1a). As shown by Osterby [22], the accuracy of the C-N method (23–24) subject to (28) will actually be first order since we have used a first-order formula for the derivative (25). To solve the system of algebraic equations for each j given by (23)–(24), we use the Thompson algorithm [23], Appendix B pp491].
3.2 Verification of Intraluminal Transport Model
As mentioned in the Introduction, Nair et al. [13] have provided a relatively simple model for accurate simulation of O2 transport from blood flowing in vessels larger than ~0.0020 cm and have presented results for the case where the capillary is embedded in a thin film of silicone rubber. In that model, Equation (1a) is solved subject to the following boundary condition:
| (29) |
where and Pext is the PO2 in the gas surrounding a silicone rubber film [13 pp210]. K is the O2 permeability of silicone rubber and d is the half thickness of silicone rubber film. The following parameter values have been chosen in accordance with Nair et al. [14]: αrbc = 1.47 × 10⁻⁶M/mmHg, αp = 1.33 × 10⁻⁶ M/mmHg, Dp = 2.75 × 10⁻⁵ cm2/s, and γ=0.1752.
Our numerical results for the solution of Equation (1a) subject to the boundary condition (29) were obtained for both O2 release (Pext=0 mmHg, Pin=159.6 mmHg) and uptake (Pext=159.6 mmHg, Pin=0). A volumetric flow rate of 3.33 × 10⁻⁶ml/s and a discharge hematocrit of 0.3 were used. Comparison of our results to those of Nair et al. [13: p.209 Figure 3] showed excellent agreement with calculated changes in intraluminal O2 content (radially averaged SO2) as a function of axial distance. We also found general agreement (especially for larger vessels, see Figure 2) with the Sherwood number (defined below and equivalent to the Nusselt number used in [12]) vs. O2 saturation curves of Hellums et al. [12: p.14 Figure 13]. Figure 2 was obtained for near zero O2 permeability of silicone rubber. The Sherwood number increases with increasing arteriole radius and for each radius the Sherwood number decreases with decreasing saturation. In addition, the plots of Sherwood number versus saturation have a greater slope as the radius of the arteriole increases. Based on these comparisons, we consider our intraluminal transport code validated and suitable for application to the main problem of interest in this paper, i.e., Equation (1a) subject to the boundary condition (28). Note that Nair et al. [13] verified their results by direct comparison to experimental measurements.
Figure 2.

Curves for Sherwood number versus saturation computed using the present intraluminal oxygen transport model with Dirichlet boundary conditions for Rc=0.0050, 0.0027, 0.00135, 0.0010 and 0.0006 cm. Filled circles show comparison results from Hellums et al. [12] for Rc=0.0050 (black), 0.0025 (red), 0.0015 (yellow) and 0.0010 cm (cyan). Differences in Sh for Rc≤0.0010 cm are believed to be due to the fixed plasma layer thickness (δ) in the present work vs. the variable layer thickness in [12].
4. RESULTS
4.1 Velocity and Hematocrit Profiles
We have solved the equations given in the Appendix to obtain m, hm, a and b for the different vessel radii as shown in Table 1. For all of the radii we have used Bl = 0.9, in agreement with the in vitro values reported by Pittman and Ellsworth [24], and slp = 0.1 which was calculated for a single particle by Sinha [25]. The value δ =1.6µm is chosen to represent the upper end of the range used by Nair et al. [14]. As can be seen in Table 1, as the radius of the vessel increases from Rc = 0.0006cm to Rc = 0.0050cm the value of m increases, meaning that RBCs are more uniformly distributed across the vessel radius.
Table 1.
Hemodynamic parameters calculated from Appendix for HD=0.3.
| Rc (cm) | HT | m | hm | a | b |
|---|---|---|---|---|---|
| 0.0006 | 0.2100 | 3.67 | 0.595 | 1.275 | 1.142 |
| 0.0010 | 0.2325 | 6.55 | 0.430 | 1.393 | 1.124 |
| 0.00135 | 0.2370 | 4.42 | 0.443 | 1.505 | 1.116 |
| 0.0027 | 0.2640 | 8.59 | 0.368 | 1.955 | 1.105 |
| 0.0040 | 0.2730 | 9.83 | 0.357 | 2.397 | 1.102 |
| 0.0050 | 0.2700 | 9.87 | 0.354 | 2.732 | 1.098 |
4.2 Other Parameters of the Model
To calculate the PO2 distribution in the intravascular space, it is necessary to know all the parameters in the governing equation as well as those for the tissue model. The values of the intravascular parameters according to Nair et al. [14] are plasma O2 diffusion coefficient Dp = 2.75 × 10⁻⁵ cm2/s, RBC O2 solubility αrbc = 1.47 × 10⁻⁶ M/mmHg, plasma O2 solubility αp = 1.33 × 10⁻⁶ M/mmHg, total heme concentration HbT = 5.35mM, P50 = 27mmHg and n = 2.7 (values for human blood). At x = 0, P = Pin = 100mmHg.
The tissue parameters used are: αt = 1.53 × 10⁻⁶ M/mmHg M0 = 5.91 × 10⁻⁶ M/s, and Dt = 2.41 × 10⁻⁵ cm2/s in accordance with Vadappalli et al. [26]. In Equation (8b), A = 26.14 and B = 0.625 [21]. Therefore, in the tissue far from the vessel we have PO2 = A / B = 41.8 mmHg. Note that determines how quickly the far-field PO2 value is reached. Taking luminal surface PO2 (Pw) and far-field PO2 (A/B) to be free parameters, we have found that the tissue PO2 distributions measured in [27] near 10–20µm arterioles are generally well-matched by the tissue model with ; 160. This is the same value given by our above choices for Dt and B, providing additional support for the parameters used in our tissue model.
4.3 Oxygen Transport Calculations
Using Equation (28) in Equations (23)–(24), we have verified first-order convergence in Δr for Rc = 0.0010cm and x=0.05cm using Nx = 8000 and Nr = 80, 160,…, 5120, 8000. We have also verified convergence in Δx using Nr =160 and Nx = 4000, 8000,…, 128000. Based on these convergence tests, we have used Δx=10−5cm (giving Nx = 40000 when x=0.4cm) and Nr = 160 to obtain the results below.
A plot of oxygen tension through the three layers considered (RBC core, plasma, tissue) is shown in Figure 3. Four distances downstream are shown: x=0.01cm, 0.1cm, 0.4cm and 4.8cm. In all cases it is clear that PO2 decreases through the layers towards the far-field value A / B as r increases.
Figure 3.

Radial PO2 (oxygen tension) changes through intravascular-plasma-tissue regions for vessel with Rc=0.00135cm at four axial distances downstream of entrance: x=0.01, 0.1, 0.4, 4.8cm. Results were computed using the tissue model boundary condition with P∞=A/B=41.8mmHg.
PO2 (P) in the cell-rich region was calculated as a function of r and x, and this was then converted to saturation (S) using the Hill equation (2). Radially-averaged S was obtained via the formula:
| (30) |
An average value for PO2 at each x was then calculated by inverting the Hill equation:
| (31) |
The saturation S̄ is plotted versus axial length in Figure 4 for a vessel of length 0.4 cm and a range of different vessel radii. The saturation decreases substantially for all radii, with a faster decrease for smaller vessels compared to larger vessels. In Figure 5 we plot P̄ versus x along with the reference value P∞ = A / B. A trend is observed that the PO2 decrease is greatest for the smallest vessel (Rc = 0.0006cm) and progressively decreases for increasing radii up to the largest vessel considered (Rc = 0.0050cm).
Figure 4.

Radially averaged oxygen saturation versus axial position x from the vessel entrance for six vessels with Rc = 0.0050, 0.0040, 0.0027, 0.00135, 0.0010 and 0.0006cm
Figure 5.

PO2 versus axial position obtained from radially averaged oxygen saturation results shown in Figure 4.
The dimensionless Sherwood number is given by the following:
| (32) |
where P̄ is given by (31). The dimensional radial gradient is given by the right-hand side of Equation (20). Sh is plotted in Figure 6 versus S̄ for P∞ = A / B = 41.8mmHg. Sh(S̄) is observed to be fairly flat for small radius (Rc = 0.0006cm) and become steeper as radius increases (up to Rc = 0.0050cm). This is similar to the findings for the verification model previously discussed. Note that, using the tissue model, Sh increases slightly as we decrease P∞ from 41.83mmHg to 0mmHg, which could represent increased tissue O2 consumption or decreased capillary O2 supply. A far-field tissue PO2 of P∞ = 0 gives Sh versus saturation plots, as shown in Figure 2, that closely match those presented by Hellums [12:pp14 Figure 13] where a wall PO2 of approximately zero was assumed. Although not discussed in [12], Sh results depend on the assumed wall PO2 (or Pext) for Dirichlet boundary conditions in a similar manner to their dependence on P∞ for the tissue model.
Figure 6.

Sherwood number versus radially averaged oxygen saturation for vessels with Rc = 0.0050, 0040, 0.0027, 0.00135, 0.0010 and 0.0006cm.
To quantify the effect on arteriolar O2 losses of varying far-field tissue PO2, we have defined a modified, tissue PO2-based Sherwood number:
For P∞ = 41.8mmHg, we have plotted Shtissue versus saturation and vessel radius in Figure 7. While Sh vs. S̄ curves change only slightly as tissue PO2 varies from 41.8 to 10mmHg (see Figures 2 and 6), Shtissue changes substantially as seen in plots of Shtissue versus diameter for different values of P∞ (Figure 8). These results provide mass transfer coefficients that can be used to calculate arteriolar O2 losses in the absence of detailed information on the tissue PO2 distribution.
Figure 7.

Modified Sherwood number Shtissue versus saturation and vessel radius for P∞ = 41.83mmHg.
Figure 8.

Modified Sherwood number Shtissue versus arteriole diameter for S̄ = 0.8 and P∞ = 41.83mmHg, 25mmHg, and 11mmHg.
Radial PO2 profiles in the RBC core at scaled distance β = x / Rc = 80 along the arteriole are shown in Figure 9 for 0 ≤ r ≤ Rr. There are significant radial gradients in PO2 in arterioles between the centerline and plasma region particularly for larger diameter vessels. The PO2 is flatter near the centre of the vessel for higher diameter vessels and remains flat for a significant distance from the centerline, whereas for small diameter vessels the PO2 drops quickly from the centerline of the vessel. Radial PO2 profiles at Rc = 0.00135cm and Rc=0.0050cm were obtained, respectively, for varying axial distance x. It is clearly seen that the decrease in PO2 from inlet value is less for the larger diameter vessels, with the PO2 increasing for a given x value as the radius of the vessel increases from Rc = 0.00135cm to Rc = 0.0050cm. Also, the drop in PO2 across the radius of the vessel is greater for the larger diameter vessel compared to the smaller diameter vessel.
Figure 9.

PO2 in the RBC core of the vessel versus radius r at scaled distance downstream of the entrance of β = x/Rc = 80 using the tissue model for six arterioles with Rc = 0.0050, 0040, 0.0027, 0.00135, 0.0010 and 0.0006cm.
To examine the effect of an avascular oxygen-consuming vessel wall, we used the same parameters as in our tissue model with the added wall consumption rate Mw = 1.18110236 × 10⁻⁵ M/s (twice the tissue O2 consumption rate and in the range of estimates for smooth muscle given by Vadapalli et al. [28]) and wall O2 diffusion coefficient and solubility, respectively, Dw = Dt and αw = αt. The vessel wall thickness was calculated according to [28] and Swain and Pittman [29] as w = 0.24d + 0.39µm, where d is the vessel diameter in µm.
For smaller diameter arterioles, radial PO2 profiles and saturation plots for the model with a vessel wall coincided almost exactly with the results for our model without a vessel wall (results not shown). For larger arterioles, as shown in Figure 10 for Rc = 0.0050cm, there was a slight difference in the radial PO2 profiles computed with and without a consuming wall. Note that for the wall O2 consumption rate used here there is actually a slight decrease in O2 flux when a consuming wall is added, and hence the intraluminal PO2 profile with a wall is higher and has a smaller gradient at the luminal surface compared to the profile without a wall. This effect, which is due to capillaries in the tissue model acting as sinks for wall PO2 values much higher than the tissue equilibrium value (A/B), reverses for substantially higher wall O2 consumption rates (results not shown). As shown in Figure 11, a consuming wall does not change Sh for smaller arterioles and causes only a slight change in Sh for larger arterioles. This is explained by P̄ − Pw being smaller for the model with a consuming wall, which tends to balance the decrease in flux out of the lumen and keep Sh approximately constant (see Eq. 32).
Figure 10.

PO2 in the RBC core versus radius position r for tissue model with and without a consuming wall for x = 0.4cm downstream of the entrance and Rc = 0.005cm.
Figure 11.

Sherwood number versus saturation: comparison of models with and without O2 consuming wall for Rc=0.00135cm and Rc=0.0050cm.
5. DISCUSSION
Our computational model of O2 transport from an arteriole includes both a detailed model of intraluminal transport and a more physiological boundary condition than has been used previously. Using a simple model of capillary-perfused, O2-consuming tissue, we are able to specify mean tissue PO2 far from the vessel and obtain an appropriate vessel-tissue boundary condition. With this boundary condition, our vessel-tissue model allows us to calculate radial and axial variations in SO2 and PO2 inside individual arterioles containing flowing blood and surrounded by living tissue. For different size arterioles, we calculated how the radially-averaged oxygen saturation decreases with increasing distance x downstream from the vessel inlet (Figure 4) and how the corresponding average PO2 decreases with increasing x (Figure 5). Radial decreases in PO2 are also calculated inside the vessels (Figure 7), as well as in the tissue region for increasing distance from the vessel (Figure 3). Our calculations show appreciable radial drops in intraluminal PO2 from the centerline to the edge of the RBC core (~10mmHg) for all vessel sizes considered, even at 80 diameters from the vessel inlet (Figure 7). These results are similar to the measurements in [4], where appreciable centerline-perivascular PO2 decreases of 8.3mmHg and 4.0mmHg were found for large (0.00458 cm) and small (0.00199cm) arterioles, respectively.
We can compare our vessel-tissue model to the case where PO2 is specified at the edge of the lumen, which is a limiting case for our model when the length constant is very small, i.e., when PO2 decreases quickly near the arteriole. This comparison (Figure 12) shows for a range of different values of P∞ (from 10mmHg to 41.83mmHg) that the oxygen loss is substantially less for our boundary condition derived from the tissue model than for the corresponding Dirichlet (fixed wall PO2) boundary condition. Thus, our model demonstrates that it is important to consider the surrounding tissue’s intrinsic far-field PO2 value (set by the balance between mitochondrial O2 consumption and capillary O2 supply) and transport properties when calculating O2 losses from arterioles, and the appropriate mass transfer coefficients (Shtissue) must be used. This result is particularly significant because the O2 content of arterioles is believed to be a key factor in the regulation of microvascular blood flow [6, 7].
Figure 12.

Radially averaged oxygen saturation versus axial length x for prescribed Dirichlet wall condition in the Nair model [13] compared to solution with the tissue model boundary condition for an arteriole with Rc=0.00135cm. The external fixed PO2 for the Nair model was set to 41.8 mmHg, while the far-field PO2 in the tissue model was 10–41.8 mmHg.
Another important finding of our numerical simulations is that most of the diffusional loss of oxygen in the arteriole is from RBCs near the wall of the vessel, at the edge of the cell-free plasma layer. This was found experimentally by Carvalho and Pittman [4] and is most apparent in our results for large diameter vessels as can be seen in the substantial drops in oxygen tension near the region r = Rr compared to the centerline of the vessel in Figure 7. These RBCs have a lower O2 saturation than those nearer the centre of the vessel. This is supported by [30] where the largest part of the resistance to oxygen transport was intra-arteriolar. Chen et al. [18] also confirmed this finding with substantial changes in PO2 from the centerline of a 0.0250 cm long arteriole to the plasma-core interface at a distance of 0.0125 cm from the inlet. The maximum intravascular change in oxygen tension was about 10mmHg for an arteriole of diameter 0.0019cm (including vascular wall), which is similar to our finding of a 13mmHg intravascular PO2 drop for a vessel with Rc = 0.0010cm at a distance of 0.0125cm from the inlet. However, typical wall PO2 found with the Chen et al. model (~30mmHg) was lower than our predictions (>70mmHg) due to the absence of a capillary supply of O2. Chen et al. also showed that a blunter velocity profile can significantly enhance O2 delivery to tissue. Their simulations demonstrated that the presence of RBCs in the plasma layer decreases NO availability, but enhances O2 availability to tissue, and that the effect on NO transport is much more pronounced than that on O2 transport.
Our numerical simulations showed that slower longitudinal decreases in PO2 occurred for larger diameter vessels than for smaller diameter vessels, as seen in Figures 4–5. Although larger vessels had higher O2 flux, their higher flow rates (since blood velocity was approximately constant) led to smaller longitudinal drops in PO2. Our model likely overestimates actual flow rates in smaller vessels, implying their PO2 decreases even faster than predicted. A supporting result was obtained experimentally by Vovenko [31] where the distribution of PO2 was studied on the surface of arterioles, capillaries and venules of rat brain cortex, both longitudinally and radially (into the tissue). It was observed that the smallest arterioles show the largest decreases in SO2, with 3rd, 4th and 5th order arterioles having drops of 1%, 4% and 5%, respectively.
By including an avascular O2-consuming wall in one version of our model, we showed that for modeling O2 transport from arterioles in tissues with a moderate to high O2 consumption rate, as considered here, inclusion of a separate vessel wall does not substantially change intraluminal O2 distributions or Sherwood numbers. For less metabolically active tissues (such as mesentery) or situations where tissue metabolism is compromised (as in advanced sepsis [32]), the vessel wall would likely need be considered.
6. CONCLUSIONS
We have developed a novel computational model of O2 transport from arterioles that combines a detailed description of intravascular transport and a realistic model of transport in tissue. This model has been verified by comparison to a previous intraluminal transport model and through convergence studies, and the results of our vessel-tissue model have been shown to be consistent with recent experimental measurements of O2 transport from arterioles. This new model demonstrates the importance of considering the O2 consumption rate and capillary O2 supply of the surrounding tissue when calculating O2 transport from arterioles and provides mass transfer coefficients that can be used to calculate arteriolar O2 losses given mean tissue PO2.
ACKNOWLEDGMENTS
This work was supported by National Institutes of Health grant HL089125.
APPENDIX
Continuity of plasma velocities at the interface of the cell-free and cell-rich regions gives the first equation involving the parameters a and b
| (A1) |
The overall RBC mass balance defining the discharge hematocrit is
| (A2) |
The overall plasma mass balance is
| (A3) |
The tube hematocrit is defined by
| (A4) |
Using equations [4], [5] and [6] and after some algebra we can rewrite (A1–A4) as
| (A5) |
| (A6) |
| (A7) |
| (A8) |
For each vessel radius considered in this paper, we solve equations (A5–A8) for m, hm, a, and b using specified blood flow Q and discharge hematocrit HD, and a tube hematocrit HT obtained from Gaehtgens [33].
Footnotes
Publisher's Disclaimer: This is a PDF file of an unedited manuscript that has been accepted for publication. As a service to our customers we are providing this early version of the manuscript. The manuscript will undergo copyediting, typesetting, and review of the resulting proof before it is published in its final citable form. Please note that during the production process errors may be discovered which could affect the content, and all legal disclaimers that apply to the journal pertain.
REFERENCES
- 1.Duling BR, Berne RM. Longitudinal gradients in periarteriolar oxygen tension. Circ. Res. 1970;27:669–676. doi: 10.1161/01.res.27.5.669. [DOI] [PubMed] [Google Scholar]
- 2.Ellsworth ML, Pittman RN. Arterioles supply oxygen to capillaries by diffusion as well as by convection. Am. J. Physiol Heart Circ. Physiol. 1990;258:H1240–H1243. doi: 10.1152/ajpheart.1990.258.4.H1240. [DOI] [PubMed] [Google Scholar]
- 3.Bertuglia S, Limon A, Andresen B, Hoffmann KH, Essex C, Salamon P. Transport of O2 from arterioles. Journal of Non-Equilibrium Thermodynamics. 2005;30(2):151–162. [Google Scholar]
- 4.Carvalho H, Pittman RN. Longitudinal and radial gradients of PO2 in the hamster cheek pouch microcirculation. Microcirculation. 2008;15:215–224. doi: 10.1080/10739680701616175. [DOI] [PubMed] [Google Scholar]
- 5.Segal SS. Regulation of blood flow in the microcirculation. Microcirculation. 2005;12(1):33–45. doi: 10.1080/10739680590895028. [DOI] [PubMed] [Google Scholar]
- 6.Ellsworth ML, Ellis CG, Goldman D, Stephenson AH, Dietrich HH, Sprague RS. Erythrocytes: oxygen sensors and modulators of vascular tone. Physiology (Bethesda) 2009;24:107–116. doi: 10.1152/physiol.00038.2008. [DOI] [PMC free article] [PubMed] [Google Scholar]
- 7.Arciero JC, Carlson BE, Secomb TW. Theoretical model of metabolic blood flow regulation: roles of ATP release by red blood cells and conducted responses. Am. J. Physiol. Heart Circ. Physiol. 2008;295(4):H1562–H1571. doi: 10.1152/ajpheart.00261.2008. [DOI] [PMC free article] [PubMed] [Google Scholar]
- 8.Popel AS, Gross JF. Analysis of oxygen diffusion from arteriolar networks. Am. J. Physiol. 1979;237(6):H681–H689. doi: 10.1152/ajpheart.1979.237.6.H681. [DOI] [PubMed] [Google Scholar]
- 9.Weerappuli DPV, Popel AS. A model of oxygen exchange between an arteriole or venule and the surrounding tissue. Trans. of the ASME. 1989;111(24):24–31. doi: 10.1115/1.3168335. [DOI] [PubMed] [Google Scholar]
- 10.Krogh A. The number and distribution of capillaries in muscle with the calculation of the oxygen pressure necessary for supplying the tissue. J Physiol. 1919;52:409. doi: 10.1113/jphysiol.1919.sp001839. [DOI] [PMC free article] [PubMed] [Google Scholar]
- 11.Eggleton CD, Vadapalli A, Roy TK, Popel AS. Calculations of intracapillary oxygen tension distributions in muscle. Math. Biosci. 2000;167(2):123–143. doi: 10.1016/s0025-5564(00)00038-9. [DOI] [PubMed] [Google Scholar]
- 12.Hellums JD, Nair PK, Huang NS, Oshima N. Simulation of intraluminal gas transport processes in the microcirculation. Ann. Biomed. Eng. 1996;24:1–24. doi: 10.1007/BF02770991. [DOI] [PubMed] [Google Scholar]
- 13.Nair PK, Huang NS, Hellums JD, Olson JS. A simple model for prediction of oxygen transport rates by flowing blood in large capillaries. Microvasc. Res. 1990;39:203–211. doi: 10.1016/0026-2862(90)90070-8. [DOI] [PubMed] [Google Scholar]
- 14.Nair PK, Hellums JD, Olson JS. Prediction of oxygen transport rates in blood flowing in large capillaries. Microvasc. Res. 1989;38:269–285. doi: 10.1016/0026-2862(89)90005-8. [DOI] [PubMed] [Google Scholar]
- 15.Nair PK. Simulation of Oxygen transport in Capillaries. Rice University; 1988. [Google Scholar]
- 16.Boland EJ, Nair PK, Lemon DD, Olson JS, Hellums JD. An in-vitro method for studies on microcirculatory oxygen transport. J. Appl. Physiol. 1987;66(2):791–797. doi: 10.1152/jappl.1987.62.2.791. [DOI] [PubMed] [Google Scholar]
- 17.Lemon DD, Nair PK, Boland EJ, Olson JS, Hellums JD. Physiological factors affecting oxygen transport by hemoglobin in an in-vitro capillary system. J. Appl. Physiol. 1987;62:798–806. doi: 10.1152/jappl.1987.62.2.798. [DOI] [PubMed] [Google Scholar]
- 18.Chen X, Jaron D, Barbee KA, Buerk DG. The influence of radial RBC distribution, blood velocity profiles, and glycocalyx on coupled NO/O2 transport. J. Appl. Physiol. 2006;100:482–492. doi: 10.1152/japplphysiol.00633.2005. [DOI] [PubMed] [Google Scholar]
- 19.Chen X, Buerk DG, Barbee KA, Jaron D. A model of NO/O2 transport in capillary-perfused tissue containing an arteriole and venule Pair. Annals of Biomedical Engineering. 2007;35:517–529. doi: 10.1007/s10439-006-9236-z. [DOI] [PubMed] [Google Scholar]
- 20.Gundersen SI, Chen G, Palmer AF. Mathematical model of NO and O2 transport in an arteriole facilitated by hemoglobin based O2 carriers. Biophys. Chem. 2009;143:1–17. doi: 10.1016/j.bpc.2009.02.005. [DOI] [PMC free article] [PubMed] [Google Scholar]
- 21.Goldman D. A mathematical model of oxygen transport in intact muscle with imposed surface oscillations. Math. Biosci. 2008;213:18–28. doi: 10.1016/j.mbs.2008.01.010. [DOI] [PMC free article] [PubMed] [Google Scholar]
- 22.Osterby O. Denmark: DAIMI, Aarhus University; 1998. The error of the Crank-Nicholson method for linear parabolic equations with a derivative boundary condition, Report PB-534. [Google Scholar]
- 23.Jaluria Y, Torrance KE. Computational Heat Transfer 2nd Edition. New York London: Taylor and Francis; 2003. [Google Scholar]
- 24.Pittman RN, Ellsworth ML. Estimation of red cell flow in microvessels: Consequences of the Baker-Wayland spatial averaging model. Microvasc. Res. 1986;32:371–388. doi: 10.1016/0026-2862(86)90072-5. [DOI] [PubMed] [Google Scholar]
- 25.Sinha R, Kolloid Z. 1936;76:16–24. [Google Scholar]
- 26.Vadappalli A, Goldman D, Popel AS. Calculations of oxygen transport by red blood cells and hemoglobin solutions in capillaries. Art. Cells. Blood Subs. Immob. Biotech. 2002;30(3):157–188. doi: 10.1081/bio-120004338. [DOI] [PubMed] [Google Scholar]
- 27.Sharan M, Vovenko EP, Vadapalli A, Popel AS, Pittman RN. Experimental and theoretical studies of oxygen gradients in rat pial microvessels. J. Cereb. Blood Flow Metab. 2008;28:1597–1604. doi: 10.1038/jcbfm.2008.51. [DOI] [PMC free article] [PubMed] [Google Scholar]
- 28.Vadapalli A, Pittman RN, Popel AS. Estimating oxygen transport resistance of the microvascular wall. Am. J. Physiol. Heart Circ. Physiol. 2000;279:657–671. doi: 10.1152/ajpheart.2000.279.2.H657. [DOI] [PubMed] [Google Scholar]
- 29.Swain DP, Pittman RN. Oxygen exchange in the microcirculation of hamster retractor muscle. Am. J. Physiol. Heart Circ. Physiol. 1989;256:H247–H255. doi: 10.1152/ajpheart.1989.256.1.H247. [DOI] [PubMed] [Google Scholar]
- 30.Popel AS, Pittman RN, Ellsworth ML. Rate of oxygen loss from arterioles is an order of magnitude higher than expected. Am. J. Physiol. Heart Circ. Physiol. 1989;256:H921–H924. doi: 10.1152/ajpheart.1989.256.3.H921. [DOI] [PubMed] [Google Scholar]
- 31.Vovenko E. Distribution of oxygen tension on the surface of arterioles, capillaries and venules of brain cortex and in tissue in normoxia: An experimental study on rats. Pflügers Arch – Eur. J. Physiol. 1999;437:617–623. doi: 10.1007/s004240050825. [DOI] [PubMed] [Google Scholar]
- 32.Levy RJ. Mitochondrial dysfunction, bioenergetic impairment, and metabolic down-regulation in sepsis. Shock. 2007;28:24–28. doi: 10.1097/01.shk.0000235089.30550.2d. [DOI] [PubMed] [Google Scholar]
- 33.Gaehtgens P. Flow of blood through narrow capillaries: Rheological mechanisms determining capillary hematocrit and apparent viscosity. Biorheology. 1980;17:183–189. doi: 10.3233/bir-1980-171-220. [DOI] [PubMed] [Google Scholar]