

Abstract
Background
Abnormalities in glutamatergic neurotransmission are implicated in several psychiatric disorders, but in vivo neurochemical studies of the glutamate system have been hampered by a lack of adequate probes. On the other hand, glutamine and glutamate can be quantified separately in proton magnetic resonance spectroscopy studies in vivo. Accumulating evidence suggests that the glutamine/glutamate (Gln/Glu) ratio is a putative index of glutamatergic neurotransmission but interpretation of changes in the Gln/Glu ratio depends on the conditions of the system, including ammonia levels.
Methods
Here, we explored whether variation in GLS1 (the gene encoding the brain isoform of glutaminase which catalyzes Gln-to-Glu conversion) is associated with Gln/Glu measured in vivo in two brain regions (anterior cingulate cortex (ACC), parieto-occipital cortex (POC)).
Results
A specific haplotype of 4 single nucleotide polymorphisms within GLS1 was significantly associated with Gln/Glu in the POC in an MRS-genetics dataset optimized for Gln/Glu detection (N=42). This finding was replicated in a second MRS dataset that was optimized for GABA detection where Gln and Glu measurements could still be extracted (N=40).
Conclusions
These findings suggest that genetic variation in a key component of glutamatergic machinery is associated with a putative in vivo index of glutamatergic neurotransmission. Thus, GLS1 genotype may provide insight into normal brain function and into the pathophysiology of many psychiatric conditions where glutamatergic neurotransmission has been implicated. It might also serve as a biomarker for predicting response to existing and novel therapeutic interventions in psychiatry that target glutamatergic neurotransmission.
Keywords: MRS, J-resolved, MEGAPRESS, neurotransmission
INTRODUCTION
Glutamate (Glu) plays several crucial roles in brain function, including as the main excitatory neurotransmitter. After release into the synaptic cleft, Glu is taken up by adjacent astrocytes, converted to glutamine (Gln), shuttled to neurons, and converted back to Glu (1, 2). Activity-dependent changes in neurotransmission may affect Gln-Glu cycling rate and concentrations of Gln and Glu. Both of these metabolites can be measured using proton magnetic resonance spectroscopy (1H MRS) with the major caveat that 1H MRS measures not only synaptic but all Gln and Glu. Many previous studies have quantified Gln and Glu together in the composite measure Glx, but this carries limited utility as compared with separate Gln and Glu quantification (3–5). Given the enrichment of Gln in glia and Glu in neurons, the Gln/Glu ratio is one potentially useful index of neurotransmission. In this context, Gln/Glu elevation and reduction are thought, in part, to correlate with increased and decreased neurotransmission, respectively. Gln/Glu elevations are reported during somatosensory stimulation (6) and experimentally induced ischemia in rodents (7, 8), and with infusion of NMDA-receptor blockers phencyclidine in rodents (9) and ketamine in humans (10). Finally, blockade of Glu-to-Gln conversion in glial cells via glutamine synthetase inhibition in an animal model of amyotrophic lateral sclerosis leads to 41–48% reductions in Gln/Glu in two brain regions (11). Thus, the experimental evidence supports a role for the Gln/Glu ratio as a putative index of glutamatergic activity, although the details of its physiological determinants are not completely understood. Interpretation of changes in Gln/Glu should be approached with some caution since metabolic factors such as hyperammonemia can also modify the index. Thus, Gln/Glu alterations will be pathology- and/or activity-sensitive and changes will likely not apply in all cases or may have opposite interpretations in different pathologies.
Abnormalities in glutamatergic neurotransmission have been implicated in several psychiatric conditions including schizophrenia and mood disorders (12–16). There has been great interest in developing novel therapeutic agents that modulate the glutamate system (17, 18), or in testing existing agents with glutamatergic properties (19). In parallel with therapeutic developments, there are an increasing number of clinically-oriented in vivo neuroimaging studies focusing on glutamatergic neurotransmission. Using 1H MRS, we reported elevated Gln/Glu in anterior cingulate (ACC) and posterior cingulate (POC) cortices in bipolar mania (20), and with antidepressant treatment in bipolar depression (21). Others have reported reduced Gln/Glu in major depression (22) and elevated Gln/Glu in first-break schizophrenia in ACC (23, 24).
Disruption in glutamatergic neurotransmission is also suggested by postmortem studies of the neuronal enzyme glutaminase (which catalyzes Gln-to-Glu conversion) and the glial enzyme glutamine synthetase (which catalyzes the reverse reaction) in psychiatric conditions. Elevation in mRNA/protein levels and enzymatic activity have been reported for both glutaminase and glutamine synthetase in schizophrenia and mood disorders postmortem (25–29) and with lithium treatment (30). By contrast, glutaminase knockdown mice have 50% reduced Gln-to-Glu conversion and show 30% elevation of Gln/Glu ratios in MRS studies in frontal cortex, and 20% elevation in the hippocampus and thalamus. These mice also display a series of schizophrenia-resilience phenotypes in behavioral, pharmacologic, and neuroimaging studies (31). These findings demonstrate that interference with a key part of the synaptic glutamatergic machinery leads to concurrent changes in Gln/Glu and in CNS-related phenotypes. There are no published genetic association studies of the glutaminase gene GLS1 in bipolar disorder or major depressive disorder. One study in a Chinese population was negative for GLS1 association with schizophrenia, although this study had negative findings across the board (32). Another study found no association between GLS1 genotype and serum glutamate levels in schizophrenia patients (33).
Of the two main isoforms, the kidney-type glutaminase accounts for most brain glutaminase activity although other isoforms may also be expressed in the brain. This predominant isoform is encoded by the GLS1 gene on human chromosome 2. Glutaminase is localized on the outer face of the inner mitochondrial membrane (i.e. in the inter-membraneous space) (34) and is expressed almost exclusively in glutamatergic neurons in vivo (35). The catalytic rate of glutaminase is modulated by neuronal activity, mediated by phosphate (inhibition) and calcium (stimulation) ions (36), and is strongly inhibited by its reaction product Glu. Cytosolic variations in Glu can modulate glutaminase activity by 10-fold (35).
In this study, we sought to determine whether Gln/Glu measured using MRS is related to genetic variation at the GLS1 locus. We first used an 1H MRS dataset optimized for Gln-Glu detection obtained at our center on a 4 Tesla MR scanner (3) and largely overlapping with a previously published MRS study (20). In this primary analysis, we examined the relationship between Gln/Glu and GLS1. In a secondary dataset also overlapping with a previously published MRS study (37) which is optimized for GABA detection but nonetheless provides Gln and Glu data, we tested whether the association between Gln/Glu and GLS1 genotype observed in the primary study would replicate.
METHODS
The MRS data used in this study came from 2 separate datasets which have already been presented elsewhere (20, 37) but the use of the data is different from what was already published. Specifically, data on Gln and Glu quantification was presented in what we call Study 1 here (20) but not in what we call Study 2 here (37). Therefore, we present additional details concerning Gln and Glu quantification relevant to the current report in the Supplement. We also present example spectra used for Gln and Glu quantification in this study in Figures S1 and S2 in the Supplement. The subject genotypes and results of current MRS-genetics analyses have not been previously reported. We will describe below the details of participant composition and MRS data acquisition and analysis separately for these datasets. Study 1 used an MRS sequence optimized for detection of Gln and Glu. Therefore, we consider it the primary analysis in this work. Study 2 used an MRS sequence optimized for GABA detection. It provides Gln and Glu data which were of acceptable quality based on Cramer-Rao lower bounds and coefficients of variation but these data are likely to be of lower quality than those in Study 1. Therefore, we consider Study 2 a secondary analysis that is nonetheless of interest.
In both cases, following approval by the McLean Hospital IRB, all participants underwent two magnetic resonance imaging (MRI) scans on the same or consecutive days (depending on scanner availability): first, a structural MRI in a Siemens 3 Tesla Trio scanner (Erlangen, Germany). These scans were read by a radiologist and participants with structural abnormalities were excluded. Second, participants underwent an MRS scan on a 4 Tesla full body MR scanner (Varian/UnityInova, Varian Inc., Palo Alto, California). Blood samples were obtained from all participants as part of another IRB-approved genetics study, and further permission was obtained from the IRB to combine the MRS and genetics data in a single analysis. Because race can be an important variable in genetic analyses, we collected self-report of race from all participants and included this information as a covariate in the analyses (see Table 1).
Table 1.
Demographic information on study participants
| Group | Sex | Age | Race | |
|---|---|---|---|---|
| Study 1 | NC | 7M/2F | 40.1±10.3 | 6C; 2AfA; 1AsA |
| BD | 7M/7F | 35.6±14.5 | 11C; 3AfA; 1AsA | |
| SZ | 13M/5F | 39.8±11.1 | 14C; 3AfA; 1AsA | |
| Study 2 | NC | 7M/4F | 34.7±9.3 | 9C; 1AsA; 1AfA |
| BD | 5M/9F | 34.2±12.4 | 13C; 1AfA | |
| SZ | 7M/8F | 44.2±8.6 | 14C; 1AsA |
C=Caucasian; AfA=African American; AsA= Asian American
Study 1
The details of participant recruitment/characterization, and MRI/MRS studies (including data acquisition and analysis) for Study 1 have been described in detail previously (20). After DNA extraction and quality control, 42 had usable genetic samples; these participants were a mixture of healthy controls (N=9 out of 21 total), and participants with schizophrenia (N=18 out of 18 total) or bipolar disorder (N=15 out of 15 total). Some subjects from the prior report were excluded because we added the blood sample collection for genetic studies after they had completed the MRI/MRS study. Demographic information is presented in Table 1.
As described previously (20), data were acquired from two 2 × 2 × 2 cm midline voxels in the ACC and POC in this study. A point-resolved spectroscopy sequence (PRESS) modified for J-resolved proton MRS was used to collect 48 TE-stepped spectra with the echo time ranging from 30 msec to 500 msec in 10-msec increments; this sequence provides high quality data for resolving and quantifying Gln and Glu on our system (3). Total participant time in the scanner was 75 to 90 minutes.
All MRS data processing was blinded to diagnosis and genotype. Post-processing included zero-filling, Gaussian filtering, and Fourier transformation. The commercial spectral fitting package LCModel (version 6.0–1) was used for spectral fitting with gamma-simulated basis sets. We also carried out segmentation of T1-weighted images into grey matter (GM), white matter (WM), and cerebrospinal fluid (CSF). The Gln/Glu ratio does not require an internal reference as it is the ratio of two metabolites and not affected by between-subject variation in overall signal detection. See Supplement for additional details.
Study 2
The details of participant recruitment/characterization, and MRI/MRS studies (including data acquisition and analysis) for Study 2 have been described in detail previously (37). After DNA extraction and quality control, this study included 40 participants consisting of healthy controls (N=11 out of 19 total), and participants with schizophrenia (N=15 out of 21 total), or bipolar disorder (N=14 out of 14 total). This sample was overlapping but not identical to that in the original publication (37); some subjects from the prior report were excluded because we added the blood sample collection for genetic studies after they had completed the MRI/MRS study. Demographic information on these participants is presented in Table 1.
Data were acquired from two 23 × 22 × 33 mm midline voxels in the ACC and POC in this study. A MEGAPRESS (38) sequence was implemented for optimized GABA detection. The MEGAPRESS sequence collected two subsets of spectra: one PRESS acquisition at TE=68msec with the selective Gaussian refocusing RF pulses centered at the 1.9 ppm GABA resonance (‘on’ scan) and one with the editing RF pulses centered 20000 Hz off-resonance (‘off’ scan). The subtraction of off from on spectra reveals resolvable GABA peaks. Although this sequence is optimized for GABA detection, Gln and Glu levels can be quantified from the 68msec subspectrum within the MEGAPRESS sequence (see Supplement). Total time in the scanner was 75 to 90 minutes.
All MRS data processing was blinded to diagnosis and genotype. Post-processing included zero-filling, Gaussian filter, and Fourier transformation. The commercial spectral fitting package LCModel (version 6.0–1) was used for spectral fitting with phantom-acquired basis sets. We also carried out segmentation of T1-weighted images into grey matter (GM), white matter (WM), and cerebrospinal fluid (CSF). See Supplement for additional details.
Genetic Analyses
Genotyping was performed at the MGH Center for Human Genetic Research Psychiatric and Neurodevelopmental Genetics Unit, following approval by the McLean Hospital and Massachusetts General Hospital IRBs and transfer of frozen whole blood samples. Mass spectroscopy genotyping was performed using the Sequenom MassArray system and iPlex assay design. The major steps included the following: DNA amplification through PCR, removal of unincorporated dNTPs using shrimp alkaline phosphatase, single base extension for allele differentiation, and molecular determination through mass spectroscopy using SpectroCHIP analysis. SNPs were analyzed only if they meet the following quality control criteria: 1) >90% of attempted genotypes for any SNP successful, 2) Hardy-Weinberg equilibrium p>0.001, and 3) >1% minor allele frequency.
To select the GLS1 SNPs, we used the UCSC Genome Browser to identify the base pair region for our genes of interest (plus 10 kb on either side) and downloaded the CEPH SNP genotype data for this region from the International HapMap Project database (http://hapmap.org). To identify SNPs tagging the gene region, we uploaded the CEPH genotype data into Haploview and used the Tagger module within Haploview to run a pairwise tagging approach using an r2 threshold of 0.80 and a minor allele frequency threshold of 5%.(39). This process identified 16 tagging SNPs across the GLS1 locus, but one did not survive the quality control criteria and one had a minor allele frequency <5%. Association analyses for the 16 SNPs (rs16832963, rs7578618, rs4853750, rs3771311, rs6743496, rs13000464, rs17748089, rs13414554, rs12185688, rs6434430, rs6712504, rs10437, rs17748980, rs16824035, rs13395505, rs880253) and Gln/Glu ratios were conducted using PLINK (40) in a linear regression model with self-reported race and diagnosis as covariates. We also ran haplotype linear regression analyses testing a 4-SNP sliding window across the GLS1 gene vs. the Gln:Glu ratio for both the ACC and PCC. In the haplotype analyses race was included as covariate but diagnosis was not (because all interaction terms were negative in all of the single marker analyses). See Supplement for additional details.
RESULTS
Study 1
We describe assessments of single SNPs first followed by a sliding window haplotype analysis across GLS1. We first examined association between the 16 GLS1 SNPs and Gln/Glu for both the ACC and PCC brain regions. Using Bonferroni correction for multiple testing controlling for all of our single marker (16 SNPs) and haplotype tests (11 haplotype blocks) for two brain regions, the study-wide significant p-value was 0.05/[(16+11)×2] = 9×10⁻⁴. Four of the 16 SNPs showed nominally significant association with Gln/Glu in the ACC and five in the POC, but none of these survived correction for multiple comparisons (not shown). All of the nominally significant SNPs are intronic. In addition to our base models controlling for race, we also ran models that added diagnosis as a covariate to check for a possible interaction between diagnosis and SNP and found no significant interaction.
We next ran haplotype analyses using 4-marker sliding windows across the 16 SNPs (yielding 11 haplotype blocks). Three haplotypes comprising overlapping SNPs demonstrated association with Gln/Glu in the POC after Bonferroni correction (Table 2). The most significant haplotype (shaded in yellow) from the analysis is shown in Figure 1. For this haplotype, Beta=0.117 (i.e. a rise in Gln/Glu of 0.117 for each copy of the associated haplotype) and p=5 × 10⁻⁴. The 4-marker windows associated with Gln/Glu in the POC comprised several SNPs spanning exons 10–14 that were nominally significant in single marker analyses. Thus, it appeared that when the several nominally significant SNPs in the center of the gene are tested together as haplotypes, three displayed study-wide statistical significance in their relationship with Gln/Glu.
Table 2.
Description of haplotypes showing significant association with Gln/Glu in the POC (the full list and position of SNPs are shown in Fig 1)
| Sliding Window | Study 1 | Study 2 | ||||
|---|---|---|---|---|---|---|
| First SNP | Last SNP | Haplotype | Frequency | p | Frequency | p |
| rs3771311 | rs17748089 | T-G-C-G | 0.40 | 5 × 10⁻⁴ | 0.45 | 0.13 |
| rs6743496 | rs13414554 | G-C-G-G | 0.40 | 5 × 10⁻⁴ | 0.44 | 0.097 |
| rs13000464 | rs12185688 | C-G-G-T | 0.33 | 7 × 10⁻⁴ | 0.35 | 0.035 |
Figure 1.
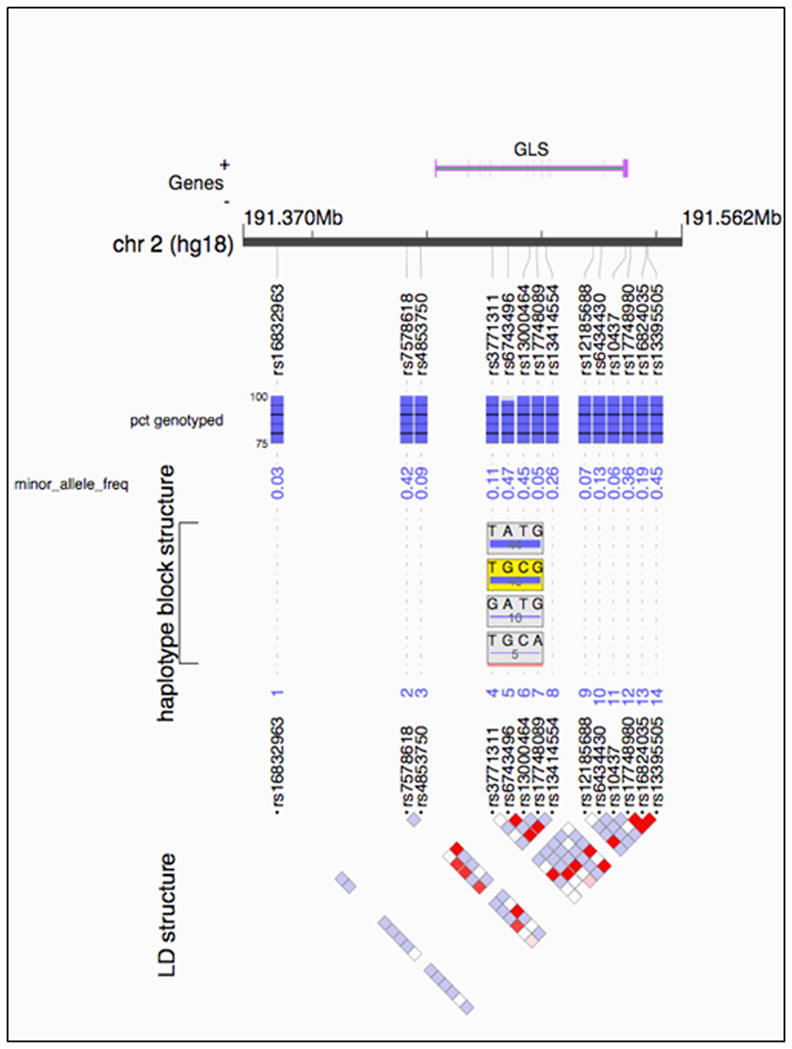
Outline of GLS1 on human chromosome 2. The very top panel shows the relevant stretch of DNA with the location of GLS1 depicted. The locations of SNPs included in the analysis are marked with “rs” identifiers. The blue bars beneath SNPs represent the percent of sample genotyped at that SNP in Study 1. The next row lists the minor allele frequency of each SNP. The haplotype block structure is shown next, with the most significant haplotype from Study 1 shaded in yellow. The bottom panel shows the linkage disequilibrium (LD) structure of the SNPs within GLS1 with red squares representing the highest degrees of LD between SNPs.
Study 2
We next turned to a second dataset in Study 2. In order to preserve statistical power, we did not carry out a SNP-based analysis in this study. Instead, this secondary analysis focused only on the three 4-SNP haplotypes with study-wide significant findings in Study 1. All SNPs in these three haplotypes passed data quality thresholds in this sample. In a linear regression model using self-reported race as a covariate, we confirmed association of one haplotype with POC Gln/Glu (Table 2). As shown in Figure 2, Gln/Glu ratio was linearly related to haplotype dose for this specific haplotype. Of note, the other two specific haplotype windows showed trends in the same direction as in Study 1 in the POC. Table 2 also shows the allele frequencies of the relevant haplotypes in both studies. The Gln/Glu ratio varied as expected in both the original and replication samples depending on whether individuals carried 0, 1, or 2 copies of the target haplotype (Figure 2). That is, individuals carrying 2 copies of the haplotype had higher Gln/Glu ratios than those carrying 1 copy, while those carrying 0 copies had the lowest Gln/Glu ratios.
Figure 2.
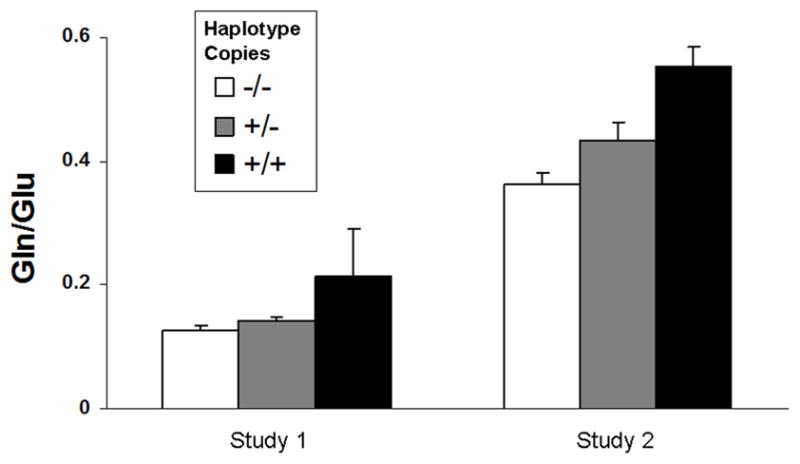
Gln/Glu ratios measured in the POC for individuals carrying 0, 1, or 2 copies of the target haplotype starting with rs13000464 and ending with rs12185688 that was found to be significant in both Study 1 and Study 2. Values are from Study 1 (left) and Study 2 (right) presented as mean ± SE. Note that mean Gln/Glu values are different across the two studies because of differences in data acquisition and analysis but the same relative pattern is observed.
DISCUSSION
Here we report the first evidence of association between genetic variants in the glutaminase gene GLS1 and brain Gln/Glu ratios measured in vivo. In a primary analysis, we observed association between three four-marker haplotypes completely spanning exons 10–14 in GLS1 and Gln/Glu ratios in the POC. In a secondary dataset, we replicated this significant association for one of the three haplotypes of interest. Our findings are particularly compelling because they relate genetic variation in a key enzyme to its substrate/product ratio. It should be noted that in vivo measures of Gln/Glu do not necessarily reflect synaptic levels of the metabolites and that non-synaptic factors (such as ammonia levels) can modify the Gln/Glu ratio.
The major limitations of this study are sample size and composition. First, both samples in the analyses included a mix of healthy participants and psychiatrically ill participants receiving pharmacotherapy; we cannot rule out medication effects or an interaction between psychiatric condition and GLS1 genotype which affected our findings. However, such heterogeneity would be expected to bias a genotype/phenotype association toward the null. When we included diagnosis as a covariate we did not detect an interaction, but this analysis was limited in power. Second, both samples were relatively small, limiting our statistical power and increasing the likelihood of Type II error. Larger studies of healthy populations and genotype x diagnosis interactions are needed to address both limitations. Third, the MRS sequence used for data collection differed between Study 1 and Study 2. Study 1 used a J-resolved MRS sequence optimized for Gln and Glu detection. This sequence attempts to address some major challenges including resolving Gln and Glu signal from underlying macromolecule resonances as well as those from glutamate-conjugate compounds such as glutathione (see Supplement). Study 2 used MEGAPRESS, a J-editing approach which is optimized for GABA detection although it does collect Gln and Glu data. The reliability of Gln and Glu detection using this approach has not been previously reported (41, 42) but we provide those data in the Supplement. Differences in quantification and analysis (e.g. percent grey matter content, signal-to-noise ratios etc.) led to differences in mean Gln/Glu ratios between the two studies (Figure 2). Although it would be desirable to collect comparable data across the two studies so they could be pooled, the fact that we detected the same genotype effect by two methods in two distinct studies is reassuring. In fact, since sources of measurement noise differ between J-resolved MRS and MEGAPRESS, we are more confident that systematic problems in MRS data acquisition and analysis across the two studies did not confound our Gln/Glu analyses.
It is notable that our findings were confined to the POC in the first study, although we studied both the POC and the ACC. In the second study we only examined the POC. A region-specific genotype effect on Gln/Glu is possible but seems unlikely. This pattern could be related to lower ACC data quality due to susceptibility artifacts. In fact, we acquired twice the number of repetitions in ACC as compared with POC in both of our studies to try to compensate for this phenomenon (20, 42). Poorer ACC data quality may lead to greater noise in the Gln/Glu measures and obscure the genotype effect. However, we did not observe higher standard deviation/mean measures in ACC vs. POC in our analysis (37% vs. 42% in Study 1 and 37% vs. 28% in Study 2 in the ACC and POC, respectively). An alternative explanation is the low power of the current study and larger studies may indeed find an ACC effect.
The relevant GLS1 variation in our study was restricted to intronic polymorphisms with no known functional significance. We did not observe significant association with the individual tagging SNPs we tested but did with haplotypes spanning exons 10–14. Thus, our results leave the identity of the causal variant(s) unclear but raise the possibility that unmeasured variants in or around exons 10–15 may underlie the associations we observed. Intronic polymorphisms have been reported to alter mRNA splicing and gene expression, potentially linking our data with the postmortem literature on abnormal glutaminase activity in psychiatric illness (25, 28). However, we do not have any direct data on glutaminase expression or activity levels and further studies will be needed to evaluate the functional relevance, if any, of the associated haplotype. In studies of the glutaminase knockdown mice a 50% reduction in protein levels led to 20–30% elevation in Gln/Glu. Therefore, we would estimate that the 50% elevation in Gln/Glu we observe using MRS corresponds to greater than a 50% reduction in protein levels due to allelic variation in GLS1. Although two previous GLS1 schizophrenia genetic association studies were negative (32, 33), only one SNP in these two studies overlaps with those tested in our dataset (rs3771311), and this SNP was not in the associated haplotype in our study.
Our findings suggest that genetic variation in a key component of the glutamatergic machinery impacts a putative in vivo index of neurotransmission. To the extent that Gln/Glu is related to the pathophysiology of mood and psychotic disorders, our results support the power of intermediate phenotypes in genetic research. Despite our limited sample size, the proximal relationship between GLS1 and Gln/Glu may have revealed an association that would have required much larger samples in studies of the relevant disorders themselves. A large literature suggests that hypofunction of the glutamatergic NMDA receptor is involved in the pathophysiology of schizophrenia. NMDA receptors are enriched on GABAergic interneurons in the cerebral cortex and NMDA hypofunction is thought to lead to pyramidal neuron disinhibition and ultimately the dysregulated information processing which characterizes schizophrenia (43, 44). These abnormalities may also lead to a neurodegenerative process in schizophrenia (45). In bipolar disorder, the literature has focused on abnormalities in glial cells which play a critical role in Glu reuptake at the synapse (46–48). Glial cell function has also been implicated in other psychiatric conditions using MRS approaches (49). In animal models, glia-specific lesions are sufficient to reproduce a depressive-like phenotype (50, 51), and this phenomenon is mediated at least in part by changes in glial Glu handling at the synapse (52). In short, systematic study of glutamatergic abnormalities may enable substantial progress in understanding the pathophysiology of both schizophrenia and bipolar disorder.
Although studying the Gln/Glu ratio has been fruitful, no experimental evidence proves that Gln/Glu directly reflects synaptic neurotransmission. Still, several lines of evidence reviewed above indicate that changes in Gln/Glu correlate with, and thus are a measure of, changes in glutamatergic activity. Our work on the effects of GLS1 variation on Gln/Glu provides additional insight into sources of Gln/Glu variation. The functional information provided by Gln/Glu may be highly relevant to the pathophysiology of mental illness. We suggest that studies using Gln/Glu may improve our understanding of glutamatergic abnormalities and treatment interventions in psychiatric conditions (21).
Supplementary Material
Acknowledgments
Funding: This study was funded by K23MH079982 (DO) from the National Institute of Mental Health, K24DA015116 (PFR), R01MH079799 (JWS), and the Shervert Frazier Research Institute at McLean Hospital (BMC). It was also sponsored in part by the Counter-Drug Technology Assessment Center, an office within the Office of National Drug Control Policy, via Contract Number DABT63-99-C awarded by the Army Contracting Agency.
Footnotes
Conflict of Interest: Dr. Renshaw is a consultant to Novartis, GlaxoSmithKline, Kyowa Hakko, and has received research support from Eli Lilly, GlaxoSmithKline, and Roche. Dr. Ongur has received free study drug from Sanofi. None of the other authors reported any biomedical financial interests or potential conflicts of interest
Publisher's Disclaimer: This is a PDF file of an unedited manuscript that has been accepted for publication. As a service to our customers we are providing this early version of the manuscript. The manuscript will undergo copyediting, typesetting, and review of the resulting proof before it is published in its final citable form. Please note that during the production process errors may be discovered which could affect the content, and all legal disclaimers that apply to the journal pertain.
References
- 1.Schousboe A, Waagepetersen HS. Role of astrocytes in glutamate homeostasis: implications for excitotoxicity. Neurotox Res. 2005;8(3–4):221–5. doi: 10.1007/BF03033975. [DOI] [PubMed] [Google Scholar]
- 2.Magistretti PJ, Pellerin L. The astrocyte-mediated coupling between synaptic activity and energy metabolism operates through volume transmission. Prog Brain Res. 2000;125:229–40. doi: 10.1016/S0079-6123(00)25013-9. [DOI] [PubMed] [Google Scholar]
- 3.Jensen JE, Licata SC, Ongur D, Friedman SD, Prescot AP, Henry ME, et al. Quantification of J-resolved proton spectra in two-dimensions with LCModel using GAMMA-simulated basis sets at 4 Tesla. NMR Biomed. 2009;22(7):762–9. doi: 10.1002/nbm.1390. [DOI] [PubMed] [Google Scholar]
- 4.Posse S, Otazo R, Caprihan A, Bustillo J, Chen H, Henry PG, et al. Proton echo-planar spectroscopic imaging of J-coupled resonances in human brain at 3 and 4 Tesla. Magn Reson Med. 2007;58(2):236–44. doi: 10.1002/mrm.21287. [DOI] [PubMed] [Google Scholar]
- 5.Schulte RF, Lange T, Beck J, Meier D, Boesiger P. Improved two-dimensional J-resolved spectroscopy. NMR Biomed. 2006;19(2):264–70. doi: 10.1002/nbm.1027. [DOI] [PubMed] [Google Scholar]
- 6.Xu S, Yang J, Li CQ, Zhu W, Shen J. Metabolic alterations in focally activated primary somatosensory cortex of alpha-chloralose-anesthetized rats measured by 1H MRS at 11.7 T. Neuroimage. 2005;28(2):401–9. doi: 10.1016/j.neuroimage.2005.06.016. [DOI] [PubMed] [Google Scholar]
- 7.Igarashi H, Kwee IL, Nakada T, Katayama Y, Terashi A. 1H magnetic resonance spectroscopic imaging of permanent focal cerebral ischemia in rat: longitudinal metabolic changes in ischemic core and rim. Brain Res. 2001;907(1–2):208–21. doi: 10.1016/s0006-8993(01)02579-3. [DOI] [PubMed] [Google Scholar]
- 8.Mlynarik V, Kohler I, Gambarota G, Vaslin A, Clarke PG, Gruetter R. Quantitative proton spectroscopic imaging of the neurochemical profile in rat brain with microliter resolution at ultra-short echo times. Magn Reson Med. 2008;59(1):52–8. doi: 10.1002/mrm.21447. [DOI] [PMC free article] [PubMed] [Google Scholar]
- 9.Iltis I, Koski DM, Eberly LE, Nelson CD, Deelchand DK, Valette J, et al. Neurochemical changes in the rat prefrontal cortex following acute phencyclidine treatment: an in vivo localized (1)H MRS study. NMR Biomed. 2009;22(7):737–44. doi: 10.1002/nbm.1385. [DOI] [PMC free article] [PubMed] [Google Scholar]
- 10.Rowland LM, Bustillo JR, Mullins PG, Jung RE, Lenroot R, Landgraf E, et al. Effects of ketamine on anterior cingulate glutamate metabolism in healthy humans: a 4-T proton MRS study. Am J Psychiatry. 2005;162(2):394–6. doi: 10.1176/appi.ajp.162.2.394. [DOI] [PubMed] [Google Scholar]
- 11.Ghoddoussi F, Galloway MP, Jambekar A, Bame M, Needleman R, Brusilow WS. Methionine sulfoximine, an inhibitor of glutamine synthetase, lowers brain glutamine and glutamate in a mouse model of ALS. J Neurol Sci. 2010 doi: 10.1016/j.jns.2009.11.013. [DOI] [PubMed] [Google Scholar]
- 12.Coyle JT. Glutamate and schizophrenia: beyond the dopamine hypothesis. Cell Mol Neurobiol. 2006;26(4–6):365–84. doi: 10.1007/s10571-006-9062-8. [DOI] [PubMed] [Google Scholar]
- 13.Krystal JH, Sanacora G, Blumberg H, Anand A, Charney DS, Marek G, et al. Glutamate and GABA systems as targets for novel antidepressant and mood-stabilizing treatments. Mol Psychiatry. 2002;7(S1):S71–80. doi: 10.1038/sj.mp.4001021. [DOI] [PubMed] [Google Scholar]
- 14.Javitt DC. Glutamate as a therapeutic target in psychiatric disorders. Mol Psychiatry. 2004;9(11):984–97. 979. doi: 10.1038/sj.mp.4001551. [DOI] [PubMed] [Google Scholar]
- 15.Zarate CA, Jr, Manji HK. Bipolar disorder: candidate drug targets. Mt Sinai J Med. 2008;75(3):226–47. doi: 10.1002/msj.20042. [DOI] [PMC free article] [PubMed] [Google Scholar]
- 16.Sanacora G, Zarate CA, Krystal JH, Manji HK. Targeting the glutamatergic system to develop novel, improved therapeutics for mood disorders. Nat Rev Drug Discov. 2008;7(5):426–37. doi: 10.1038/nrd2462. [DOI] [PMC free article] [PubMed] [Google Scholar]
- 17.Patil ST, Zhang L, Martenyi F, Lowe SL, Jackson KA, Andreev BV, et al. Activation of mGlu2/3 receptors as a new approach to treat schizophrenia: a randomized Phase 2 clinical trial. Nat Med. 2007;13(9):1102–7. doi: 10.1038/nm1632. [DOI] [PubMed] [Google Scholar]
- 18.Conn PJ, Lindsley CW, Jones CK. Activation of metabotropic glutamate receptors as a novel approach for the treatment of schizophrenia. Trends Pharmacol Sci. 2009;30(1):25–31. doi: 10.1016/j.tips.2008.10.006. [DOI] [PMC free article] [PubMed] [Google Scholar]
- 19.Zarate CA, Jr, Quiroz JA, Singh JB, Denicoff KD, De Jesus G, Luckenbaugh DA, et al. An open-label trial of the glutamate-modulating agent riluzole in combination with lithium for the treatment of bipolar depression. Biol Psychiatry. 2005;57(4):430–2. doi: 10.1016/j.biopsych.2004.11.023. [DOI] [PubMed] [Google Scholar]
- 20.Ongur D, Jensen JE, Prescot AP, Stork C, Lundy M, Cohen BM, et al. Abnormal glutamatergic neurotransmission and neuronal-glial interactions in acute mania. Biol Psychiatry. 2008;64(8):718–26. doi: 10.1016/j.biopsych.2008.05.014. [DOI] [PMC free article] [PubMed] [Google Scholar]
- 21.Brennan BP, Hudson JI, Jensen JE, McCarthy J, Roberts JL, Prescot AP, et al. Rapid enhancement of glutamatergic neurotransmission in bipolar depression following treatment with riluzole. Neuropsychopharmacology. 2010;35(3):834–46. doi: 10.1038/npp.2009.191. [DOI] [PMC free article] [PubMed] [Google Scholar]
- 22.Walter M, Henning A, Grimm S, Schulte RF, Beck J, Dydak U, et al. The relationship between aberrant neuronal activation in the pregenual anterior cingulate, altered glutamatergic metabolism, and anhedonia in major depression. Arch Gen Psychiatry. 2009;66(5):478–86. doi: 10.1001/archgenpsychiatry.2009.39. [DOI] [PubMed] [Google Scholar]
- 23.Theberge J, Bartha R, Drost DJ, Menon RS, Malla A, Takhar J, et al. Glutamate and glutamine measured with 4.0 T proton MRS in never-treated patients with schizophrenia and healthy volunteers. Am J Psychiatry. 2002;159(11):1944–6. doi: 10.1176/appi.ajp.159.11.1944. [DOI] [PubMed] [Google Scholar]
- 24.Bustillo JR, Rowland LM, Mullins P, Jung R, Chen H, Qualls C, et al. (1)H-MRS at 4 Tesla in minimally treated early schizophrenia. Mol Psychiatry. 2009 doi: 10.1038/mp.2009.121. [DOI] [PMC free article] [PubMed] [Google Scholar]
- 25.Gluck MR, Thomas RG, Davis KL, Haroutunian V. Implications for altered glutamate and GABA metabolism in the dorsolateral prefrontal cortex of aged schizophrenic patients. Am J Psychiatry. 2002;159(7):1165–73. doi: 10.1176/appi.ajp.159.7.1165. [DOI] [PubMed] [Google Scholar]
- 26.Choudary PV, Molnar M, Evans SJ, Tomita H, Li JZ, Vawter MP, et al. Altered cortical glutamatergic and GABAergic signal transmission with glial involvement in depression. Proc Natl Acad Sci U S A. 2005;102(43):15653–8. doi: 10.1073/pnas.0507901102. [DOI] [PMC free article] [PubMed] [Google Scholar]
- 27.Bruneau EG, McCullumsmith RE, Haroutunian V, Davis KL, Meador-Woodruff JH. Increased expression of glutaminase and glutamine synthetase mRNA in the thalamus in schizophrenia. Schizophr Res. 2005;75(1):27–34. doi: 10.1016/j.schres.2004.12.012. [DOI] [PubMed] [Google Scholar]
- 28.Sequeira A, Mamdani F, Ernst C, Vawter MP, Bunney WE, Lebel V, et al. Global brain gene expression analysis links glutamatergic and GABAergic alterations to suicide and major depression. PLoS One. 2009;4(8):e6585. doi: 10.1371/journal.pone.0006585. [DOI] [PMC free article] [PubMed] [Google Scholar]
- 29.Sequeira A, Turecki G. Genome wide gene expression studies in mood disorders. Omics. 2006;10(4):444–54. doi: 10.1089/omi.2006.10.444. [DOI] [PubMed] [Google Scholar]
- 30.Marcus SR, Nadiger HA, Chandrakala MV, Rao TI, Sadasivudu B. Acute and short-term effects of lithium on glutamate metabolism in rat brain. Biochem Pharmacol. 1986;35(3):365–9. doi: 10.1016/0006-2952(86)90206-6. [DOI] [PubMed] [Google Scholar]
- 31.Gaisler-Salomon I, Miller GM, Chuhma N, Lee S, Zhang H, Ghoddoussi F, et al. Glutaminase-deficient mice display hippocampal hypoactivity, insensitivity to pro-psychotic drugs and potentiated latent inhibition: relevance to schizophrenia. Neuropsychopharmacology. 2009;34(10):2305–22. doi: 10.1038/npp.2009.58. [DOI] [PMC free article] [PubMed] [Google Scholar]
- 32.Zhang B, Yuan Y, Jia Y, Yu X, Xu Q, Shen Y, et al. An association study between polymorphisms in five genes in glutamate and GABA pathway and paranoid schizophrenia. Eur Psychiatry. 2005;20(1):45–9. doi: 10.1016/j.eurpsy.2004.09.028. [DOI] [PubMed] [Google Scholar]
- 33.Maeshima H, Ohnuma T, Sakai Y, Shibata N, Baba H, Ihara H, et al. Increased plasma glutamate by antipsychotic medication and its relationship to glutaminase 1 and 2 genotypes in schizophrenia -- Juntendo University Schizophrenia Projects (JUSP) Prog Neuropsychopharmacol Biol Psychiatry. 2007;31(7):1410–8. doi: 10.1016/j.pnpbp.2007.06.009. [DOI] [PubMed] [Google Scholar]
- 34.Marquez J, Tosina M, de la Rosa V, Segura JA, Alonso FJ, Mates JM, et al. New insights into brain glutaminases: beyond their role on glutamatergic transmission. Neurochem Int. 2009;55(1–3):64–70. doi: 10.1016/j.neuint.2009.02.022. [DOI] [PubMed] [Google Scholar]
- 35.Kvamme E, Roberg B, Torgner IA. Phosphate-activated glutaminase and mitochondrial glutamine transport in the brain. Neurochem Res. 2000;25(9–10):1407–19. doi: 10.1023/a:1007668801570. [DOI] [PubMed] [Google Scholar]
- 36.Curthoys NP, Watford M. Regulation of glutaminase activity and glutamine metabolism. Annu Rev Nutr. 1995;15:133–59. doi: 10.1146/annurev.nu.15.070195.001025. [DOI] [PubMed] [Google Scholar]
- 37.Ongur D, Prescot AP, McCarthy J, Cohen BM, Renshaw PF. Elevated gamma-aminobutyric acid levels in chronic schizophrenia. Biol Psychiatry. 2010;68(7):667–70. doi: 10.1016/j.biopsych.2010.05.016. [DOI] [PMC free article] [PubMed] [Google Scholar]
- 38.Mescher M, Merkle H, Kirsch J, Garwood M, Gruetter R. Simultaneous in vivo spectral editing and water suppression. NMR Biomed. 1998;11(6):266–72. doi: 10.1002/(sici)1099-1492(199810)11:6<266::aid-nbm530>3.0.co;2-j. [DOI] [PubMed] [Google Scholar]
- 39.de Bakker PI, Yelensky R, Pe’er I, Gabriel SB, Daly MJ, Altshuler D. Efficiency and power in genetic association studies. Nat Genet. 2005;37(11):1217–23. doi: 10.1038/ng1669. [DOI] [PubMed] [Google Scholar]
- 40.Purcell S, Neale B, Todd-Brown K, Thomas L, Ferreira MA, Bender D, et al. PLINK: a tool set for whole-genome association and population-based linkage analyses. Am J Hum Genet. 2007;81(3):559–75. doi: 10.1086/519795. [DOI] [PMC free article] [PubMed] [Google Scholar]
- 41.Sanacora G, Gueorguieva R, Epperson CN, Wu YT, Appel M, Rothman DL, et al. Subtype-specific alterations of gamma-aminobutyric acid and glutamate in patients with major depression. Arch Gen Psychiatry. 2004;61(7):705–13. doi: 10.1001/archpsyc.61.7.705. [DOI] [PubMed] [Google Scholar]
- 42.Ongur D, Prescot A, McCarthy JM, Cohen BM, Renshaw PF. Elevated gamma-aminobutyric acid levels in chronic schizophrenia. Biological Psychiatry. 2010 doi: 10.1016/j.biopsych.2010.05.016. In press. [DOI] [PMC free article] [PubMed] [Google Scholar]
- 43.Woo TU, Walsh JP, Benes FM. Density of glutamic acid decarboxylase 67 messenger RNA-containing neurons that express the N-methyl-D-aspartate receptor subunit NR2A in the anterior cingulate cortex in schizophrenia and bipolar disorder. Arch Gen Psychiatry. 2004;61(7):649–57. doi: 10.1001/archpsyc.61.7.649. [DOI] [PubMed] [Google Scholar]
- 44.Lisman JE, Coyle JT, Green RW, Javitt DC, Benes FM, Heckers S, et al. Circuit-based framework for understanding neurotransmitter and risk gene interactions in schizophrenia. Trends Neurosci. 2008;31(5):234–42. doi: 10.1016/j.tins.2008.02.005. [DOI] [PMC free article] [PubMed] [Google Scholar]
- 45.Theberge J, Williamson KE, Aoyama N, Drost DJ, Manchanda R, Malla AK, et al. Longitudinal grey-matter and glutamatergic losses in first-episode schizophrenia. British Journal of Psychiatry. 2007;191:325–34. doi: 10.1192/bjp.bp.106.033670. [DOI] [PubMed] [Google Scholar]
- 46.Öngür D, Drevets WC, Price JL. Glial reduction in the subgenual prefrontal cortex in mood disorders. Proc Natl Acad Sci U S A. 1998;95(22):13290–5. doi: 10.1073/pnas.95.22.13290. [DOI] [PMC free article] [PubMed] [Google Scholar]
- 47.Cotter DR, Pariante CM, Everall IP. Glial cell abnormalities in major psychiatric disorders: the evidence and implications. Brain Res Bull. 2001;55(5):585–95. doi: 10.1016/s0361-9230(01)00527-5. [DOI] [PubMed] [Google Scholar]
- 48.Rajkowska G, Halaris A, Selemon LD. Reductions in neuronal and glial density characterize the dorsolateral prefrontal cortex in bipolar disorder. Biol Psychiatry. 2001;49(9):741–52. doi: 10.1016/s0006-3223(01)01080-0. [DOI] [PubMed] [Google Scholar]
- 49.Sailasuta N, Abulseoud O, Harris KC, Ross BD. Glial dysfunction in abstinent methamphetamine abusers. J Cereb Blood Flow Metab. 2009;30(5):950–60. doi: 10.1038/jcbfm.2009.261. [DOI] [PMC free article] [PubMed] [Google Scholar]
- 50.Banasr M, Duman RS. Glial loss in the prefrontal cortex is sufficient to induce depressive-like behaviors. Biol Psychiatry. 2008;64(10):863–70. doi: 10.1016/j.biopsych.2008.06.008. [DOI] [PMC free article] [PubMed] [Google Scholar]
- 51.Bechtholt-Gompf AJ, Walther HV, Adams MA, Carlezon WA, Öngür D, Cohen BM. Blockade of astrocytic glutamate uptake in rats induces signs of anhedonia without dysphoria and impaired spatial memory. Neuropsychopharmacology. 2010 doi: 10.1038/npp.2010.74. In press. [DOI] [PMC free article] [PubMed] [Google Scholar]
- 52.Banasr M, Chowdhury GM, Terwilliger R, Newton SS, Duman RS, Behar KL, et al. Glial pathology in an animal model of depression: reversal of stress-induced cellular, metabolic and behavioral deficits by the glutamate-modulating drug riluzole. Mol Psychiatry. 2008;15(5):501–11. doi: 10.1038/mp.2008.106. [DOI] [PMC free article] [PubMed] [Google Scholar]
Associated Data
This section collects any data citations, data availability statements, or supplementary materials included in this article.