Abstract
This study examines the differential activities between wild-type Hepatitis B virus X protein (WtHBx) and a mutant HBx (MutHBx), which bears a hotspot mutation at nucleotides 1762 and 1764, resulting in a lysine to methionine change at codon 130 and a valine to isoleucine change at codon 131. This mutation leads to hepatocellular carcinoma, and we evaluated how WtHBx and MutHBx proteins differ in their interactions with the p53 tumor suppressor protein. This was experimentally addressed through co-immunoprecipitation assays examining the interaction between WtHBx and MutHBx proteins with p53, reporter assays determining the impact of the HBx proteins on p53-mediated gene transcription, and clonogenic survival assays evaluating the effect of HBx on cell growth in lines of varying p53-expression status.
Both WtHBx and MutHBx proteins physically interact with p53 protein, but have different impacts on p53-mediated gene transcription. WtHBx did not effect p53-mediated gene transcription, whereas MutHBx inhibited it (p<0.01). MutHBx inhibited colony formation in p53-proficient cells (p<0.01), but not p53-deficient lines. Although both HBx proteins interact with p53, they affect p53-mediated gene transcription differently. WtHBx has no effect, whereas MutHBx inhibits it. In clonogenic survival assays, MutHBx inhibited cell growth in p53-proficient cells rather than enhanced it. This suggests that for MutHBx to behave oncogenically, the p53 pathway must be crippled or absent. This study has identified some important novel ways in which WtHBx and MutHBx differentially interact with p53 and this could begin to form the cellular explanation for the association between this particular mutant and liver cancer.
Keywords: Hepatitis B virus, Hepatitis B virus X protein, p53, hepatocellular carcinoma, risk factor
INTRODUCTION
Liver cancer, specifically hepatocellular carcinoma (HCC), is the fifth most common cancer in males and the eighth most common cancer diagnosed in females worldwide.[1] Chronic infection with hepatitis B virus (HBV) is a primary risk factor for HCC development.[2] Although chronic infection with HBV is a known cause of HCC, the precise mechanisms of HBV-induced carcinogenesis remain to be elucidated. Many research teams have focused attention on the oncogenic properties of the hepatitis B virus X gene (HBx) and several studies have shown that the HBx protein physically interacts with the p53 tumor suppressor protein and this interaction results in a sequestration of p53 in the cytoplasm.[3–6] The complexing of HBx and p53 has been linked with a decrease in p53-mediated gene transcription and p53-dependent apoptosis.[7–9] There are data showing that p53 is inactivated by HBx in transgenic mice and this inactivation is a major factor contributing to hepatocarcinogenesis in this rodent model.[10] Since the absence of functional p53 whether by mutations or inactivation has been observed in many human cancers, this HBx protein effect could be important in HCC pathogenesis.[11]
Chronic HBV infection and altered p53 status are both risk factors contributing to the development of HCC, and an underlying mechanism could be the occurrence of mutations within the HBV genome following hepatocyte integration. One hotspot mutation involves an adenine to thymine transversion at nucleotide 1762, and a guanine to adenine transition at nucleotide 1764 of the viral genome, and both mutations fall within the X gene (A1762T/G1764A). A variety of epidemiologic studies have shown that the detection of this mutation in serum DNA confers an increased risk for the development of HCC compared to those individuals that do not have this mutation. Population studies reveal a geographic specificity for this associated risk; those infected with HBV genotype C (the common genotype of HBV infection in Southeast Asia, China, Japan, Korea and Polynesia) harboring the double mutation have the highest risk of HCC development.[12–15]
Experimentally, the expression of HBx protein with the amino acid changes encoded by this double mutation (MutHBx) in in vitro systems has been linked with an increase in HBV viral load.[16,17] It has also been shown that MutHBx interacts with hepatocyte nuclear factors 1 and 4, which in turn regulates HBV core promoter activity.[18] Outside of these studies however, a comprehensive understanding of the differences in function between wild-type HBx (WtHBx) and MutHBx remains to be elucidated. Prior studies revealed that the C-terminal region of HBx, specifically amino acids 102–136, are important for the interaction with p53.[19] This observation is of particular interest to our investigation since the A1762T/G1764A double mutation impacts amino acids 130 and 131 of HBx, causing a lysine to methionine change at amino acid 130 and a valine to isoleucine change at amino acid 131. Any potential interaction between MutHBx and p53 and the resulting implications has not been identified to date. We sought to evaluate whether the adverse risk associated with the double mutation occurrence in human epidemiologic studies is based, in part, upon differential interactions between WtHBx and p53 and MutHBx and p53. To examine this biological process, we evaluated whether or not MutHBx interacts with p53, whether WtHBx and MutHBx differ in ability to impact p53 transcriptional activity or to stabilize p53, and whether WtHBx and MutHBx differ in ability to impact cell growth.
MATERIALS AND METHODS
Plasmid Construction and Site-Directed Mutagenesis
WtHBx expression plasmid pTracer-WtHBx was first prepared by inserting the entire WtHBx sequence (HBV nucleotides 1374–1839) between the KpnI and XbaI sites of pTracer-EF/Bsd A (Invitrogen, Carlsbad, CA). Template HBV DNA for the preparation of pTracer-WtHBx was obtained from HepG2 2.2.15 cells, a line stably expressing full-length wild-type HBV and developed by Dr. George Acs [20], which were a gift from Dr. Timothy Block of the Drexel University College of Medicine. Site-directed mutagenesis was then performed on pTracer-WtHBx using mutagenic primers and the QuickChange Site-Directed Mutagenesis Kit (Stratagene, La Jolla, CA), ultimately creating pTracer-MutHBx, which harbors the naturally occurring HBx double mutation A1762T/G1764A. Sequencing analysis was performed by the Johns Hopkins Core DNA Analysis Facility to confirm these outcomes.
Cell Culture
HEK 293 cells (ATCC, Manassas, VA) were cultured in MEM α (Invitrogen) containing 10% fetal bovine serum and 1x penicillin-streptomycin. HepG2-p53si cells were a gift from Dr. Andrei Gartel of the University of Illinois at Chicago, and are cells of a HepG2 background with p53 stably knocked down.[21] HepG2 and HepG2-p53si human HCC cell lines were cultured in MEM (Mediatech, Inc., Manassas, VA) containing 10% fetal bovine serum and 1x penicillin-streptomycin (Invitrogen). Hep3B human HCC cells were cultured in MEM containing 1mM sodium pyruvate (Sigma, St. Louis, MO) and 10% fetal bovine serum. All cells were maintained in a humidified incubator at 37°C with 5% CO2.
Co-immunoprecipitation
HEK 293 cells were plated in 6-well plates (300,000 cells/well). After overnight attachment, cells were co-transfected with 5 μg of either WtHBx or MutHBx or empty vector pTracer (mock) and 5 μg of p53 expression plasmid (OriGene, Rockville, MD) per well in Lipofectamine PLUS reagents (Invitrogen). Forty-eight hours after transfection, cells were washed, scraped and lysed in a total volume of 300 μL
Radioimmunoprecipitation Assay buffer (50mM Tris-HCl at pH 8.0, 150mM NaCl, 1% NP-40, 0.5% sodium deoxycholate, 0.1% sodium dodecyl sulfate) with 1x final protease inhibitor (Roche, Indianapolis, IN) and phosphatase inhibitor cocktail (Sigma, St. Louis, MO). Cell lysates were centrifuged for 20 minutes at 13,400g and then pre-cleared with Protein G Sepharose beads (GE Healthcare Life Sciences, Piscataway, NJ) masked with 1% albumin from bovine serum (Sigma, St. Louis, MO). Input protein amount was checked using 40 μL supernatant, and the remaining sample was used for immunoprecipitation. Immunoprecipitation was performed using 3 μg primary anti-human Hepatitis B Virus X antigen polyclonal IgG (Abcam, Cambridge, MA) and 100 μL Protein G bead slurry per sample lysate. The reverse immunoprecipitation was performed as well, using 3 μg primary anti-human p53 monoclonal IgG (Santa Cruz Biotechnology, Inc., Santa Cruz, CA). This antibody recognizes the N-terminal epitope of p53, mapping between amino acid residues 11–25 of p53 of human origin. HCT 116 (p53 null) cell lysates were used as negative controls for immunoprecipitation due to their lack of both basal p53 and HBx expression. These HCT 116 cells were a gift from Dr. Bert Vogelstein of the Johns Hopkins School of Medicine.[22] Precipitates and control beads were washed five times in lysis buffer, subjected to sodium dodecyl sulfate-polyacrylamide gel electrophoresis (SDS-PAGE), transferred onto nitrocellulose membranes (Bio-Rad Laboratories, Hercules, CA), probed with the appropriate antibody and subsequently detected by chemiluminescent ECL kit (GE Healthcare Life Sciences).
Luciferase Assays
HepG2-p53si cells were plated in 6-well plates (500,000 cells/well). After overnight attachment, cells were co-transfected with 1 μg of either WtHBx, MutHBx or mock plasmid, 0.5 μg p53 promoter-driven luciferase plasmid (Panomics, Fremont, CA), 50ng pGL4.70 (hRluc) plasmid (Promega, Madison, WI) and 100ng p53 expression plasmid as indicated using Lipofectamine PLUS reagents. Forty-eight hours after transfection, cells were lysed, collected and analyzed using the Dual-Luciferase Reporter Assay System (Promega). Cells were rinsed and lysed in 300 μL final 1x Passive Lysis Buffer. 10 μL of cell lysate was used to determine cellular enzymatic activities of both firefly and Renilla luciferase, which were measured sequentially using a Turner Designs 20/20 Luminometer (Turner BioSystems, Sunnyvale, CA). The Renilla luciferase activity provided an internal control to account for transfection efficiency and cell number variance. Firefly luciferase activity was normalized to Renilla luciferase activity for each sample. Luciferase assays were conducted for each of three independent experiments and within each experiment, each sample was monitored in duplicate for firefly and Renilla luciferase enzyme activity. Mean values from these independent experiments were statistically analyzed by two-way ANOVA followed with the Student Newman-Keuls test.
Western Blotting Analysis
Cells were trypsinized, collected, pelleted and resuspended in 4% SDS, supplemented with protease and phosphatase inhibitors. Cell lysates were homogenized using QIAshredder (Qiagen, Valencia, CA). Protein concentrations of cell lysates were measured using a bicinchoninic acid (BCA) protein assay kit (Pierce Biotechnology, Rockford, IL). 30 μg of cell lysates were separated by SDS-PAGE and transferred onto a nitrocellulose membrane. Western blotting was performed with primary anti-human Hepatitis B Virus X antigen polyclonal IgG (Abcam), primary anti-human p53 monoclonal IgG (Santa Cruz Biotechnology, Inc.), primary anti-human p53 (phospho S15) polyclonal IgG (Abcam) or primary anti-human β-actin polyclonal IgG (Abcam) where appropriate, and secondary anti-rabbit horseradish peroxidase (HRP)-linked antibody (GE Healthcare Life Sciences) and subsequently detected by chemiluminescent ECL kit (GE Healthcare Life Sciences), as recommended by the manufacturer.
Colony Formation Assays
HepG2, HepG2-p53si and Hep3B cells were transfected with 5 μg of either WtHBx, MutHBx or mock plasmid per 6cm dish in GeneJuice Transfection Reagent (EMD Biosciences, San Diego, CA). Twenty-four hours after transfection, cells were transferred to 10cm dishes (4 dishes per plasmid construct) and seeded sparsely at a 1:100 cell dilution. Forty-eight hours after transfection, cells were introduced to selection media containing blasticidin (Invitrogen). Cells were maintained in a blasticidin concentration of 1 μg/mL. Cell culture medium was replaced 2–3 times weekly until colonies formed; this was a total of 3 weeks post-transfection. Drug-resistant colonies were fixed in formaldehyde, stained with 0.05% toluidine blue and then counted manually. Three independent transfections were performed per construct per cell type and the mean values for comparable groups from these independent experiments were then statistically analyzed with two-way ANOVA followed with the Student Newman-Keuls test.
RESULTS
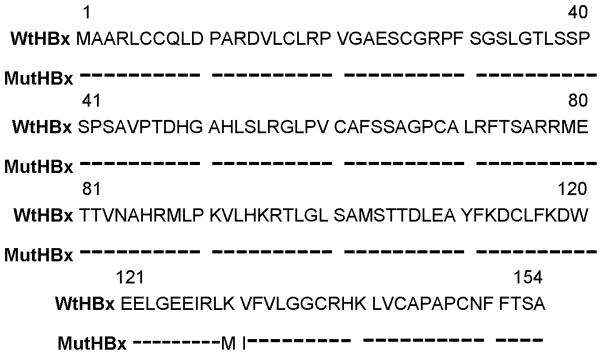
The WtHBx expression plasmid used in the following investigation is identical to the HBx sequence from HBV subtype, ayw.[23] Figure 1 depicts the amino acid sequence of WtHBx, subtype ayw, and indicates the sole two amino acid changes that produce the MutHBx protein.
Figure 1.
Amino acid alignment of HBx protein based on nucleotide sequence analysis of WtHBx and MutHBx. Only the two amino acid differences resulting from the A1762T/G1764A base mutations which distinguish MutHBx from WtHBx are indicated.
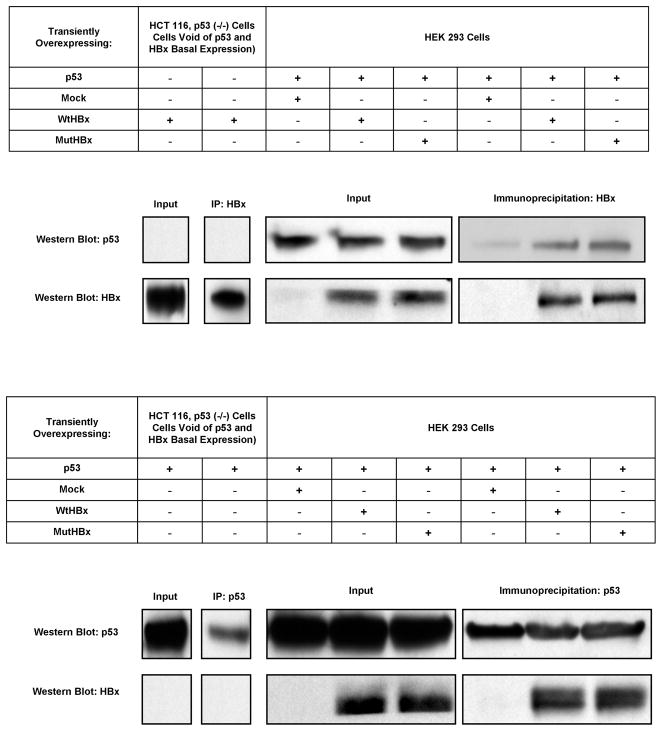
Since prior research had found that WtHBx physically interacts with p53 protein; initial experiments were conducted to determine if MutHBx also stably complexes with p53. The interaction between both WtHBx with p53 and MutHBx with p53 was evaluated using a co-immunoprecipitation experimental strategy. Figures 2A–B display the co-immunoprecipitation and also reverse co-immunoprecipitation, and reveal that MutHBx does interact with p53 protein. These findings also reproduced the findings showing interaction between WtHBx and p53 [3,24]. Although this was not a quantitative method to evaluate protein interaction, the results suggest that there was no significant difference in binding affinity between WtHBx and p53 and MutHBx and p53. HCT 116, p53 (−/−) cells transfected with either WtHBx or p53 for the co-immunoprecipitation and reverse co-immunoprecipitation, respectively, were used as assay negative controls.
Figure 2.
Figure 2A. Both WtHBx and MutHBx proteins bind to p53 protein. HEK 293 cells were transiently co-transfected with 5 μg p53 expression plasmid and 5 μg either mock (empty pTracer plasmid), WtHBx or MutHBx plasmid. Cells were lysed 48 hours post-transfection. HCT 116, p53 (−/−) cell lysates were used as negative controls due to their lack of both basal p53 and HBx expression. Lysates were immunoprecipitated with anti-HBx antibody and then subjected to SDS-PAGE and Western blot with anti-p53 antibody. Protein inputs to immunoprecipitation as well as immunoprecipitates are shown.
Figure 2B. Reverse co-immunoprecipitation confirms that both WtHBx and MutHBx proteins bind to p53 protein. HEK 293 cell lysates were immunoprecipitated with anti-p53 antibody and then subjected to SDS-PAGE and Western blot with anti-HBx antibody.
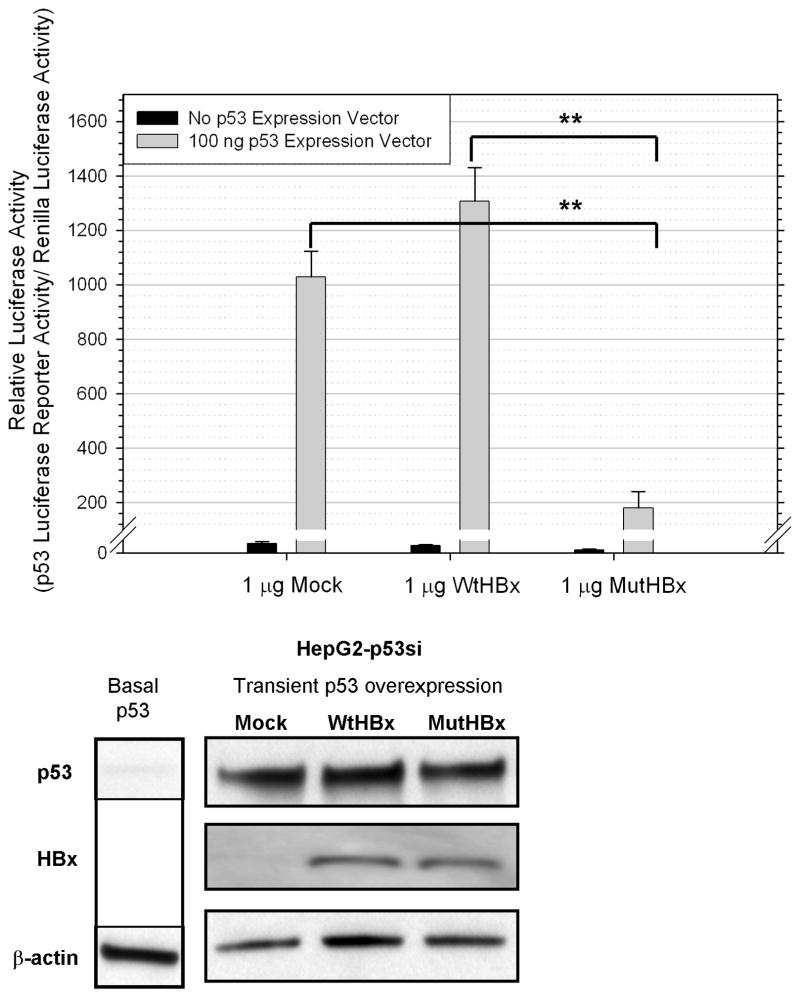
Building upon the findings that both WtHBx and MutHBx interact with p53, experiments were conducted to examine whether there was a functional difference between the two interactions and p53 transcriptional activity. This was evaluated by conducting luciferase reporter assays utilizing a reporter plasmid containing the basal p53 promoter sequence. For these experiments, a p53 knockdown HepG2-p53si cell line was used. Initial experiments were conducted to gauge the appropriate ratios of the expression vectors and luciferase reporters to deliver to the cells. Once optimized, it was found that MutHBx did inhibit p53-mediated gene transcription, while WtHBx did not. These results are depicted in Figure 3A. Possible dose-response patterns in HBx expression and impact on p53-mediated gene transcription were also studied; however, delivery of 2 μg of HBx or more proved to be highly toxic to the cells. There were no statistically significant differences in p53-mediated gene transcription when comparing the delivery of 0.5 μg and 1 μg HBx plasmid to the cells. At these transfection amounts of WtHBx, there is still no significant difference in p53-mediated gene transcription when compared with the mock treatment, and at these transfection levels of MutHBx, there remained an inhibition of p53-mediated gene transcription. Included in Figure 3B are Western blotting results showing both p53 and HBx expression in HepG2-p53si cells 48 hours post-transfection, which is the time course of the luciferase reporter assays. These data show that the siRNA construct produced by the HepG2-p53si cells does not abolish p53 expression from the transfected plasmid. Figure 3B also shows that neither WtHBx nor MutHBx impact p53 protein expression.
Figure 3.
Figure 3A. Inhibition of p53-mediated transcriptional activity by MutHBx but not WtHBx. Luciferase reporter activity assays were conducted in HepG2-p53si cells. 100ng p53 expression plasmid/mL and 1 μg either mock, WtHBx or MutHBx/mL were transiently co-expressed in the cells 48 hours prior to lysate collection and assaying. Results shown represent mean values from three independent experiments and bars indicate standard error of the mean. **p < 0.01.
Figure 3B. siRNA construct produced in HepG2-p53si cells does not abolish expression of p53 delivered to the cells, nor does HBx expression impact p53 expression. Protein expression of p53 and HBx is displayed at 48 hours post-transfection, which is the time course for the luciferase reporter assays conducted. β-actin expression was monitored as a loading control.
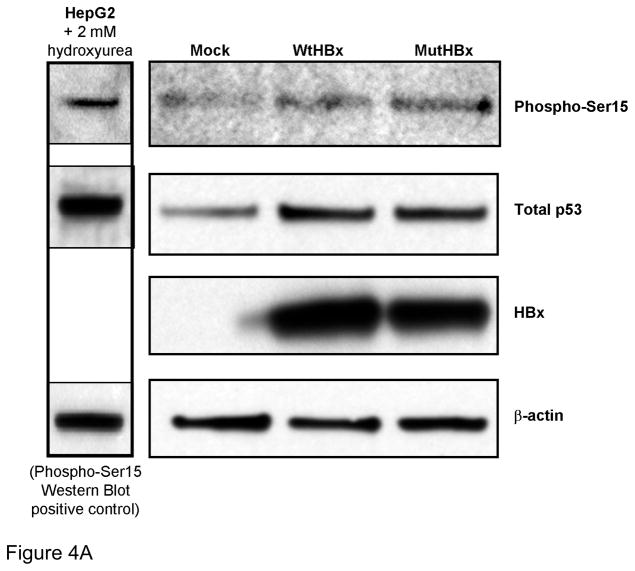
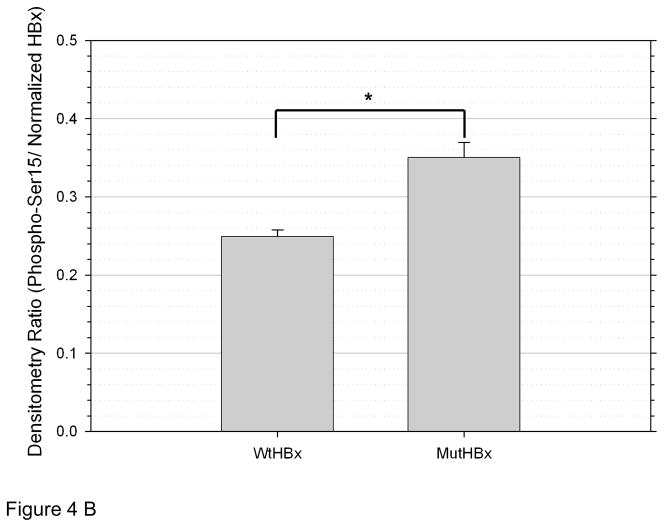
To determine whether WtHBx and MutHBx differentially impact p53 stabilization, phosphorylation of Serine 15 on p53 (phospho-Ser15) was examined. This phosphorylation site is necessary, but not entirely sufficient for p53 activation and subsequent p53-dependent halt of the cell cycle.[25,26] The results from this experiment are shown in Figures 4A and 4B. A statistically significantly higher level of p53 phosphorylation is associated with MutHBx expression than with WtHBx expression.
Figure 4.
Figure 4A. Both WtHBx and MutHBx expression result in increased serine 15 phosphorylation of p53 (phospho-Ser15). 1.67 μg p53/mL and 1.67 μg either mock, WtHBx or MutHBx/mL were transiently co-expressed in HepG2-p53si cells 48 hours prior to total cell lysate collection, SDS-PAGE and Western blot analysis. Representative results from three independent transfection experiments are shown.
Figure 4B. MutHBx expression is associated with an increase in phospho-Ser15 compared to WtHBx expression. Densitometry was performed on phospho-Ser15 from Western blots in each of three independent transfection experiments. Values shown here are normalized to HBx/β-actin densitometry ratios (HBx densitometry value normalized to that β-actin loading control) as loading, transfection and protein expression controls. Bars indicate standard error of the mean. *p < 0.05.
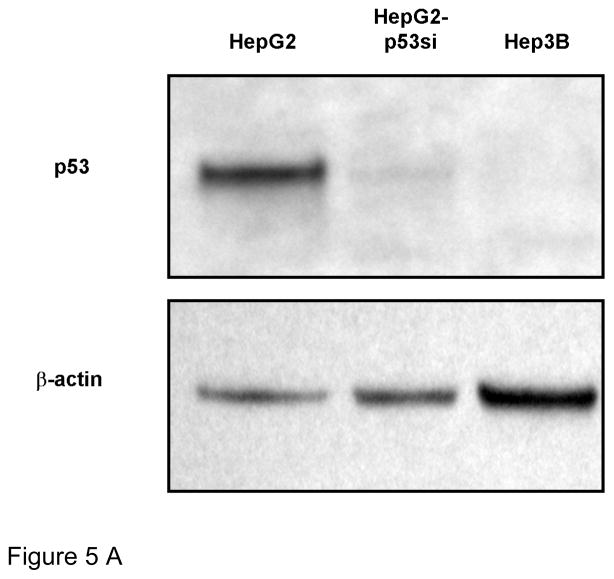
The marked difference in impact between WtHBx and MutHBx interaction with p53 and subsequent transcriptional activity led to the exploration of the impact each protein had on cell growth. To test this, clonogenic survival assays, which measured the reproductive capability of cells expressing WtHBx compared to MutHBx, were conducted. A variety of cell lines either proficient or deficient in p53 expression were utilized in order to determine the dependence of cell growth on the presence of the p53 pathway. Figure 5A shows the background p53 expression status of each of the cell lines utilized in the clonogenic survival assays. HepG2, HepG2-p53si and Hep3B cells are HCC cell lines that express wild-type p53, have a stable knockdown of p53, or do not express p53 at all, respectively. The HepG2-p53si cell line maintained at least a 90% knockdown of p53 expression relative to HepG2 cells.
Figure 5.
Figure 5A. Basal p53 expression status of each cell line used in clonogenicity assays. HepG2 cells are p53-proficient, while HepG2-p53si and Hep3B cells are p53-deficient. Lysates from each cell type were collected and analyzed by SDS-PAGE and Western blot using anti-p53 antibody and anti-β-actin as a loading control.
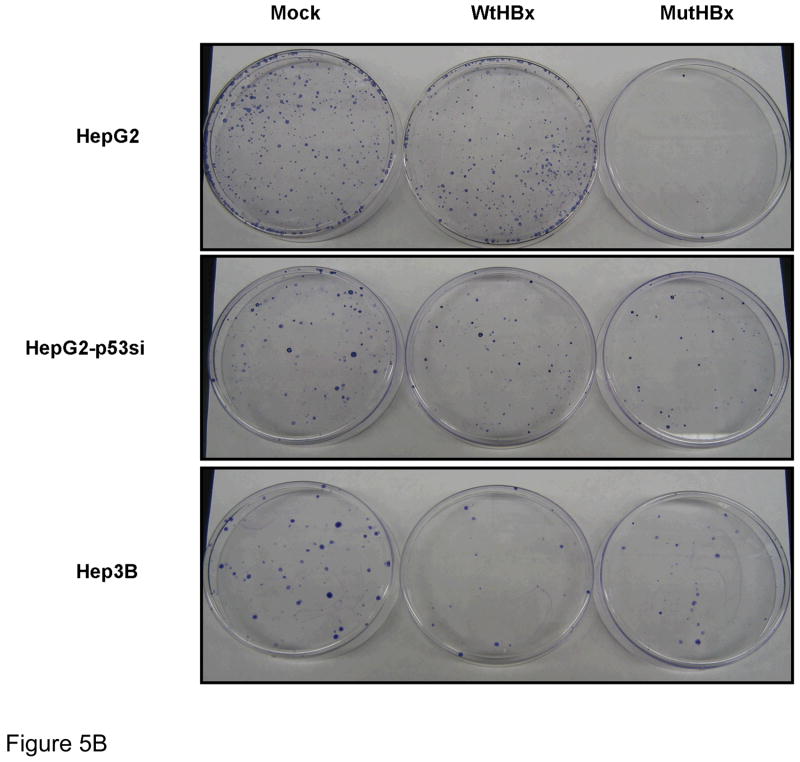
Figure 5B. Representative examples of colony formation across various cell lines for each plasmid construct utilized- mock, WtHBx and MutHBx, respectively. HepG2 cells are p53-proficient and HepG2-p53si and Hep3B cell lines are p53-deficient. Cells were transfected with 1.25 μg either mock, WtHBx or MutHBx/mL.
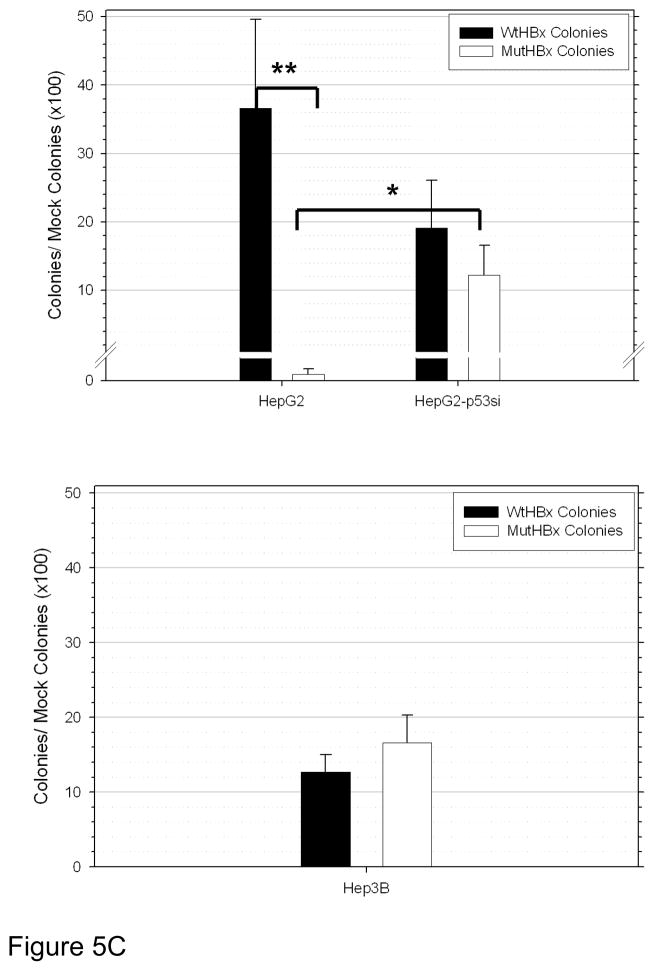
Figure 5C. Enhanced growth suppressive effect of MutHBx colonies compared to WtHBx colonies in p53-proficient hepatocellular carcinoma cells (HepG2) only. Results shown represent mean values from three independent experiments and bars indicate standard error of the mean. *p < 0.05; **p < 0.01.
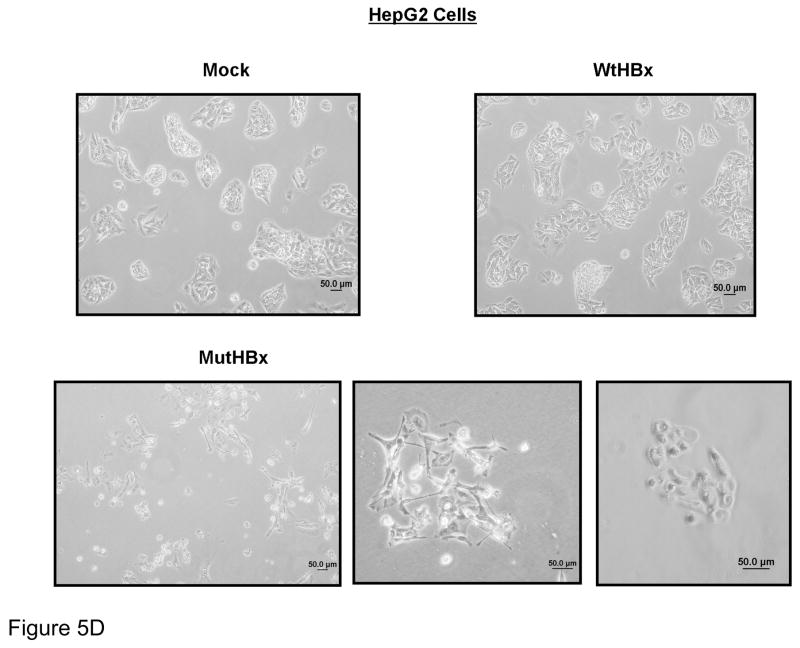
Figure 5D. Unique splayed morphology of apparently dormant HepG2 cells expressing MutHBx. Cell morphology images of liver cell colonies taken 2 weeks into clonogenicity assay when colony formation in mock and WtHBx-transfected cells was well underway.
Representative results from the clonogenic survival assays are reproduced in Figure 5B. Quantitative results from these experiments are shown in Figure 5C. MutHBx was demonstrated to dramatically inhibit clonogenic survival in p53-proficient HepG2 cells. This effect was unique to MutHBx expression in HepG2 cells. There was no statistically significant difference in colony formation between WtHBx and MutHBx groups in the p53-deficient HepG2-p53si and Hep3B cell lines. It was noted that both WtHBx and MutHBx expression, regardless of p53 status, resulted in a decrease in cell survival relative to mock controls. Since HBx expression produces fewer cell colonies than controls in clonogenic survival assays these findings were consistent with prior studies.[27,28]
The abolition of clonogenic survival in HepG2 cells expressing MutHBx was striking, and additional images of HepG2 cells transfected with MutHBx are shown in Figure 5D. Approximately 2 weeks into the clonogenic survival assay, clear colony formation was observable in the HCC cell lines. Cell colonies at this time were imaged under a light microscope and clear colonies are observed in all cases, with the exception of the MutHBx expressing HepG2 cells. These cells did not die immediately, but rather failed to grow into colonies or senesced. They developed an abnormal and splayed morphology.
DISCUSSION
This is an initial study directly comparing WtHBx and MutHBx in their interactions with and impact on p53 protein expression and function. These results are novel and represent the first attempt at evaluating the effect of MutHBx on p53. The observation that MutHBx binds to p53 and confers a different biological effect than WtHBx interaction with p53 provides a direction for understanding the elevated risk of HCC in people who have this mutation [29,30]. Presumably as a consequence of this protein interaction, MutHBx inhibits p53-mediated gene transcription but WtHBx does not. Although there is published evidence that WtHBx causes a decrease in p53 transcriptional activity[3], there is also a report showing that WtHBx has no impact on p53-mediated gene transcription[31]. The evaluation of WtHBx activity presented here was consistent with the latter study published[31]. It is notable that although both WtHBx and MutHBx physically interact with p53 protein, only MutHBx inhibits p53 transcriptional activity. This could be due to a different binding site on p53 that MutHBx interacts with, thus preventing transcriptional activity, or it could be due to a difference in the kinetics of the interactions between each set of proteins.
The pattern of activities between WtHBx and MutHBx on p53-mediated gene transcription served as an indication that cells expressing MutHBx undergo enhanced cell growth compared to WtHBx due to a MutHBx-mediated inhibition of p53, and subsequently a lack of p53 available to negatively regulate cell cycle. However, the exact opposite effect was observed in the clonogenic survival assays with HepG2 cells. MutHBx expression in the HepG2 cells abolished clonogenic survival relative to WtHBx, but this effect was specific for the p53-proficient HepG2 cells. Another set of cell lines proficient and deficient for p53 was also utilized, HCT 116 human colorectal carcinoma cells. WtHBx and MutHBx do not differ in their impact on clonogenic survival in p53-proficient HCT 116 cells. These HCT 116 cells had a faster doubling time at baseline than the liver derived cells did; roughly 12–15 hours for the HCT 116 cells, and 24 hours for the HepG2 and Hep3B cells. Also, the HCT 116 cells required 20 times more selection antibiotic for clonogenic survival compared to the liver derived cells. Perhaps the baseline growth rate differences in these two sets of cell lines contributed to the differential growth effects observed. In liver cell systems in which the p53 pathway is knocked down or removed, there was no difference in clonogenic survival between WtHBx and MutHBx. This can be interpreted to mean that the differential effect of WtHBx and MutHBx on cell growth is dependent both on the presence of the p53 pathway as well as the specificity of the liver cell context.
MutHBx severely slows the growth of HepG2 cells, rather than solely causing early cell death. This is suggested by the images showing the unusual morphology that the remaining MutHBx expressing HepG2 cells display at a time point when all the other cell types and transfections have gone on to form large healthy cell colonies. Further work needs to be done before a mechanism of MutHBx activity is elucidated. It was observed that MutHBx expression is associated with an increase in phospho-Ser15 and this suggests that MutHBx is better able to stabilize p53. It is possible that MutHBx induces p53-mediated cell death due to its interaction with p53 at a location important for non-transcription based induction of apoptosis, but additional pro-apoptosis data to support the increase in phospho-Ser15 is necessary before making that conclusion.
WtHBx has been attributed with a number of functions that each can contribute towards hepatocarcinogenesis. WtHBx is a transactivator, altering normal cellular gene expression.[32] WtHBx expression is associated with increased angiogenesis or cell migration due to increased expression of proteins involved in these processes such as focal adhesion kinase[33] and angiopoietin-2.[34] WtHBx has also been linked with a decrease in nucleotide excision repair in cells challenged with UV irradiation.[31,35] These are all oncogenic WtHBx functions that deregulate normal cellular processes and can promote carcinogenesis. Certainly, the relationship between WtHBx and p53 has been explored to some extent and there is evidence that WtHBx suppresses p53 function.[7–9,36] In our studies, we did not observe this type of activity from WtHBx. It could be that varying expression levels of the protein and/or cell type could confer differing effects on p53.
The data presented in this study indicate that MutHBx functions quite differently from WtHBx, though still as an oncogene. Another phenomenon has been described where mutated oncogenic B-RAF promotes melanocyte growth, but specifically in instances where p53 expression is silenced.[37] B-RAF protein is involved in regulating MAP and ERK kinase signaling pathways, ultimately impacting cell growth and differentiation. A frequent hotspot mutation in B-RAF (V600E) has been identified in human melanocyte tumors. Further examination of this mutant protein in cell culture has identified that only a small proportion of melanocytes expressing B-RAF carrying this mutation actually survive. It appears that inactivated p53 really contributes to promoting cell growth of these melanocytes expressing mutated B-RAF.[38] MutHBx could be an oncogene displaying this apparently bimodal type of behavior. MutHBx prevents the transcriptional activity of the p53 tumor suppressor and also allows for cell transformation and clonogenic survival in liver cells void of p53. But when it comes to cell transformation, perhaps MutHBx requires the inactivation of an important tumor suppressor, such as p53, in order for cell growth to occur; expression of the oncogene is not sufficient for cell growth, is in fact toxic to the cells, and the inactivation of a tumor suppressing pathway is necessary. Furthermore, there is evidence to suggest that p53 mutated at codon 249 (a mutation linked with dietary exposure to aflatoxins) may interact with HBx differently than wildtype p53 (used in this study). Recently published work has shown that this specific p53 mutant enhances clonogenic survival in HBx expressing cells. This work also shows that mutated HBx (the specific MutHBx examined in this study was not used) and mutant p53 may interact to facilitate cell growth and chromosomal aberrations.[39] These details will need to be uncovered over the course of additional experiments, but the findings may provide important clues for additional MutHBx interacting proteins and pathways.
In order to conduct these follow-up studies, it will be critical to develop HCC cell lines which conditionally express WtHBx or MutHBx proteins. There is a noticeable absence in the literature of studies conducted with HepG2 cells stably transfected with MutHBx. An advantage to a conditional expression system will be the ability to manipulate how much HBx is expressed in the cell; there is some evidence that the expression level of HBx may confer differential localization and thus, activity to the protein.[40] Although further characterization of MutHBx is in order, these marked differences in activity between WtHBx and MutHBx may be the very beginnings to offer a cell-based explanation for the epidemiologically observed risk for HCC that MutHBx imparts.
Acknowledgments
Many thanks to Drs. Nobunao Wakabayashi, Vasan Yegnasubramanian, Thomas Kensler, Kenrad Nelson and Bill Nelson for helpful discussions, technical expertise and data interpretation. This work was supported by a grant from the NIH, P01 ES006052 and S.I. was supported by training grant T32 ES007141.
References
- 1.Garcia M, Jemal A, Ward E, Center M, Hao Y, Siegel R, Thun M. Global Cancer Facts & Figures 2007. American Cancer Society; 2007. [Google Scholar]
- 2.Thomas M, Zhu A. Hepatocellular carcinoma: The need for progress. Journal of Clinical Oncology. 2005;23(13):2892–2899. doi: 10.1200/JCO.2005.03.196. [DOI] [PubMed] [Google Scholar]
- 3.Wang X, Forrester K, Yeh H, Feitelson M, Gu J-R, Harris C. Hepatitis B virus X protein inhibits p53 sequence-specific DNA binding, transcriptional activity, and association with transcription factor ERCC3. Proceedings of the National Academy of Sciences. 1994;91(6):2230–2234. doi: 10.1073/pnas.91.6.2230. [DOI] [PMC free article] [PubMed] [Google Scholar]
- 4.Elmore L, Hancock A, Chang S-F, Wang X, Chang S, Callahan C, Geller D, Will H, Harris C. Hepatitis B virus X protein and p53 tumor suppressor interactions in the modulation of apoptosis. Proceedings of the National Academy of Sciences. 1997;94(26):14707–14712. doi: 10.1073/pnas.94.26.14707. [DOI] [PMC free article] [PubMed] [Google Scholar]
- 5.Feitelson M, Ranganathan P, Clayton M, Zhang S. Partial characterization of the woodchuck tumor suppressor, p53, and its interaction with woodchuck hepatitis virus X antigen. Oncogene. 1997;1997(15):3. doi: 10.1038/sj.onc.1201203. [DOI] [PubMed] [Google Scholar]
- 6.Takada S, Kaneniwa N, Tsuchida N, Koike K. Cytoplasmic retention of the p53 tumor suppressor gene product is observed in the hepatitis B virus gene-transfected cells. Oncogene. 1997;15(16):1895–1901. doi: 10.1038/sj.onc.1201369. [DOI] [PubMed] [Google Scholar]
- 7.Wang X, Gibson M, Vermeulen W, Yeh H, Forrester K, Sturzbecher H-W, Hoeijmakers J, Harris C. Abrogration of p53-induced apoptosis by the hepatitis B virus X gene. Cancer Research. 1995;55(24):6012–6016. [PubMed] [Google Scholar]
- 8.Lee S, Rho H. Transcriptional repression of the human p53 gene by hepatitis B viral X protein. Oncogene. 2000;19(3):468–471. doi: 10.1038/sj.onc.1203312. [DOI] [PubMed] [Google Scholar]
- 9.Cheng A, Yu J, Lai P, Chan H, Sung J. COX-2 mediates hepatitis B virus X protein abrogation of p53-induced apoptosis. Biochemical and Biophysical Research Communications. 2008;374(2):175–180. doi: 10.1016/j.bbrc.2008.06.098. [DOI] [PubMed] [Google Scholar]
- 10.Ueda H, Ullrich S, Gangemi D, Kappel C, Ngo L, Feitelson M, Jay G. Functional inactivation but not structural mutation of p53 causes liver cancer. Nature Genetics. 1995;9(1):41–47. doi: 10.1038/ng0195-41. [DOI] [PubMed] [Google Scholar]
- 11.Hollstein M, Sidransky D, Vogelstein B, Harris C. p53 mutations in human cancers. Science. 1991;253(5015):49–53. doi: 10.1126/science.1905840. [DOI] [PubMed] [Google Scholar]
- 12.Tong M, Blatt L, Kao J-H, Cheng J, Corey W. Basal core promoter T1762/A1764 and precore 1896 gene mutations in hepatitis B surface antigen-positive hepatocellular carcinoma: a comparison with chronic carriers. Liver International. 2007;27(10):1356–1363. doi: 10.1111/j.1478-3231.2007.01585.x. [DOI] [PMC free article] [PubMed] [Google Scholar]
- 13.Fang Z-L, Sabin C, Dong B-Q, Ge L-Y, Wei S-C, Chen Q-Y, Fang K-X, Yang J-Y, Wang X-Y, Harrison T. HBV A1762T, G1764A mutations are a valuable biomarker for identifying a subset of male HBsAg carriers at extremely high risk of hepatocellular carcinoma: a prospective study. American Journal of Gastroenterology. 2008;103(9):2254–2262. doi: 10.1111/j.1572-0241.2008.01974.x. [DOI] [PMC free article] [PubMed] [Google Scholar]
- 14.Yang H-I, Yeh S-H, Chen P-J, Iloeje U, Jen C-L, Su J, Wang L-Y, Lu S-N, You S-L, Chen D-S, Liaw Y-F, Chen C-J. Associations between hepatitis B virus genotype and mutants and the risk of hepatocellular carcinoma. Journal of the National Cancer Institute. 2008;100(16) doi: 10.1093/jnci/djn243. [DOI] [PMC free article] [PubMed] [Google Scholar]
- 15.Yuan J-M, Ambinder A, Fan Y, Gao Y-T, Yu M, Groopman J. Prospective evaluation of hepatitis B 1762T/1764A mutations on hepatocellular carcinoma development in Shanghai, China. Cancer Epidemiology, Biomarkers & Prevention. 2009;18(2):590–594. doi: 10.1158/1055-9965.EPI-08-0966. [DOI] [PMC free article] [PubMed] [Google Scholar]
- 16.Buckwold V, Xu Z, Chen M, Yen T, Ou J-H. Effects of a naturally occurring mutation in the hepatitis B virus basal core promoter on precore gene expression and viral replication. Journal of Virology. 1996;70(9):5845–5851. doi: 10.1128/jvi.70.9.5845-5851.1996. [DOI] [PMC free article] [PubMed] [Google Scholar]
- 17.Buckwold V, Xu Z, Yen T, Ou J-H. Effects of a frequent double-nucleotide basal core promoter mutation and its putative single-nucleotide precursor mutations on hepatitis B virus gene expression and replication. Journal of General Virology. 1997;78(8):2055–2065. doi: 10.1099/0022-1317-78-8-2055. [DOI] [PubMed] [Google Scholar]
- 18.Zheng Y, Li J, Ou J-H. Regulation of hepatitis B virus core promoter by transcription factors HNF1 and HNF4 and the viral X protein. Journal of Virology. 2004;78(13):6908–6914. doi: 10.1128/JVI.78.13.6908-6914.2004. [DOI] [PMC free article] [PubMed] [Google Scholar]
- 19.Lin Y, Nomura T, Yamashita T, Dorjsuren D, Tang H, Murakami S. The transactivating and p53-interacting functions of hepatitis B virus X protein are mutually interfering but distinct. Cancer Research. 1997;57(22):5137–5142. [PubMed] [Google Scholar]
- 20.Sells M, Chen M, Acs G. Production of hepatitis B virus in HepG2 cells transfected with cloned hepatitis B virus DNA. Proceedings of the National Academy of Sciences. 1987;87(4):1005–1009. doi: 10.1073/pnas.84.4.1005. [DOI] [PMC free article] [PubMed] [Google Scholar]
- 21.Radhakrishnan S, Gierut J, Gartel A. Multiple alternate p21 transcripts are regulated by p53 in human cells. Oncogene. 2006;25(12):3264–3270. doi: 10.1038/sj.onc.1209195. [DOI] [PubMed] [Google Scholar]
- 22.Bunz F, Dutriaux A, Lengauer C, Waldman T, Zhou S, Brown J, Sedivy J, Kinsler K, Vogelstein B. Requirement for p53 and p21 to sustain G2 arrest after DNA damage. Science. 1998;282(5393):1497–1501. doi: 10.1126/science.282.5393.1497. [DOI] [PubMed] [Google Scholar]
- 23.Hirschman S, Price P, Garfinkel E, Christman J, Acs G. Expression of cloned hepatitis B virus DNA in human cell cultures. Proceedings of the National Academy of Sciences. 1980;77(9):5507–5511. doi: 10.1073/pnas.77.9.5507. [DOI] [PMC free article] [PubMed] [Google Scholar]
- 24.Wang XW, Forrester K, Yeh H, Feitelson MA, Gu, Harris CC. Hepatitis B virus X protein inhibits p53 sequence-specific DNA binding, transcriptional activity, and association with transcription factor ERCC3. Proc Natl Acad Sci USA. 1994;91:2230–2234. doi: 10.1073/pnas.91.6.2230. [DOI] [PMC free article] [PubMed] [Google Scholar]
- 25.Lees-Miller S, Sakaguchi K, Ullrich S, Appella E, Anderson C. Human DNA-activated protein kinase phosphorylates serines 15 and 37 in the amino-terminal transactivation domain of human p53. Molecular and Cellular Biology. 1992;12(11):5041–5049. doi: 10.1128/mcb.12.11.5041. [DOI] [PMC free article] [PubMed] [Google Scholar]
- 26.Fiscella M, Ullrich S, Zambrano N, Shields M, Lin D, Lees-Miller S, Anderson C, Mercer W, Appella E. Mutation of the serine 15 phosphorylation site of human p53 reduces the ability of p53 to inhibit cell cycle progression. Oncogene. 1993;8(6):1519–1528. [PubMed] [Google Scholar]
- 27.Kim H, Lee H, Yun Y. X-gene product of hepatitis B virus induces apoptosis in liver cells. The Journal of Biological Chemistry. 1998;273(1):381–385. doi: 10.1074/jbc.273.1.381. [DOI] [PubMed] [Google Scholar]
- 28.Sirma H, Giannini C, Poussin K, Paterlini P, Kremsdorf D, Brechot C. Hepatitis B virus mutants, present in hepatocellular carcinoma tissue abrogate both the antiproliferative and transactivation effects of HBx. Oncogene. 1999;18(34):4848–4859. doi: 10.1038/sj.onc.1202867. [DOI] [PubMed] [Google Scholar]
- 29.Kuang SY, Lekawanvijit S, Maneekarn N, et al. Hepatitis B 1762 T/1764 A mutations, hepatitis C infection, and codon 249 p53 mutations in hepatocellular carcinomas from Thailand. Cancer EpidemiolBiomarkers Prev. 2005;14(2):380–384. doi: 10.1158/1055-9965.EPI-04-0380. [DOI] [PubMed] [Google Scholar]
- 30.Yang H-I, Yeh S-H, Chen P-J, Iloeje U, Jen C-L, Su J, Wang L-Y, Lu S-N, You S-L, Chen D-S, Liaw- Y-F, Chen C-J. Associations between hepatitis B virus genotype and mutants and the risk of hepatocellular carcinoma. Journal of the National Cancer Institute. 2008;100(16):1134–1143. doi: 10.1093/jnci/djn243. [DOI] [PMC free article] [PubMed] [Google Scholar]
- 31.Lee A, Ren J, Wong E-T, Ban K, Lee L, Lee C. The hepatitis B virus X protein sensitizes HepG2 cells to UV light-induced DNA damage. The Journal of Biological Chemistry. 2005;280(39):33525–33535. doi: 10.1074/jbc.M506628200. [DOI] [PubMed] [Google Scholar]
- 32.Colgrove R, Simon G, Ganem D. Transcriptional activation of homologous and heterologous genes by the hepatitis B virus X gene product in cells permissive for viral replication. Journal of Virology. 1989;63(9):4019–4026. doi: 10.1128/jvi.63.9.4019-4026.1989. [DOI] [PMC free article] [PubMed] [Google Scholar]
- 33.Bouchard M, Wang L, Schneider R. Activation of focal adhesion kinase by hepatitis B virus HBx protein: Multiple functions in viral replication. Journal of Virology. 2006;80(9):4406–4414. doi: 10.1128/JVI.80.9.4406-4414.2006. [DOI] [PMC free article] [PubMed] [Google Scholar]
- 34.Sanz-Cameno P, Martin-Vilchez S, Lara-Pezzi E, Borque M, Salmeron J, Munoz de Rueda P, Solis J, Lopez-Cabrera M, Moreno-Otero R. Hepatitis B virus promotes angiopoietin-2 expression in liver tissue. American Journal of Pathology. 2006;169(4):1215–1222. doi: 10.2353/ajpath.2006.051246. [DOI] [PMC free article] [PubMed] [Google Scholar]
- 35.Mathonnet G, Lachance S, Alaoui-Jamali M, Drobetsky E. Expression of hepatitis B virus X oncoprotein inhibits transcription-coupled nucleotide excision repair in human cells. Mutation Research. 2004;554(1–2):305–318. doi: 10.1016/j.mrfmmm.2004.05.010. [DOI] [PubMed] [Google Scholar]
- 36.Doitsh G, Shaul Y. HBV transcription repression in response to genotoxic stress is p53-dependent and abrogated by pX. Oncogene. 1999;18(52):7506–7513. doi: 10.1038/sj.onc.1203209. [DOI] [PubMed] [Google Scholar]
- 37.Wajapayee N, Serra R, Zhu X, Mahalingam M, Green M. Oncogenic BRAF induces senescence and apoptosis through pathways mediated by the secreted protein IGFBP7. Cell. 2008;132(3):363–374. doi: 10.1016/j.cell.2007.12.032. [DOI] [PMC free article] [PubMed] [Google Scholar]
- 38.Yu H, McDaid R, Lee J, Possik P, Li L, Kumar S, Elder D, Van Belle P, Gimotty P, Guerra M, Hammond R, Nathanson K, Palma M, Herlyn M, Xu X. The role of BRAF mutation and p53 inactivation during transformation of a subpopulation of primary human melanocytes. The American Journal of Pathology. 2009;174(6):2367–2377. doi: 10.2353/ajpath.2009.081057. [DOI] [PMC free article] [PubMed] [Google Scholar]
- 39.Jiang W, Wang X, Unger T, Forgues M, Kim J, Hussain S, Bowman E, Spillare E, Lipsky M, Meck J, Cavalli L, Haddad B, Harris C. Cooperation of tumor-derived HBx mutants and p53–249ser mutant in regulating cell proliferation, anchorage-independent growth and aneuploidy in a telomerase-immortalized normal human hepatocyte-derived cell line. International Journal of Cancer. 2010;127(5):1011–1020. doi: 10.1002/ijc.25118. [DOI] [PMC free article] [PubMed] [Google Scholar]
- 40.Henkler F, Hoare J, Waseem N, Goldin R, McGarvey M, Koshy R, King I. Intracellular localization of the hepatitis B virus HBx protein. Journal of General Virology. 2001;82(4):871–882. doi: 10.1099/0022-1317-82-4-871. [DOI] [PubMed] [Google Scholar]


