Abstract
Denitrifying NO reductases are evolutionarily related to the superfamily of heme-copper terminal oxidases. These transmembrane protein complexes utilize a heme-nonheme diiron center to reduce two NO molecules to N2O. To understand this reaction, the diiron site has been modeled using sperm whale myoglobin as a scaffold and mutating distal residues Leu-29 and Phe-43 to histidines, and Val-68 to a glutamic acid to create a nonheme FeB site. The impact of incorporation of metal ions at this engineered site on the reaction of the ferrous heme with one NO was examined by UV-vis absorption, EPR, resonance Raman, and FTIR spectroscopies. UV-vis absorption and resonance Raman spectra demonstrate that the first NO molecule binds to the ferrous heme, but while the apoproteins and CuI- or ZnII-loaded proteins show characteristic EPR signatures of S = 1/2 six-coordinate heme {FeNO}7 species observable at liquid nitrogen temperature, the FeII-loaded proteins are EPR silent at ≥ 30 K. Vibrational modes from the heme [Fe-N-O] unit are identified in the RR and FTIR spectra using 15NO and 15N18O. The apo- and CuI-bound proteins exhibit ν(FeNO) and ν(NO) that are only marginally distinct from those reported for native myoglobin. However, binding of FeII at the FeB site shifts the heme ν(FeNO) by +17 cm-1 and the ν(NO) by -50 cm-1 to 1549 cm-1. This low ν(NO) is without precedent for a six-coordinate heme {FeNO}7 species and suggests that the NO group adopts a strong nitroxyl character stabilized by electrostatic interaction with the nearby nonheme FeII. Detection of a similarly low ν(NO) in the ZnII-loaded protein supports this interpretation.
Nitric oxide reductases (NORs)1 from denitrifying bacteria catalyze the 2-electron reduction of nitric oxide (NO) to nitrous oxide (N2O) as a part of the denitrification process which converts nitrite (NO2-) and nitrate (NO3-) to dinitrogen gas (N2) (1-3). This catalytic reduction of toxic NO to the relatively unreactive N2O gas has been shown to provide some pathogenic bacteria resistance to the mammalian immune response (4, 5). NORs are integral membrane proteins and are evolutionally related to the heme-copper oxidases (HCOs). The first crystal structure of a cytochrome c dependent NOR (cNOR) was recently solved to a resolution of 2.7 Å (Figure 1A) (6). As expected from sequence alignments and homology models, the catalytic subunit NorB of cNOR exhibits strong structural homologies to subunit I of HCOs with 12 central transmembrane helices and six conserved histidine residues responsible for anchoring the low-spin heme and binuclear active site, i.e., the heme b3/nonheme FeB center of cNOR and heme a3/CuB centers of HCOs.
Figure 1.
Heme/nonheme diiron centers of oxidized cNOR from Pseudomonas aeruginosa (PDB entry 3O0R) (A), reduced FeII-FeBMb1 (PDB entry 3K9Z) (B), and reduced FeII-FeBMb2 (PDB entry 3M39) (C).
Despite differences in active site metal composition, NO and O2 reductase activities are catalyzed by both family of enzymes, with NORs showing limited oxidase activity and several HCOs (i.e., ba3, bo3, and cbb3) being capable of reducing NO to N2O (7, 8). Previously, we investigated the structure of heme-nitrosyl {FeNO}7 complexes in cytochrome ba3 and bo3, and concluded that the mechanism of NO reduction in HCOs could accommodate differences in CuB reactivity towards NO (9, 10). This conclusion suggested that coordination of a second NO to CuB to form a [heme-NO•CuB-NO] trans-dinitrosyl complex, as proposed by Varotsis and coworkers (11, 12), is not an essential step of the NO reduction reaction in HCOs. A theoretical study by Siegbahn and coworkers predicts that after binding of a first NO to the heme iron(II), a second NO can directly attack the heme-nitrosyl complex to form a heme iron(III)-hyponitrite dianion complex stabilized by electrostatic interaction with the CuBII sites (13). A similar route of NO reduction can be envisioned at the heme-nonheme diiron site of NOR (14).
We now direct our work to active site models of NORs. Specifically, Lu and coworkers have engineered myoglobin to mimic the heme-nonheme diiron site of NORs by constructing an FeB site in the distal heme pocket with three histidines and one glutamate residue (L29H, F43H, H64, and V68E, hereafter called FeBMb1). In a second generation construct, a glutamate side chain at the periphery of the two metal ions’ open-coordination sites has being included in the model (L29H, F43H, H64, V68E, and I107E, hereafter called FeBMb2). The crystal structures of the reduced FeBMb1 and FeBMb2 loaded with FeII (FeII-FeBMb1 and FeII-FeBMb2) confirm coordination of the nonheme iron(II) by three histidines, one glutamate, and a solvent molecule, as observed for the FeB center of cNOR (Figure 1) (15, 16). Although, the NO reductase activity of these models appears limited, they represent an excellent opportunity for the structural analysis of the initial interactions of NO with the diiron site of NORs in the absence of other redox-active chromophores and without the practical difficulties associated with membrane proteins. Here, we report that the reaction of reduced FeII-FeBMb1 and FeII-FeBMb2 with 1 equiv NO produces stable six-coordinate low-spin (6cLS) heme {FeNO}7 complexes with exceptionally low ν(NO) stretching frequencies. Spectroscopic data with ZnII and CuI substitutions at the FeB site support the assignment of this low ν(NO) to stabilization of a heme Fe(III)-NO- electronic configuration by electrostatic interaction with FeBII. The relevance of this [heme-NO•FeB] complex to the mechanism of NO reduction at the heme/nonheme center of NORs is discussed.
MATERIALS AND METHODS
Protein preparations and metal titrations
The expression and purification of FeBMb1 (swMb L29H/F43H/V68E) and FeBMb2 (swMb L29H/F43H/V68E/I107E) were performed as previously described (15, 16). All protein concentrations were calculated based on a 406-nm extinction coefficient, ε406, of 175 mM-1cm-1 in the oxidized proteins. Apo-FeBMb solutions at 1 mM were brought into a glove box containing less than 1ppm of O2 (Omnilab System, Vacuum Atmospheres Company). The proteins were reduced by addition of ~5 mM dithionite followed by removal of excess reduction agents with desalting spin columns (Zebra, Pierce). Additions of ZnII and CuII were performed prior to the reduction in 50 mM Bis-Tris pH 7.0 using ZnIISO4, and CuIISO4 salts, while addition of FeII was performed after the reduction in the same buffer using FeIICl2. Fresh FeII, ZnII, and CuII solutions were prepared each time by dissolving FeIICl2, ZnIISO4, and CuIISO4 in 0.01 M HCl or double-distilled water. Typically, 3 μl of metal solution containing 1.3 to 2 equiv of metals was added to 100 μl of 1 mM protein solutions at a rate of 0.5 μl/min with gentle stirring. After metal addition, the protein solution was incubated at room temperature for 20 min and the metal ion incorporation was confirmed by UV-vis spectroscopy using a Cary 50 spectrophotometer (Varian). If required, the samples were concentrated by a microcon filtering device (10 kDa cutoff, Amicon ultra, Millipore).
Preparation of NO adducts
Stoichiometric additions of NO to fully reduced proteins were achieved using NO-saturated stock solutions (14NO purchased from Airgas, and 15NO and 15N18O from Aldrich, and treated with 1 M KOH solution) tested by titration with deoxymyoglobin (Sigma). Alternatively, diethylamine NONOate (Cayman Chemical, Ann Arbor, MI) was used as a NO donor by preparing stock solution in 0.01 M NaOH on the basis of a ε250 = 6,500 M-1cm-1. Additions of NO were made either in anaerobic UV-vis cuvettes or in Eppendorf tubes followed by immediate transfer of the sample solutions to EPR tubes, Raman capillaries or FTIR cells. The presence of the NO complexes was confirmed by obtaining UV-vis absorption spectra of all samples directly in EPR tubes, Raman capillaries or FTIR cells. CO/NO mixed-gas experiments were carried out as previously described with slight modifications (10). The sample headspace was thoroughly exchanged with pure CO gas to reach saturation (Airgas), and incubated for a few minutes at room temperature. Immediately after addition of 1.0 equiv NO as NONOate, the protein solution was transferred to an FTIR cell with a 15-μm Teflon spacer.
Molecular spectroscopy
UV-vis absorption spectra were recorded on a Varian Cary 50. EPR spectra were obtained with a Bruker E500 X-band EPR spectrometer equipped with a superX microwave bridge and a dual-mode cavity with a helium flow cryostat (ESR900, Oxford Instrument, Inc.) for measurements at 5 to 40 K and a super HiQ cavity resonator (ESR4122, Bruker) and a liquid nitrogen Dewar for measurements above 90 K. Quantitation of the EPR signals was performed under nonsaturating conditions by double integration and comparison with CuII-EDTA standards. RR spectra were obtained using a custom McPherson 2061/207 spectrograph (set at 0.67 m with variable gratings) equipped with a liquid-N2-cooled CCD detector (LN-1100PB, Princeton Instruments). The 413-nm excitation laser was derived from a Kr laser (Innova 302C, Coherent) and the 442-nm line from a helium-cadmium laser (Liconix, Santa Clara CA). A Kaiser Optical supernotch filter or a long-pass filter (RazorEdge, Semrock) was used to attenuate Rayleigh scattering. RR spectra were collected at room temperature in a 90° scattering geometry on samples mounted on a reciprocating translation stage. To assess the photosensitivity of the NO adduct, rapid acquisitions with minimal laser power and continuous sample spinning were compared with longer data acquisitions on static samples. Frequencies were calibrated relative to indene and aspirin standards and are accurate to ±1 cm-1. Polarization conditions were optimized using CCl4 and indene. The integrity of the RR samples was confirmed by direct monitoring of their UV-vis absorption spectra in Raman capillaries before and after laser exposure. Typical enzyme concentrations ranged from 10 μM for UV-vis measurements in cuvettes, to 100 μM for EPR and RR samples.
FTIR photolysis experiments were carried out as described previously (9, 10). Approximately 15 μL of 1 mM protein solution were loaded in an FTIR cell with a 15-μm pathlength. The FTIR cell was mounted to a sample rod and flash-frozen in liquid N2, prior to insertion in a pre-cooled closed-cycle cryogenic system (Omniplex, Advanced Research System). The sample was kept inside the sample compartment of the FTIR or UV-vis instrument in the dark during cooling down to10 K. FTIR spectra were obtained on a Bruker Tensor 27 equipped with a liquid-N2-cooled MCT detector. Sets of 1000-scan accumulations were acquired at 4-cm-1 resolution. Photolysis of the nitrosyl complexes was performed by continuous illumination of the sample directly in the FTIR sample chamber using a 300-W arc lamp after filtering heat and NIR emissions. The same illumination procedure was used to follow the dissociation process by UV-vis spectroscopy with the Cary 50 spectrophotometer. The temperature dependence of the rebinding process was monitored by raising the sample temperature incrementally by 10 K and collecting UV-vis absorption spectra after an incubation period of 10 minutes. This approach provides a qualitative means to compare rebinding temperatures between distinct photolabile species.
RESULTS
Characterization of apo-, FeII-, ZnII-, and CuI-FeBMbs
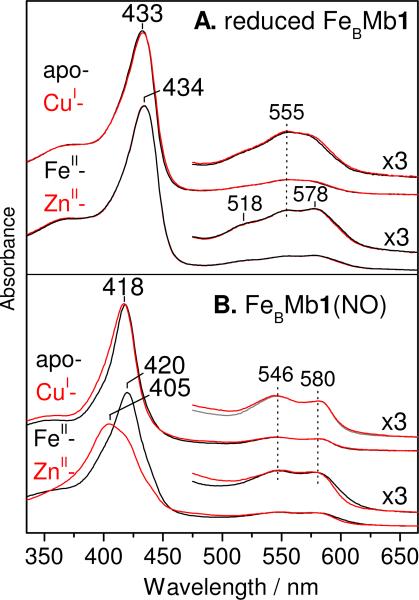
Addition of FeII and ZnII to dithionite-reduced FeBMb1 results in small changes in Soret and α/β absorption features from the ferrous heme prosthetic group compared to the apoprotein. Specifically, the Soret band observed at 433 nm in the apoprotein red-shifts to 434 nm and prominent shoulders appear at 518 and 578 nm in the visible region when divalent metal ions are bound at the FeB site (Figure 2A) (15). In contrast, the presence of CuI does not modify the UV-vis spectrum of reduced FeBMb1 although FTIR experiments confirm full occupancy of the FeB site by CuI (see below). Nearly identical observations are made by UV-vis absorption characterization of reduced apo-, FeII-, ZnII-, and CuI-FeBMb2 (Figure S1 in the Supporting Information).
Figure 2.
Room temperature UV-vis absorption spectra of reduced apo-, FeII-, ZnII-, and CuI-FeBMb1 (A) and after addition of 1 equiv NO (B).
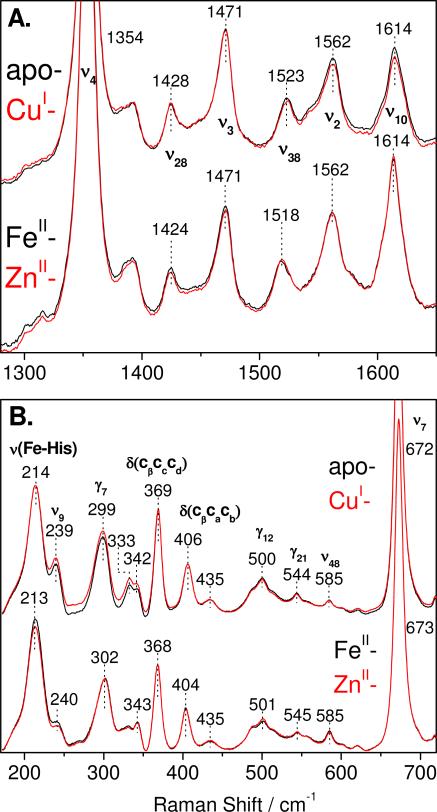
The coordination number and spin state of the heme iron(II) in reduced apo-, FeII-, ZnII-, and CuI-FeBMb1 are revealed by the frequency of porphyrin vibrational modes in RR spectra obtained with Soret excitation. The reduced apo-, FeII-, ZnII-, and CuI-FeBMb1 proteins exhibit ν4, ν3, ν2, and ν10 modes at 1354, 1471, 1562, and 1614 cm-1, respectively (Figure 3A). These RR frequencies are characteristic of 5-coordinate high-spin (5cHS) heme iron(II). With a 442-nm excitation, the low-frequency region of the RR spectra of the reduced proteins exhibit an intense band between 213 and 214 cm-1 that is assigned to an Fe-His stretching vibration, ν(Fe-NHis), from a heme iron(II) bound to a neutral proximal histidine (Figure 3B). These ν(Fe-NHis)s are similar to those reported for wild-type swMb and CuBMb with or without CuI bound (17-19). Thus, the proximal Fe-His bond strength is not significantly affected by the distal substitutions and metal addition as expected from the crystal structure data reported for these engineered proteins (15, 16). As with the UV-vis data, a fine-examination of the RR spectra reveals a closer match between the spectra of apo- and CuI-FeBMb1 on the one hand, and those of FeII- and ZnII-FeBMb1 on the other hand. Virtually identical RR spectra and ν(Fe-NHis) frequencies are observed with reduced apo-, FeII-, ZnII-, and CuI-FeBMb2 (Figure S2 in the Supporting Information).
Figure 3.
Room temperature RR spectra of reduced apo-, FeII-, ZnII-, and CuI-FeBMb1. The high-frequency RR spectra were obtained with a 413-nm excitation (A) and low-frequency RR spectra were obtained with a 442-nm excitation (B).
Reaction of FeBMbs with 1 equiv of NO
Addition of up to 1 equiv of NO to reduced apo-, FeII-, or CuI-FeBMb1 results in blue-shifts of Soret absorptions, from ~434 nm to ~420 nm, and the appearance of better resolved α/β bands at 546 and 580 nm (Figure 2B). These UV-vis absorption features are consistent with the formation of 6-coordinate low-spin (6cLS) heme-NO complexes and are very similar to those of the {FeNO}7 complex formed in reduced wild-type swMb and CuBMb upon exposure to excess NO (19, 20). The near complete conversion of the UV-vis spectra of reduced FeBMb1 upon stoichiometric addition of NO suggests that the heme iron(II) has high affinity for NO and easily outcompetes FeII- and CuI-bound at the FeB site for NO binding. The reaction of ZnII-FeBMb1 with 1 equiv of NO generates a mixture of species as indicated by the presence of pronounced shoulders in the Soret absorption region (Figure 2B). The Soret band at 405 nm suggests the formation of 5cLS heme {FeNO}7 species, an interpretation confirmed by the EPR analysis of these samples (see below).
Additions of 1 equiv NO to reduced apo-, FeII-, CuI-, or ZnII-FeBMb2 produce nearly identical UV-vis spectra to those observed with FeBMb1, except for the ZnII-FeBMb2 protein which shows a significantly smaller amount of 5cLS heme-NO formation, and consequently, a greater content of 6cLS {FeNO}7 species than in ZnII-FeBMb1(NO) (Figure S3 in the Supporting Information). Varying conditions such as protein concentrations and peak concentration of free NO resulted in small variations in 5cLS vs 6cLS {FeNO}7 species population ratios, but we were unable to identify conditions that prevent the formation of heme-coordination mixtures in the ZnII-loaded proteins.
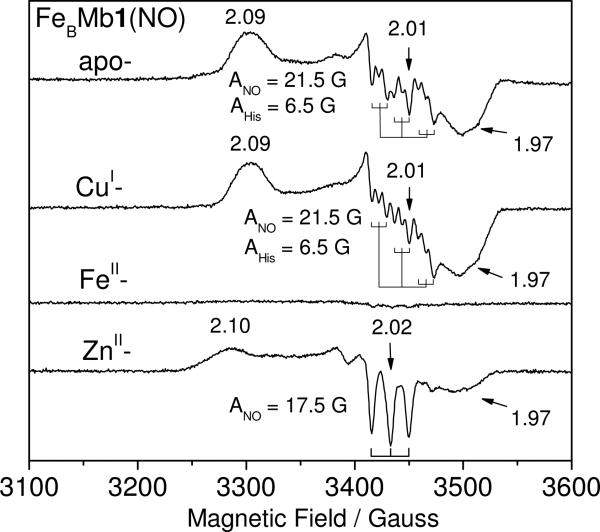
As previously reported, the EPR spectrum of apo-FeBMb1(NO) is characteristic of an S = 1/2 6cLS {FeNO}7 species with g values centered around 2 (2.09, 2.01, 1.97) and a clear 9-line 14N-hyperfine structure originating from the nitrosyl and histidine axial ligands (ANO = 21.5 G, AHis = 6.5 G) (Figure 4) (16). The CuI-FeBMb1(NO) exhibits an equivalent S = 1/2 EPR signal with 9-line splitting at the center resonance (ANO = 21.5 G, AHis = 6.5 G). In contrast, this signal is not observed in the EPR spectrum of FeII-FeBMb1(NO) complex which only shows a very weak signal centered at g ~ 2 with 3-line 14N-hyperfine structure (ANO = 16.5 G), typically assigned to 5cLS heme FeII-NO species. EPR signal quantification using CuIIEDTA standards suggests that this g ~ 2 signal represents less than 5% of FeII-FeBMb1(NO) complex. Thus, the majority of the heme-nitrosyl species in FeII-FeBMb1(NO) are undetectable by EPR at ≥ 30 K (Figure 4). As expected from the UV-vis data, the EPR spectrum of ZnII-FeBMb1(NO) shows a superposition of two signals centered at g ~ 2, one exhibiting a sharp 3-line 14N-hyperfine structure (ANO = 17.5 G) characteristic of 5cLS heme {FeNO}7 species, and another with more rhombic EPR resonances suggestive of 6cLS heme {FeNO}7 species. This latter species can be trapped as a photodissociated species at cryogenic temperature to isolate its EPR components from those of the photo-stable 5cLS heme {FeNO}7 species (Figure S4 in the Supporting Information). This coexistence of 3-lines and 9-lines species is reminiscent of ba3(NO) and hemoglobin(NO) in presence of allosteric effectors (9, 21). Similar EPR spectra were obtained for apo-, FeII-, ZnII-, and CuI- FeBMb2(NO). As previously suggested by the UV-vis analysis, ZnII-FeBMb2(NO) retains a greater content of 6cLS heme {FeNO}7 species than ZnII-FeBMb1(NO) (Figure S4 in the Supporting Information).
Figure 4.
EPR spectra of apo-, CuI-, FeII-, and ZnII-FeBMb1(NO) at 30 K. Condition: protein concentration, 100 M; microwave frequency, 9.66 GHz; microwave power, 0.25 mW; modulation frequency, 100 kHz; modulation amplitude, 4.0 G.
EPR measurements carried out below 30 K reveal new resonances at g = 6.2 and 6.1 in FeII-FeBMb1(NO) and FeII-FeBMb2(NO) that are absent from the EPR spectra of their apo-, CuI-, or ZnII-FeBMb(NO) counterparts (Figure S5 in the Supporting Information). These non-saturating signals are likely to reflect the S = 3/2 or 5/2 overall spin expected from exchange-coupling between the S = 1/2 heme 6cLS {FeNO}7 and the S = 2 nonheme FeII at the FeB site. These assignments are supported by the loss of these g = 6.2 and 6.1 signals after illumination at cryogenic temperatures, and their reappearance after prolonged annealing of these samples in liquid nitrogen (Figure S5 in the Supporting Information).
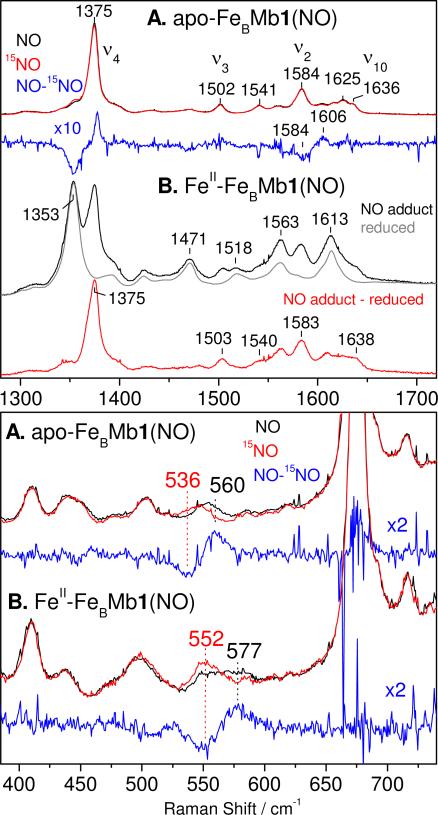
The nitrosyl complexes that form in apoproteins are stable in presence of excess NO and allow extended acquisition time for optimal RR spectral characterization. The high-frequency RR spectrum of apo-FeBMb1(NO) obtained with 413-nm excitation shows porphyrin skeletal modes ν4, ν3, ν2, and ν10 at 1375, 1502, 1584, and 1636 cm-1, respectively, as expected for 6cLS heme-NO complexes (Figure 5A) (22, 23). Isotope-editing with 15NO of the RR spectra of apo-FeBMb1(NO) reveals a very weakly enhanced ν(NO) at 1606 cm-1 (Table 1). In the low-frequency RR spectra, a band at 560 cm-1 that downshifts with 15NO is observed in apo-FeBMb1(NO) (Figure 5A) and is assigned to an ν(FeNO), as previously reported in wild-type swMb and CuBMb (19, 23). Similar RR data were obtained with apo-FeBMb2(NO) (Figure S6A in the Supporting Information).
Figure 5.
High- and low-frequency RR spectra of apo-FeBMb1(NO) (A) and FeII-FeBMb1(NO) (B) obtained with a 413-nm excitation at room temperature.
Table 1.
Vibrational frequencies (cm-1) of heme {FeNO}7 species in the absence or presence of distal metal ions.
| {FeNO}7 species | ν (FeNO) (Δ15N) (*Δ15N18O)a | ν(N-O) (Δ15N) (*Δ15N18O)b | Ref. |
|---|---|---|---|
| FeII-FeBMb1(NO) | 577 (-25) | 1549 (-22) (*-69) | this work |
| FeII-FeBMb2(NO) | 578 (-25) | 1544 (-25) (*-67) | |
| ZnII-FeBMb2(NO) | 1550/1577 (-32) (*-75)c | this work | |
| CuI-FeBMb1(NO) | 1601 | this work | |
| CuI-FeBMb1(CO)(NO) | 1629 | ||
| apo-FeBMb1(NO) | 560 (-24) | 1601 (-31) | this work |
| apo-FeBMb2(NO) | 560 (-24) | nr (-) | |
| swMb(NO) | 560 (-28) (*-28) | 1613 (- 26) (*-68) | (25, 36) |
| apo-CuBMb(NO) | 566 (*-20) 457 (*-11) | 1598 (*-35) | (19) |
| CuI-CuBMb(NO) | 563 (*-17) | Not observed | (19) |
| T.t. ba3(NO) | 539 (-17) | 1622 (-32) (*-75) | (9, 12) |
| E.c. bo3(NO) | 534 (*-17) 440 (*-13) | 1610 (-30)(*-70) | (10) |
From room temperature RR spectra.
From low-temperature FTIR difference spectra except for apo-CuBMb(NO).
Calculated shifts from middle of the Fermi doublet
Because the FeII-FeBMb1(NO) and FeII-FeBMb2(NO) complexes are not stable in presence of excess NO and when prepared using ≤1 equiv of NO, the Raman-laser probe promotes the dynamic build-up of a significant population of heme iron(II) species via efficient photolysis of 6cLS heme {FeNO}7 species and slow non-geminate rebinding at low NO concentrations. Indeed, despite low laser power (~0.05 mW) and sample spinning, the high-frequency RR spectrum of FeII-FeBMb1(NO) shows two prominent bands for the oxidation-state marker band ν4, one at 1353 cm-1 which increases with laser power and is also observed in the RR spectrum of reduced FeII-FeBMb1, and one at 1375 cm-1 which corresponds to the heme {FeNO}7 complex (Figure 5B). A difference spectrum can be computed to isolate the components of the nitrosyl complex from the raw data. It reveals porphyrin skeletal modes ν4, ν3, ν2, and ν10 at 1375, 1503, 1583, and 1638 cm-1, characteristic of a 6cLS hemenitrosyl species and that are very similar to those observed with apo-FeBMb1(NO) (Figure 5B). While ν(NO)s could not be extracted from the RR spectra of FeII-FeBMb1(NO) and FeII-FeBMb2(NO), an 15NO-isotope sensitive mode at 577 cm-1, 17 cm-1 higher than in apo-FeBMb1(NO), is assigned to a ν(FeNO) vibration from the heme {FeNO}7 species (Figure 5B). Similar RR data were obtained with FeII-FeBMb2(NO) (Table 1 & Figure S6B in the Supporting Information).
Low-temperature photolysis of the heme-NO complexes
As previously with ba3(NO) and bo3(NO), low-temperature FTIR photolysis experiments were carried out to isolate ν(NO) vibrations of metal-nitrosyl complexes in ‘dark’ minus ‘illuminated’ FTIR difference spectra (9, 10). While detection of these modes by RR spectroscopy is hampered by poor enhancement of ν(NO) modes (vide supra), the FTIR photolysis approach has been shown to be a sensitive probe of dinuclear heme/copper active sites as well as heme/nonheme diiron sites (10, 24).
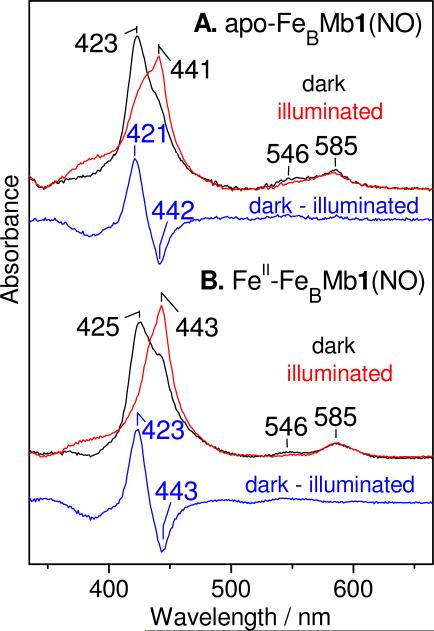
The UV-vis spectra of apo- and CuI-FeBMb1(NO) obtained at 10 K show Soret bands at 423 nm that are slightly red-shifted from those observed at room temperature but remain consistent with the assignment of 6cLS heme {FeNO}7 complexes (Figure 6A). A few minutes of illumination with a 300-W arc lamp generates new Soret absorption near 441 nm, characteristic of 5cHS heme iron(II) species, that again are red-shifted by a few nanometers from absorption maxima observed in the reduced proteins at room temperature. ‘Dark’ minus ‘illuminated’ UV-vis difference spectra reveal differential signals centered near 430 nm that are nearly identical in apo- and CuI-FeBMb1(NO) and that suggest high photodissociation efficiency (>60%) (Figures 6A & S7 in the Supporting Information). Rebinding of photolyzed NO to the heme requires raising the sample temperature to 60 K, which is 20 K higher than for swMb (25).
Figure 6.
UV-vis spectra of apo-FeBMb1(NO) (A) and FeII-FeBMb1(NO) (B) at 10 K: dark (black), illuminated (red), and ‘dark’ minus ‘illuminated’ difference spectra (blue). Shoulders at 443 nm in the dark spectra suggest incomplete heme NO-occupancy with ≤1 equiv NO additions.
The 10-K UV-vis spectrum of FeII-FeBMb1(NO) shows a Soret band at 425 nm, which is red-shifted by 2 nm compared to that of apo-FeBMb1(NO), and consistent with a 6cLS heme {FeNO}7 complex (Figure 6B). Similar to apo-FeBMb1(NO), this sample shows high photodissociation efficiency with the appearance of a new Soret absorption at 443 nm that matches that of the 5cHS heme iron(II) species observed in reduced FeII-FeBMb1 at 10 K (data not shown). Equivalent low-temperature UV-vis data were obtained with FeII-FeBMb2(NO) (data not shown). Complete rebinding of the photolyzed NO to the heme in FeII-FeBMb1(NO) and FeII-FeBMb2(NO) occurs quickly only above 110 K, which is at least 50 K higher than in apo-FeBMb1(NO), suggesting a greater thermodynamic barrier for NO rebinding in presence of FeII at the FeB site.
As observed previously at room temperature, the low temperature UV-vis spectrum of ZnII-FeBMb2(NO) reveals a broad Soret absorption with multiple shoulders indicative of a mixture of species. Despite this mixture, the differential signal observed in the ‘dark’ minus ‘illuminated’ UV-vis difference spectrum is qualitatively the same as that of FeII-FeBMb2(NO) (Figure S8 in the Supporting Information) as only 6cLS heme {FeNO}7 species are readily photolyzed with the conditions used here (9). Equivalent experiments with ZnII-FeBMb1(NO) only revealed a marginal differential signal in the Soret region (data not shown) in support of the low content of 6cLS {FeNO}7 species observed in these samples by EPR spectroscopy (see above). The temperature dependence of NO rebinding after photolysis in ZnII-FeBMb2(NO) is equivalent to that of FeII-FeBMb1(NO) and FeII-FeBMb2(NO).
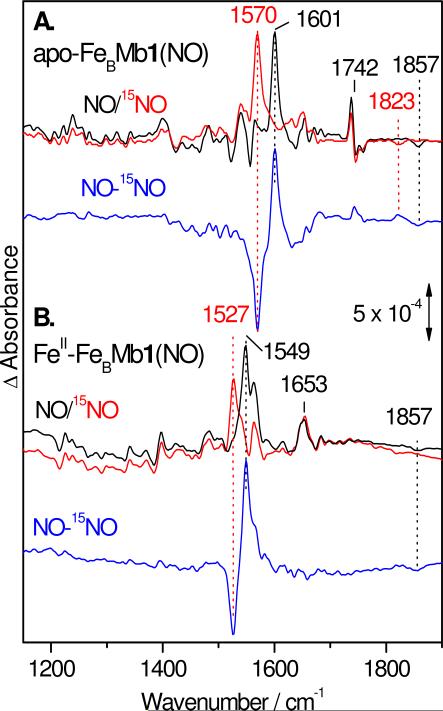
The ‘dark’ minus ‘illuminated’ FTIR difference spectra of apo-FeBMb1(NO) obtained at 10 K isolate a positive band at 1601 cm-1 which downshifts to 1570 (-31) with 15NO and is assigned to ν(NO) of the heme-NO complex (Figure 7A). This frequency is a close match to the ν(NO) observed in the RR spectra. The difference spectra also reveal a negative band at 1857 cm-1 which downshifts to 1823 (-34) cm-1 with 15NO and that we assign to a ν(NO) from the photolyzed NO group docked in a proteinaceous pocket. Equivalent dissociated ν(NO) have been observed for the nitrosyl complexes of myoglobin and some HCOs (10, 25). In addition to these FTIR bands related to the NO group, the ‘dark’ minus ‘illuminated’ FTIR difference spectra include weaker signals between 1200 to 1750 cm-1 that cancel out in the NO-isotope edited difference spectra and are thus assigned to perturbations of amide and porphyrin vibrational modes. A relatively intense differential signal centered at 1742 cm-1 is assigned to a C=O stretching mode of a carboxylic acid, possibly E68 since this residue may interact with the bound NO and could report perturbations upon NO dissociation.
Figure 7.
FTIR difference spectra (‘dark’ minus ‘illuminated’) of apo-FeBMb1(NO) (A) and FeB-FeBMb1(NO) (B) at 10 K: NO (black), 15NO (red), and ‘NO’ minus ‘15NO’ difference spectra (blue).
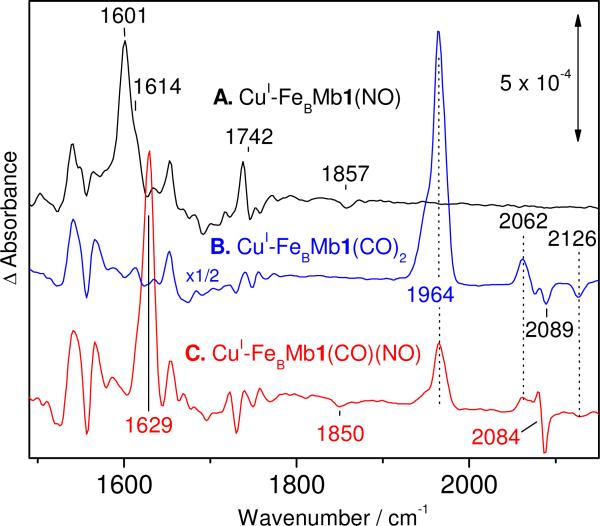
The FTIR difference spectrum of CuI-FeBMb1(NO) is nearly identical to that of the apo-FeBMb1(NO); the difference spectrum isolates ν(NO)s from the heme {FeNO}7 complex and free NO docked in the distal pocket at 1601 and 1857 cm-1, respectively (Figure 8A). The 1742 cm-1 differential signal observed in apo-FeBMb1(NO) is also conserved and may reflect the lack of affinity CuI shows for carboxylate ligands. In view of these similarities between CuI-FeBMb1 and apo-FeBMb1, a concern was that CuI might not be retained at the FeB site, but this interpretation of the data is ruled out by experiments with CO. Specifically, exposing full-reduced CuI-FeBMb1 to excess CO results in a full conversion of the broad 433-nm Soret absorption of ferrous heme to a sharp Soret band at 422 nm (Figure S9 in the Supporting Information). Low-temperature FTIR spectra of these samples reveal the concomitant presence of ν(CO)heme and ν(CO)Cu at 1950/1964 and 2068/2083 cm-1, respectively (Figure S10 in the Supporting Information). These data suggest that the heme-copper dinuclear site in FeBMb1 is capable of accommodating two CO molecules to form a CuI-FeBMb1(CO)2 ternary complex. The two sets of ν(CO)heme and ν(CO)Cu frequencies are likely to correspond to two distinct CuI-FeBMb1(CO)2 conformers and are reminiscent of the α/β conformers observed in some HCOs such as from Rhodobacter sphaeroides aa3 (26). Although a di-carbonyl complex has been show to form at the diiron site of one NOR, the qCuANOR from bacillus azotoformans (24), it has not been observed in HCOs.
Figure 8.
FTIR difference spectra (‘dark’ minus ‘illuminated’) of CuI-FeBMb1(NO) (A), CuI-FeBMb1(CO)2 (B) and CuI-FeBMb1(CO)(NO) (C) at 10 K.
To confirm the presence of CuI at the FeB site in FeBMb1 after addition of 1 equiv NO, we also prepared the [heme-NO•OC-Cu] ternary complex. An equivalent ternary complex was characterized earlier in bo3 (10). The FTIR ‘dark’ spectrum of CuI-FeBMb1(CO)(NO) shows absorption at 2071 and 2083 cm-1, consistent with ν(CO)Cu frequencies, while the heme iron is predominantly complexed by NO (Figure S11 in the Supporting Information). The FTIR photolysis difference spectra of CuI-FeBMb1(CO)(NO) show a ν(NO)heme at 1629 cm-1 and is thus up-shifted 28 cm-1 by the presence of the Cu-carbonyl (Figure 8C). The NO dissociation induces new perturbations in the ν(CO)Cu region at 2084 cm-1 (Figure 8C). The absence of ν(NO) near 1601 cm-1, as in apo-FeBMb1(NO) or CuI-FeBMb1(NO), suggests that the formation of [heme-NO•OC-Cu] ternary complex is stoichiometric. The presence of CuI or CuI-CO at the FeB site has no effect on the rebinding temperature of the heme {FeNO}7 complexes in CuI-FeBMb1(NO) and CuI-FeBMb1(CO)(NO) which occur after annealing to 60 K as in apo-FeBMb1(NO).
Although binding of FeII to the FeB site does not significantly affect the electronic absorption spectrum of the heme {FeNO}7 species in FeBMbs (Figures 2B & S3 in the Supporting Information), it leads to a 50-cm-1 downshift of the ν(NO)heme mode. Specifically, the ν(NO)heme is observed as a positive band at 1549 cm-1 in the FTIR difference spectra that downshifts to 1527 (-22) with 15NO (Figure 7B & Table 1). Weaker differential signals between 1200 and 1700 cm-1 cancel out in the NO-isotope edited difference spectra and are assigned to perturbations of amide and porphyrin vibrational modes. The strong differential signal at 1742 cm-1 observed in the FTIR difference spectra of apo-FeBMb1(NO) and assigned to the C=O stretch of E68 is absent from the difference spectra of FeII-FeBMb1(NO), presumably as E68 is recruited for coordination of FeII at the FeB site (15, 16). Reproducible detection of a negative band which could be assigned to free NO docked in a proteinaceous pocket was not achieved with FeII-FeBMb1(NO) samples and may reflect heterogeneous broadening from multiple NO-docking sites in FeII-FeBMb1 compared to apo-FeBMb1.
Introducing an additional glutamate residue in FeBMb2 further lowers the ν(NO)heme in FeII-FeBMb2(NO) by 5 cm-1. The 10-K ‘dark’ minus ‘illuminated’ FTIR difference spectrum of FeII-FeBMb2(NO) complex exhibits a ν(NO)heme at 1544 cm-1 that downshifts to 1519 (-25) and 1477 (-67) cm-1 with 15NO and 15N18O, respectively (Figure S11 in the Supporting Information). A broad and weak negative band at 1850 cm-1 that downshifts to 1819 (-31) and 1769 (-81) cm-1 with 15NO and 15N18O, respectively, is assigned to the ν(NO)free from NO docked in proteinaceous pocket(s).
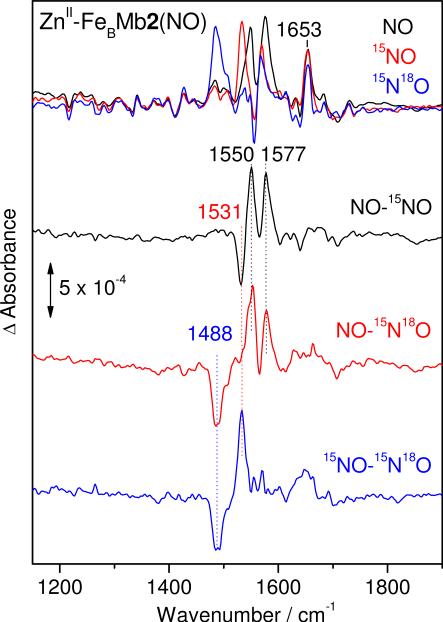
In order to investigate the effect of metal ion composition at the FeB site, FTIR photolysis experiments were also performed on the ZnII-FeBMb2(NO) complex. The FTIR difference spectra of ZnII-FeBMb2(NO) show a doublet at 1550/1577 cm-1 that downshifts as a singlet at 1531 and 1488 cm-1 with 15NO and 15N18O, respectively (Figure 9 and Table 1). Thus, the 1550/1577 cm-1 doublet is assigned to a Fermi coupling of the ν(14NO) mode in ZnII-FeBMb2(NO). As with FeII-FeBMb2(NO), the ν(NO) of free NO is not detected in a reproducible fashion in ZnII-FeBMb2(NO).
Figure 9.
FTIR difference spectra (‘dark’ minus ‘illuminated’) of ZnII-FeBMb2(NO) at 10 K: NO (black), 15NO (red), 15N18O (blue), and isotope difference spectra ‘NO’ minus ‘15NO’ (black), ‘NO’ minus ‘15N18O’ (red), and ‘15NO minus 15N18O’ (blue).
DISCUSSION
Stoichiometric additions of NO to fully reduced FeII-FeBMb1 and FeII-FeBMb2 result in the formation of stable heme-NO complexes, suggesting that the 5cHS ferrous heme irons exhibit higher affinity for NO than the nonheme FeII sites. While the UV-vis and high-frequency RR spectra of FeII-FeBMb(NO) are nearly identical to those of apo-FeBMb(NO) and characteristic of 6cLS heme {FeNO}7 species, the FeII-FeBMb(NO) complexes exhibit unusual Fe-N-O vibrational frequencies. Typically, 6cLS heme {FeNO}7 species can display two low-frequency RR modes sensitive to NO-isotope labeling: one near 450 cm-1 and another near 560 cm-1. Here, only the latter signal is observed with significant enhancement, and it occurs at 577 and 578 cm-1 in FeII-FeBMb1(NO) and FeII-FeBMb2(NO), respectively, i.e., 17 to 18 cm-1 higher than in the apoproteins. Assignments of these bands as Fe-NO stretching and Fe-N-O bending modes has been a recurring source of controversy (22, 23, 27), and although combined analyses of RR and nuclear resonance vibrational spectroscopy (NRVS) data along with density function theory (DFT) calculations have made a convincing case in assigning the vibration near 560 cm-1 to the bending mode and the lower frequency band as a mixed stretching and bending mode (28, 29), interpreting observed frequencies in terms of bond strength and/or bond geometry remains arduous. In contrast, N-O stretches from iron-nitrosyl species behave as isolated modes, and accordingly, the fact that the ν(NO)s of FeII-FeBMb1(NO) and FeII-FeBMb2(NO) are ~50 cm-1 lower than in all heme-nitrosyl complexes reported so far is highly significant (30, 31). Taken together with the results of metal ion substitution at the FeB site, these vibrational data suggest a bent FeNO geometry and an Fe(III)-NO- resonance structure with increased iron dπ to NO π* backbonding (30, 32, 33) with stabilization via electrostatic interaction with the FeII ion at the FeB site.
The data obtained with ZnII-FeBMb2(NO) support this assignment of the FeB site perturbation on the heme {FeNO}7 species as being primarily electrostatic, since the ν(NO) mode in ZnII-FeBMb2(NO) is observed only ~10 cm-1 higher than in FeII-FeBMb2(NO). This small shift in ν(NO) frequencies may reflect a difference in the distance between the heme {FeNO}7 unit and the nonheme divalent ion and/or difference in the extent of charge neutralization the carboxylate group of E68 induces on the divalent ion. Crystal structures, which are available for air-oxidized ZnII-FeBMb2 and reduced FeII-FeBMb2, reveal similar coordination spheres around the divalent nonheme ions, although the distance between the FeB metal ion increases from 4.62 Å in FeII-FeBMb2 to 4.78 Å in ZnII-FeBMb2 and the carboxylate group of E68 seems to adopt a stronger bidentate coordination with the ZnII ion while it appears closer to a μ-1,3 bridging geometry between the two iron(II) in FeII-FeBMb2 (16).
The crystal structure of CuII-loaded air-oxidized FeBMb2 confirms that CuII occupy the FeB site (16), but a CuII-FeBMb(NO) complex cannot be formed, presumably because the reduction potential of the CuII is higher than that of the heme iron(II). The CuI-FeBMb(NO), on the other hand, forms readily and shows a ν(NO)heme mode comparable to that of apo-FeBMb1(NO), suggesting that the heme {FeNO}7 unit does not interact with CuI. While the crystal structure of CuII-FeBMb indicates that E68 interacts weakly with the CuII ion, this side chain is unlikely to bind to CuI. In fact, a differential signal at 1742 cm-1 observed in the FTIR photolysis spectra of apo- and CuI-FeBMb(NO) likely corresponds to the ν(C=O) of the protonated glutamic acid group of E68. The CuI ion is more likely to coordinate only the three histidine side chains at the FeB site. This coordination geometry may also result in a greater distance between the heme iron and the copper ion and allow the CuI ion to bind CO in the presence of a second exogenous ligand at the heme iron.
Interaction between the heme {FeNO}7 species and the nonheme FeII is also evidenced by the impact of metal occupancy at the FeB site on the detection of the g ~2 signal observed in apo-FeBMb(NO). While the incorporation of diamagnetic CuI and ZnII only affects the characteristics of the g ~2 signal from the heme {FeNO}7 species, the addition of FeII completely banishes the detection of this EPR signal. Exchange coupling between a S = 1/2 heme {FeNO}7 and a S = 2 high-spin FeBII is anticipated to produce a non-integer overall spin observable by EPR. Accordingly, new resonances at g = 6.2 and 6.1 observable only below 30 K in FeII-FeBMb1(NO) and FeII-FeBMb2(NO), respectively, are likely to reflect these paramagnetic clusters. Further investigation will be required to fully define the magnetic properties of these complexes but the photosensitive character of these EPR features support these preliminary assignments (SI.
Our data identify a 6cLS heme {FeNO}7 weakly interacting with the FeBII site to produce a partial nitroxyl anion as the first complex formed by exposure of reduced FeBMb models to NO. This structural model is consistent with DFT analyses of the NO reduction reaction at heme-nonheme diiron sites which predict the presence of a stabilizing interaction between the negatively charged nitroxyl anion and FeBII (14). A similar intermediate complex was proposed to form in flow-flash experiments with cNOR(CO) exposed to NO, where UV-vis spectra suggest that a first NO reacts with high-spin heme b3 within 2 μs to form a 6-coordinate heme-nitrosyl complex (34).
Subsequent steps to the formation of this initial [6cLS heme {FeNO}7•nonheme FeBII] complex remain obscure. Rapid freeze quench EPR experiments by Shiro and coworkers suggest that dissociation of the proximal His ligand from the heme b3 to form a 5-coordinate heme-nitrosyl complex and binding of a second NO to the FeB center occur within a sub-millisecond time scale to form a [5cLS heme {FeNO}7•nonheme {FeNO}7] ternary complex (35). In contrast, a DFT analysis by Siegbahn et al. predicted a direct attack of a second NO on the heme-nitroxyl coupled with electron transfer from FeBII to form a heme iron(III) bound hyponitrite dianion intermediate (14). Preliminary experiments monitoring the reaction of NO with FeII-FeBMb(NO) complexes suggest that both 5cLS and 6cLS heme {FeNO}7 species as well as nonheme {FeNO}7 species are forming as well in these models. Stopped-flow and rapid-freeze-quench experiments, in parallel with vibrational analyses are underway to characterize the products of FeBMb(NO) complexes exposure to NO.
Supplementary Material
Footnotes
This work was supported by Grants GM74785 (P.M.-L.) and GM06221 (Y.L.) from the National Institutes of Health and a Vertex pharmaceutical scholarship for T.H.
Abbreviations: NOR, nitric oxide reductase; HCO, heme-copper oxidase; swMb, sperm whale myoglobin; FeBMb1, swMb L29H/F43H/V68E variant; FeBMb2, swMb L29H/F43H/V68E/I107E variant; CuBMb, swMb L29H/F43H variant; RR, resonance Raman; EPR, electron paramagnetic resonance; FTIR, Fourier transform infra-red; 6C/5C, 6-coordinate/5-coordinate; HS/LS, high-spin/low-spin.
SUPPORTING INFORMATION AVAILABLE: Room temperature UV-vis absorption and RR spectra of reduced apo-, FeII-, ZnII-, and CuI-FeBMb2 before and after addition of 1 equiv NO; EPR spectra of apo-, FeII-, ZnII-, and CuI-FeBMb(NO) at 30 and 4.2 K; low-temperature UV-vis spectra of ZnII-, and CuI-FeBMb2(NO); room temperature UV-vis spectra of CuI-FeBMb2(CO)2 and CuI-FeBMb2(CO)(NO); low-temperature FTIR spectra of CuI-FeBMb2(CO)2, CuIFeBMb2(CO)(NO), and FeII-FeBMb2(NO). This material is available free of charge via the Internet at http://pus.acs.org.
REFERENCES
- 1.Wasser IM, de Vries S, Moënne-Loccoz P, Schroder I, Karlin KD. Nitric oxide in biological denitrification: Fe/Cu metalloenzyme and metal complex NOx redox chemistry. Chem. Rev. 2002;102:1201–1234. doi: 10.1021/cr0006627. [DOI] [PubMed] [Google Scholar]
- 2.Zumft WG. Nitric oxide reductases of prokaryotes with emphasis on the respiratory, heme-copper oxidase type. J. Inorg. Biochem. 2005;99:194–215. doi: 10.1016/j.jinorgbio.2004.09.024. [DOI] [PubMed] [Google Scholar]
- 3.Moënne-Loccoz P. Spectroscopic characterization of heme iron-nitrosyl species and their role in NO reductase mechanisms in diiron proteins. Natl. Prod. Rep. 2007;24:610–620. doi: 10.1039/b604194a. [DOI] [PMC free article] [PubMed] [Google Scholar]
- 4.Barraud N, Hassett DJ, Hwang SH, Rice SA, Kjelleberg S, Webb JS. Involvement of nitric oxide in biofilm dispersal of Pseudomonas aeruginosa. J. Bacteriol. 2006;188:7344–7353. doi: 10.1128/JB.00779-06. [DOI] [PMC free article] [PubMed] [Google Scholar]
- 5.Stevanin TM, Laver JR, Poole RK, Moir JW, Read RC. Metabolism of nitric oxide by Neisseria meningitidis modifies release of NO-regulated cytokines and chemokines by human macrophages. Microbes. Infect. 2007;9:981–987. doi: 10.1016/j.micinf.2007.04.002. [DOI] [PubMed] [Google Scholar]
- 6.Hino T, Matsumoto Y, Nagano S, Sugimoto H, Fukumori Y, Murata T, Iwata S, Shiro Y. Structural basis of biological N2O generation by bacterial nitric oxide reductase. Science. 2010;330:1666–1670. doi: 10.1126/science.1195591. [DOI] [PubMed] [Google Scholar]
- 7.Butler C, Forte E, Maria Scandurra F, Arese M, Giuffre A, Greenwood C, Sarti P. Cytochrome bo3 from Escherichia coli: the binding and turnover of nitric oxide. Biochem. Biophys. Res. Commun. 2002;296:1272–1278. doi: 10.1016/s0006-291x(02)02074-0. [DOI] [PubMed] [Google Scholar]
- 8.Fujiwara T, Fukumori Y. Cytochrome cb-type nitric oxide reductase with cytochrome c oxidase activity from Paracoccus denitrificans ATCC 35512. J. Bacteriol. 1996;178:1866–1871. doi: 10.1128/jb.178.7.1866-1871.1996. [DOI] [PMC free article] [PubMed] [Google Scholar]
- 9.Hayashi T, Lin IJ, Chen Y, Fee JA, Moënne-Loccoz P. Fourier transform infrared characterization of a CuB-nitrosyl complex in cytochrome ba3 from Thermus thermophilus: relevance to NO reductase activity in heme-copper terminal oxidases. J. Am. Chem. Soc. 2007;129:14952–14958. doi: 10.1021/ja074600a. [DOI] [PMC free article] [PubMed] [Google Scholar]
- 10.Hayashi T, Lin MT, Ganesan K, Chen Y, Fee JA, Gennis RB, Moënne-Loccoz P. Accommodation of two diatomic molecules in cytochrome bo3: insights into NO reductase activity in terminal oxidases. Biochemistry. 2009;48:883–890. doi: 10.1021/bi801915r. [DOI] [PMC free article] [PubMed] [Google Scholar]
- 11.Ohta T, Kitagawa T, Varotsis C. Characterization of a bimetallic-bridging intermediate in the reduction of NO to N2O: a density functional theory study. Inorg. Chem. 2006;45:3187–3190. doi: 10.1021/ic050991n. [DOI] [PubMed] [Google Scholar]
- 12.Pinakoulaki E, Ohta T, Soulimane T, Kitagawa T, Varotsis C. Detection of the His-heme Fe2+-NO species in the reduction of NO to N2O by ba3-oxidase from thermus thermophilus. J. Am. Chem. Soc. 2005;127:15161–15167. doi: 10.1021/ja0539490. [DOI] [PubMed] [Google Scholar]
- 13.Blomberg LM, Blomberg MR, Siegbahn PE. A theoretical study on nitric oxide reductase activity in a ba3-type heme-copper oxidase. Biochim. Biophys. Acta. 2006;1757:31–46. doi: 10.1016/j.bbabio.2005.11.004. [DOI] [PubMed] [Google Scholar]
- 14.Blomberg LM, Blomberg MR, Siegbahn PE. Reduction of nitric oxide in bacterial nitric oxide reductase-a theoretical model study. Biochim Biophys Acta. 2006;1757:240–252. doi: 10.1016/j.bbabio.2006.04.008. [DOI] [PubMed] [Google Scholar]
- 15.Yeung N, Lin YW, Gao YG, Zhao X, Russell BS, Lei L, Miner KD, Robinson H, Lu Y. Rational design of a structural and functional nitric oxide reductase. Nature. 2009;462:1079–1082. doi: 10.1038/nature08620. [DOI] [PMC free article] [PubMed] [Google Scholar]
- 16.Lin YW, Yeung N, Gao YG, Miner KD, Tian S, Robinson H, Lu Y. Roles of glutamates and metal ions in a rationally designed nitric oxide reductase based on myoglobin. Proc. Natl. Acad. Sci. U.S.A. 2010;107:8581–8586. doi: 10.1073/pnas.1000526107. [DOI] [PMC free article] [PubMed] [Google Scholar]
- 17.Kitagawa T, Nagai K, Tsubaki M. Assignment of the Fe-Ne (His F8) stretching band in the resonance Raman spectra of deoxy myoglobin. FEBS Lett. 1979;104:376–378. doi: 10.1016/0014-5793(79)80856-x. [DOI] [PubMed] [Google Scholar]
- 18.Argade PV, Sassaroli M, Rousseau DL, Inubushi T, Ikeda-Saito M, Lapidot A. Confirmation of the assignment of the Iron-histidine stretching mode in myoglobin. J. Am. Chem. Soc. 1984;106:6593–9596. [Google Scholar]
- 19.Lu C, Zhao X, Lu Y, Rousseau DL, Yeh SR. Role of copper ion in regulating ligand binding in a myoglobin-based cytochrome c oxidase model. J. Am. Chem. Soc. 2010;132:1598–1605. doi: 10.1021/ja907777f. [DOI] [PMC free article] [PubMed] [Google Scholar]
- 20.Bolard J, Garnier A. Circular dichroism studies of myoglobin and cytochrome c derivatives. Biochim. Biophys. Acta. 1972;263:535–549. doi: 10.1016/0005-2795(72)90034-7. [DOI] [PubMed] [Google Scholar]
- 21.Szabo A, Perutz MF. Equilibrium between six- and five-coordinated hemes in nitrosylhemoglobin: interpretation of electron spin. resonance spectra. Biochemistry. 1976;15:4427–4428. doi: 10.1021/bi00665a013. [DOI] [PubMed] [Google Scholar]
- 22.Benko B, Yu NT. Resonance Raman studies of nitric oxide binding to ferric and ferrous hemoproteins: detection of Fe(III)-NO stretching, Fe(III)-N-O bending, and Fe(II)-N-O bending vibrations. Proc. Natl. Acad. Sci. U. S. A. 1983;80:7042–7046. doi: 10.1073/pnas.80.22.7042. [DOI] [PMC free article] [PubMed] [Google Scholar]
- 23.Tsubaki M, Yu NT. Resonance Raman investigation of nitric oxide bonding in nitrosylhemoglobin A and -myoglobin: detection of bound N-O stretching and Fe-NO stretching vibrations from the hexacoordinated NO-heme complex. Biochemistry. 1982;21:1140–1144. doi: 10.1021/bi00535a005. [DOI] [PubMed] [Google Scholar]
- 24.Lu S, Suharti, de Vries S, Moënne-Loccoz P. Two CO molecules can bind concomitantly at the diiron site of NO reductase from Bacillus azotoformans. J. Am. Chem. Soc. 2004;126:15332–15333. doi: 10.1021/ja045233v. [DOI] [PubMed] [Google Scholar]
- 25.Miller LM, Pedraza AJ, Chance MR. Identification of conformational substates involved in nitric oxide binding to ferric and ferrous myoglobin through difference Fourier transform infrared spectroscopy (FTIR) Biochemistry. 1997;36:12199–12207. doi: 10.1021/bi962744o. [DOI] [PubMed] [Google Scholar]
- 26.Alben JO, Moh PP, Fiamingo FG, Altschuld RA. Cytochrome oxidase a3 heme and copper observed by low-temperature Fourier transform infrared spectroscopy of the CO complex. Proc. Natl. Acad. Sci. U. S. A. 1981;78:234–237. doi: 10.1073/pnas.78.1.234. [DOI] [PMC free article] [PubMed] [Google Scholar]
- 27.Stong JD, Burke JM, Daly P, Wright P, Spiro TG. Resonance Raman spectra of nitrosyl heme proteins and of porphyrin analogues. J. Am. Chem. Soc. 1980;102:5815–5819. [Google Scholar]
- 28.Zeng W, Silvernail NJ, Wharton DC, Georgiev GY, Leu BM, Scheidt WR, Zhao J, Sturhahn W, Alp EE, Sage JT. Direct probe of iron vibrations elucidates NO activation of heme proteins. J. Am. Chem. Soc. 2005;127:11200–11201. doi: 10.1021/ja051052x. [DOI] [PMC free article] [PubMed] [Google Scholar]
- 29.Lehnert N, Sage JT, Silvernail N, Scheidt WR, Alp EE, Sturhahn W, Zhao J. Oriented single-crystal nuclear resonance vibrational spectroscopy of [Fe(TPP)(MI)(NO)]: quantitative assessment of the trans effect of NO. Inorg. Chem. 2010;49:7197–7215. doi: 10.1021/ic1010677. [DOI] [PMC free article] [PubMed] [Google Scholar]
- 30.Coyle CM, Vogel KM, Rush TS, 3rd, Kozlowski PM, Williams R, Spiro TG, Dou Y, Ikeda-Saito M, Olson JS, Zgierski MZ. FeNO structure in distal pocket mutants of myoglobin based on resonance Raman spectroscopy. Biochemistry. 2003;42:4896–4903. doi: 10.1021/bi026395b. [DOI] [PubMed] [Google Scholar]
- 31.Thomas MR, Brown D, Franzen S, Boxer SG. FTIR and resonance Raman studies of nitric oxide binding to H93G cavity mutants of myoglobin. Biochemistry. 2001;40:15047–15056. doi: 10.1021/bi011440l. [DOI] [PubMed] [Google Scholar]
- 32.Ibrahim M, Xu C, Spiro TG. Differential sensing of protein influences by NO and CO vibrations in heme adducts. J. Am. Chem. Soc. 2006;128:16834–16845. doi: 10.1021/ja064859d. [DOI] [PMC free article] [PubMed] [Google Scholar]
- 33.Vogel KM, Kozlowski PM, Zgierski MZ, Spiro TG. Determinants of the FeXO (X = C, N, O) vibrational frequencies in heme adducts from experiment and density function theory. J. Am. Chem. Soc. 1999;121:9915–9921. [Google Scholar]
- 34.Hendriks JH, Jasaitis A, Saraste M, Verkhovsky MI. Proton and electron pathways in the bacterial nitric oxide reductase. Biochemistry. 2002;41:2331–2340. doi: 10.1021/bi0121050. [DOI] [PubMed] [Google Scholar]
- 35.Kumita H, Matsuura K, Hino T, Takahashi S, Hori H, Fukumori Y, Morishima I, Shiro Y. NO reduction by nitric-oxide reductase from denitrifying bacterium Pseudomonas aeruginosa: characterization of reaction intermediates that appear in the single turnover cycle. J. Biol. Chem. 2004;279:55247–55254. doi: 10.1074/jbc.M409996200. [DOI] [PubMed] [Google Scholar]
- 36.Tomita T, Hirota S, Ogura T, Olson JS, Kitagawa T. Resonance Raman investigation of Fe-N-O structrue of nitrosylheme in myoglobin and its mutants. J. Phys. Chem. B. 1999;103:7044–7054. [Google Scholar]
Associated Data
This section collects any data citations, data availability statements, or supplementary materials included in this article.


