

Abstract
Subcellular Ca2+ signals control a variety of responses in the liver. For example, mitochondrial Ca2+ regulates apoptosis while Ca2+ in the nucleus regulates cell proliferation. Since apoptosis and cell growth can be related, we investigated whether mitochondrial Ca2+ also affects liver regeneration. The Ca2+ buffering protein, Parvalbumin (PV), targeted to the mitochondrial matrix and fused to green fluorescent protein (PV-MITO-GFP) was expressed in the SKHep1 liver cell line. This construct properly localized to and effectively buffered Ca2+ signals in the mitochondrial matrix. Additionally, expression of PV-MITO-GFP reduced apoptosis induced by both the intrinsic and extrinsic pathways. The reduction in cell death correlated with increased expression of anti-apoptotic genes bcl-2, mcl-1, and bcl-xL, and decreased expression of the pro-apoptotic genes p53, bax, apaf-1 and caspase-6. PV-MITO-GFP was also expressed in hepatocytes in vivo using an adenoviral delivery system. Buffering mitochondrial Ca2+ in hepatocytes accelerated liver regeneration after partial hepatectomy, an effect that was associated with increased expression of Bcl-2 and decreased expression of Bax.
Conclusion
Together, these results reveal an essential role for mitochondrial Ca2+ in hepatocyte proliferation and liver regeneration, which may be mediated by regulating apoptosis.
Keywords: Intracellular Ca2+, cell proliferation, parvalbumin
INTRODUCTION
Liver regeneration is a complex process triggered by acute damage to the organ which can be recapitulated experimentally by chemical or surgical injury that results in loss of parenchymal cells, the hepatocytes (1). After partial hepatectomy (PH), restoration of liver mass is achieved by massive proliferation of hepatocytes, which switch from a quiescent to a proliferative phenotype. This cell growth response is driven by a number of cytokines and growth factors including IL-6 (2), tumor necrosis factor (TNF) (3), hepatocyte growth factor (HGF) (4), and epidermal growth factor (EGF). Ca2+ signaling is one of the pathways activated during liver regeneration, and growth factors and hormones that promote Ca2+ release in hepatocytes such as HGF, EGF and vasopressin are potent mitogens for this cell type (5–7).
Ca2+ signaling regulates a variety of cellular functions in liver, ranging from bile secretion to cell proliferation (8, 9). This varied ability is closely related to the subcellular compartments where Ca2+ is released (10). For example, peri-canalicular increases in Ca2+ regulate targeting and canalicular insertion of Mrp2 (8), whereas nuclear Ca2+ signals regulate proliferation in liver cell lines (9). Mitochondria also participate in Ca2+ signaling. Mitochondrial Ca2+ (Ca2+mit) signals depend upon cytosolic Ca2+ because there is close association between inositol 1,4,5-trisphosphate receptors (InsP3Rs) within the endoplasmic reticulum (ER) and mitochondria (11), which permits transmission of Ca2+ from the ER to the mitochondrial matrix (12). Ca2+mit signals regulate apoptosis in various cell systems (13, 14). This form of cell death is controlled in part by members of the Bcl-2 protein family, which directly modulates Ca2+ signaling (15). Pro-apoptotic members of this family induce cell death through either enhancement of Ca2+ release from the ER or by facilitating Ca2+ entry into mitochondria, which ultimately causes cytochrome C release and caspase activation. Conversely, pro-survival Bcl-2 proteins such as Bcl-2, Bcl-xL and Mcl-1 work either by direct modulation of the activity of the InsP3R or by reducing Ca2+ entry into mitochondria preventing the generation of pro-apoptotic Ca2+ signals (16–18). However, this interplay between mitochondrial Ca2+ and apoptosis has not been studied in the liver in the context of liver regeneration. Therefore, we investigated the role of mitochondrial Ca2+ in the regulation of liver regeneration.
MATERIAL AND METHODS
Cell Lines and Materials
SKHep1 and HEK-293 cell lines were obtained from ATCC (Manassas, VA). Cells were grown at 37°C with 5% CO2: 95% air in Dulbecco’s modified Eagle’s medium supplemented with 1% penicillin-streptomycin and 10% heat-inactivated fetal bovine serum, all from Gibco (Grand Island, NY). pAc1GFP1-Mito vector was from Clontech (Moutain View, CA). Mitotracker Red, Rhod-2/AM, SuperScript First-Strand Synthesis System for RT-PCR, PCR SuperMix, lipofectamine, caspase-9 detection kit, and antibodies against Bax, Bcl-2, c-Met were from Invitrogen (Carlsbad, CA). Antibodies to β-actin and anti-gama tubulin, ATP and TNF-alpha were from Sigma Aldrich (St. Louis, MO). Antibodies to PCNA and EGFR were from Santa Cruz (Santa Cruz, CA). and Cell Signaling Technology (Boston, MA). Caspase-3 and caspase-8 detection kits were from BD Biosciences (San Jose, CA USA). AIF reagent was from Santa Cruz (Santa Cruz, CA). Staurosporine was from Calbiochem (San Diego, CA). All others reagents were of the highest quality commercially available.
Animals
Male Holtzmman rats (40–50 g) obtained from CEBIO (Federal University of Minas Gerais, Brazil) were used for all studies. Animals were maintained on a standard diet and housed under a 12 h light-dark cycle. The investigation conforms to the Guide for the Care and Use of Laboratory Animals published by the National Institutes of Health (publication 85–23, revised 1996).
Plasmid and adenovirus constructs
cDNA for the Ca2+ binding protein parvalbumin (PV) was sub-cloned between the BamHI and AgeI restriction sites of pAc1GFP1-Mito vector. The resulting vector encodes PV fused to mitochondrial targeting sequence (MTS) and GFP, and was denoted PV-MITO-GFP. A recombinant adenovirus was used to deliver pAd-PV-MITO-GFP. The virus was amplified using HEK-293 cells and purified with VivaPure AdenoPack kit, Sartorius (Goettingen, Germany) according to the manufacturer’s protocol. 3×10⁹ pfu of pAd-PV-MITO-GFP was injected into rats by tail-vein infusion, and the livers were processed at the indicated times.
Detection of Mitochondrial Ca2+ signals
Cells were perifused with ATP (1 μM) and mitochondrial Ca2+ was monitored in SKHep1 cells using time-lapse confocal microscopy, as previously published (14). Transfected cells were identified by GFP fluorescence. Mitotracker Red and GFP co-localization images were collected as described (14)
Immunoblots
Protein lysates from SKHep1 cells or total liver were subject to SDS-PAGE electrophoresis and transferred to PVDF membranes. Westerns were developed with ECL plus reagent. Densitometry was performed using ImageJ software (NIH, Bethesda, MD).
Flow cytometry
To determine the proportion of dead cells, control SKHep1 and cells tranfected with MITO-GFP or PV-MITO-GFP were stimulated with 300 nM staurosporine (STA), for 6 hours. Cells were trypsinized, fixed in 70% ethanol followed by incubation with 0.5mg/ml propidium iodide (PI). Cells were analyzed for GFP and PI uorescence in a Becton Dickinson FACS Calibur.
Real-Time PCR
Total RNA was isolated from SKHep1 cells using TRIzol and cDNA synthesized using SuperScript II kit (Invitrogen). DNA templates were amplified by real time PCR on the StepOnePlus™ Real-Time PCR Systems (Applied Biosystems, CA) using the SYBR green method, as described (19). β-actin was used as an internal control to normalize variations incDNA content. Experiments were performedin triplicate for each data point. Sequences of the primers are listed in supplementary Table 1.
Apoptosis assay
Apoptosis through the intrinsic pathway was induced by treatment with 300 nM STA for 6 hours. To induce apoptosis through the extrinsic pathway cells were stimulated with 100 ng/ml TNF-alpha for 24 hours. Apoptosis was measured using caspase-3, caspase-8, and caspase-9 kits with colorimetric detection, as previously described (9, 19). Immunofluorescence for AIF was used to evaluate the caspase-independent intrinsic pathway in cells treated with 300 nM STA for 6 hours. Images were obtained using a Zeiss LSM 510 confocal microscope.
Measurement of BrdU incorporation
Cell proliferation was measured by BrdU incorporation using an enzyme linked immunosorbent assay (Roche Applied Science), according to the manufacturer’s instructions. SKHep1 cells were plated in 96-well culture plates, transfected with MITO-GFP, or PV-MITO-GFP, and starved for 24 hours. Cells were then treated for 6 hours with 300 nM STA and 18 hours later incubated with BrdU labeling solution. BrdU incorporation was measured with a multiplate reader.
Intravital and liver section confocal microscopy
Rat liver intravital microscopy was performed as described previously with modifications (20). Briefly, rats were anesthetized by i.p. injection of a mixture of 10mg/kg xylazine hydrochloride and 200 mg/kg ketamine hydrochloride and placed in a right lateral position on an adjustable microscope stage. A lateral abdominal incision was made to expose the liver surface, which was covered with a coverslip. The liver was visualized using an intravital multiphoton/confocal microscopy system based on a modified Olympus confocal microscope (FV300) in an up-right configuration (BX51 Microscope). Images were obtained with the confocal laser at 488 nm or via multiphoton excitation at 840 nm using a 10X/0.30 UplanFLN objective. For frozen liver section analysis, samples from rats injected with adenovirus or saline were fixed, dehydrated in sucrose and mounted for visualization of GFP positive cells using a Zeiss LSM 510 confocal microscope.
Partial hepatectomy, liver histology, and biochemical analysis
Two-thirds hepatectomy (PH) was performed on adult male Holztman rats as described (21). One day before PH, the adenovirus Ad-PV-MITO-GFP was tail-vein injected. For histology, eight-micrometer-thick liver cryostat sections were processed 24, 48 and 72 hours post PH for PCNA and hematoxylin-eosin staining. Serum samples were used to measure albumin, conjugated and total bilirubin, aminotransferases (AST, ALT), and alkaline phosphatase using commercial fluorimetric kits according to the manufacturer’s instructions.
Scintigraphic imaging
Liver scintigraphies were performed using phytate labeled with technetium-99m (99mTc-phytate). Rats received 1.48 MBq of 99mTc-phytate via the tail vein. Fifteen minutes after administration of radiopharmaceutical, animals were anesthetized and placed in the prone position on a gamma camera equipped with a low-energy collimator (Nuclide™ TH 22, Mediso, Hungary). Ten-minute static planar images were acquired using a 256 × 256-pixel matrix. Liver area (mm2) was determined by the amount of radioactivity uptake in the organ.
Determination of myeloperoxidase (MPO) activity
Neutrophil accumulation in the liver was quantified by assaying MPO activity as previously described (22). MPO activity was assayed by measuring the variation in optical density (O.D.) at 450 nm using tetramethylbenzidine (1.6 mM) and H2O2 (0.5 mM). Results were expressed as “relative neutrophil number” and were calculated by comparing the O.D. of tissue supernatant with the O.D. of a standard curve of neutrophil (>95% purity).
Statistics analysis
Results are expressed as mean values±S.E.M. Prism (GraphPad Software, San Diego, CA) was used for data analysis. Statistical significance was tested using Student’s t test or 1-way ANOVA followed by Bonferroni post-tests, and p value <0.05 was taken to indicate statistical significance.
RESULTS
Targeted parvalbumin as a mitochondrial Ca2+ buffer
Parvalbumin fused to a mitochondrial targeting sequence (MTS) and GFP was developed as a genetically encoded Ca2+mit buffer. GFP targeted to the mitochondrial matrix was used as a control (Figure 1A). PV was effectively expressed in SKHep1 cells transfected with PV-MITO-GFP as demonstrated by immunoblotting (Figure 1B). Moreover PV was correctly targeted to the mitochondrial matrix, as demonstrated by co-localization of GFP and MitoTracker Red (Figure 1C). To evaluate Ca2+ buffering by this construct, SKHep1 cells were stimulated with 1 μM ATP and Ca2+mit was measured by confocal microscopy of rhod-2/AM. ATP elicited a robust increase in Ca2+mit in control cells or cells expressing GFP alone, but this was reduced by ~ 90% in cells expressing PV in mitochondria (n=3, p<0.001) (Figure 2). These results demonstrate that PV-MITO-GFP is correctly targeted to the mitochondrial matrix and efficiently buffers agonist-induce Ca2+mit signals.
Figure 1. Expression and mitochondrial localization of targeted PV-GFP fusion proteins.
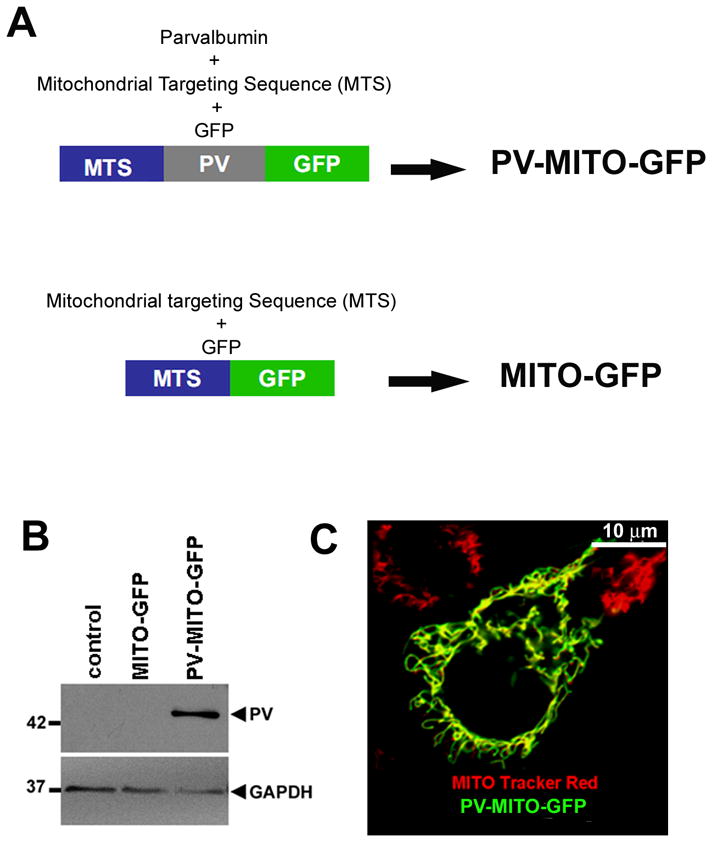
A. Schematic view of mitochondrial PV expression and control vectors. B. Exogenous expression of PV in SKHep1 cells. PV-MITO-GFP leads to expression of the 42-KDa fusion protein. C. Subcellular localization of PV-MITO-GFP. Green indicates GFP, red indicates mitochondria staining with MitoTracker Red, and yellow indicates co-localization of the two signals. In transfected SKHep-1 cells, expression of PV-MITO-GFP is restricted to mitochondria.
Figure 2. PV buffers mitochondrial Ca2+ signaling.

A. Confocal images of SKHep1 cells expressing PV-MITO-GFP (green) loaded with the Ca2+mit indicator rhod-2/AM (red). B. Representative changes in mitochondrial Ca2+ signals over time induced by ATP (1μM) in control SKHep1 cells or cells transfected with the indicated vectors. Ca2+ signals were attenuated in cells expressing PV in mitochondria. C. Peak Ca2+mit signal observed in three separate experiments for control SKHep1 cells, cells transfected with MITO-GFP, and cells transfected with PV-MITO-GFP (p<0.001 relative to control cells, n≥70 cells for each experimental condition).
Mitochondrial Ca2+ buffering attenuates apoptotic cell death
Ca2+mit plays a crucial role in apoptosis, so we investigated the effect of buffering Ca2+mit on cell death. Treatment with staurosporine (STA) increased the percentage of dead cells to 19.1±3.7% compared to 11.4±0.7% in unstimulated cells (p<0.001, n=3). Upon Ca2+mit buffering, cell death induced by STA was reduced to 7.7±2.2%, while cell death remained at high levels, 25.7±1.8%, in cells transfected with MITO-GFP (p<0.001, n=3), (Figure 3A). The role of Ca2+mit in cell death was further characterized by evaluating the intrinsic or extrinsic apoptotic pathways, because the two pathways converge at the level of Ca2+mit signaling (23). The intrinsic pathway was investigated by measurement of caspase-9 and caspase-3 activities in SKHep1cells stimulated with 100 nM STA for 6 hours. Caspase-9 activity was increased to 0.16±0.06% after STA treatment compared to 0.1±0.02% in control cells, and this was blocked by expression of PV-MITO-GFP (p<0.001, n=3), (Figure 3B). Similarly, STA-induced caspase-3 activity was inhibited by buffering Ca2+mit (Figure 3C). Caspase-3 activity was increased from 43.0±5.8 nmol/mg protein in unstimulated cells to 97.5±9.2 nmol/mg protein in the STA-treated cells. STA increased caspase-3 activity in MITO-GFP cells to 126.2±22.2 nmol/mg protein, while caspase-3 activity was 54.4±6.4 nmol/mg protein in SKHep1 cells expressing PV-MITO-GFP (p<0.001, n=3), (Figure 3C). Next, we investigated whether the caspase-independent intrinsic pathway was also affected by buffering of Ca2+mit. Confocal immunofluorescence of apoptosis inducing factor (AIF) demonstrated that targeting of PV to mitochondria reduced expression of this pro-apoptotic factor compared to SKHep1 cells transfected with the control construct MITO-GFP (Figure 3D). These data show that expression of PV in mitochondria protects cells from STA-induced cell death through the caspase-dependent and caspase-independent intrinsic apoptotic pathway. We also investigated whether PV-MITO affected the extrinsic apoptotic pathway. Caspase-8 and caspase-3 activities were measured in control cells and cells transfected with PV-MITO-GFP or MITO-GFP treated with 100ng/ml TNF-alpha for 6 hours. TNF-alpha increased caspase-8 and caspase-3 activity to 246.7±15.2 nmol/mg protein and 63.3±10.4 nmol/mg protein compared to 72.0±2.6 nmol/mg protein and 25±5 nmol/mg protein in control conditions, respectively. PV-MITO-GFP expression reduced TNF alpha-dependent caspase-8 activity to 150±20 nmol/mg protein versus 296.7±30.5 nmol/mg protein in MITO-GFP cells, and it completely abolished caspase-3 activity (p<0.001, n=3), (Figure 3E–F). These data demonstrate that buffering Ca2+mit also prevents apoptotic cell death through the extrinsic pathway.
Figure 3. Buffering mitochondrial Ca2+ reduces cell death.

Control SKHep1 cells and cells transfected with MITO-GFP or PV-MITO-GFP were treated with 100 nM staurosporine (STA) or 100 ng/ml TNF-alpha for 6 hours to activate intrinsic or extrinsic apoptotic pathways, respectively. A. STA increase cell death in non-transfected SKHep1 (p<0.001 relative to controls), while cell death was reduced by mitochondrial Ca2+ buffering (p<0.001 relative to MITO-GFP transfected cells in the presence of STA; n=3). B–C. Expression of PV-MITO-GFP reduced caspase-depended intrinsic apoptotic pathway. Buffering mitochondrial Ca2+ reduced caspase-9 and caspase-3 activities (p<0.001 relative to MITO-GFP transfected cells plus STA; (n=3). D. Expression of PV-MITO-GFP reduced the activation of the caspase-independent intrinsic pathway. Representative confocal images of SKHep1 cells transfected with MITO-GFP or PV-MITO-GFP (green), and stained with antibody to AIF (red). Targeting PV to mitochondria reduced AIF expression. E–F. Expression of PV-MITO-GFP inhibited apoptosis through the extrinsic pathway. Expression of PV-MITO-GFP decreased caspase-8 and caspase-3 activities (p<0.001 relative to MITO-GFP transfected cells plus TNF-alpha; n=3).
Apoptosis can be modulated through expression of anti- and pro-apoptotic genes (24) so we investigated whether alterations of Ca2+mit handling affect expression of such genes. Real-time PCR showed that buffering mitochondrial Ca2+ reduced expression of several pro-apoptotic genes under baseline or STA-treated conditions (Figure 4A–D). Expression of each gene was normalized to its expression level in unstimulated, non-transfected cells. Expression of p53 was reduced to 0.72±0.03 a.u in PV-MITO-GFP cells compared to control (p<0.001, n=3). After STA treatment, the expression of p53 increased to 2.2±0.1 a.u in untransfected cells, while in PV-MITO-GFP cells, it remained at 1.08±0.06 a.u (p<0.001, n=3), (Figure 4A). Expression of bax was reduced to 0.41 ± 0.04 a.u in PV-MITO-GFP, compared to control (p<0.001), and after STA treatment bax expression was 2.0±0.2 a.u in non-transfected cells, versus 0.72±0.06 a.u in PV-MITO-GFP (p<0.001, n=3), (Figure 4B). Although apaf-1 expression was not altered between unstimulated control and transfected cells, after STA treatment, apaf-1 expression increased to 1.69±0.07 a.u in control cells and remained at 0.83±0.10 a.u in PV-MITO-GFP (p<0.001, n=3), (Figure 4C). Baseline caspase-6 expression was reduced to 0.75±0.036 a.u in PV-MITO-GFP, compared to control (p<0.001), and increased to 1.98±0.09 a.u in non-transfected cells, versus 0.97±0.03 a.u in PV-MITO-GFP (p<0.001, n=3), (Figure 4D). Conversely the expression of genes encoding anti-apoptotic proteins was up-regulated after Ca2+mit buffering (Figure 4E–G). Bcl-2 gene expression increased to 1.21±0.13 a.u in PV-MITO-GFP compared to control (p<0.001, n=3), and remained at higher expression levels upon STA treatment (1.19±0.17 versus 0.63±0.09 a.u in control, p<0.001, n=3), (Figure 4E). Similarly, the expression of mcl-1 and bcl-xL genes increased to 1.2±0.06 a.u and 1.41±0.10 a.u in PV-MITO-GFP, respectively, compared to 1.0±0.05 a.u and 1.0±0.06 a.u in control (p<0.001, n=3). After STA treatment, the expression levels of mcl-1 and bcl-xL remained high, 1.18±0.06 a.u and 1.26±0.10 a.u, respectively, in PV-MITO-GFP versus 0.46±0.02 a.u and 0.73±0.06 a.u in control (p<0.001, n=3), (Figure 4F–G). To examine whether expression of these genes was also altered at the protein level in SKHep1 cells expressing PV-MITO-GFP, immunoblots for the anti-apoptotic protein Bcl-2 and the pro-apoptotic protein Bax were performed (Figure 4H–J). Expression of Bcl-2 protein increased to 1.15±0.09 a.u in cells expressing PV-MITO-GFP, compared to 0.56±0.08 a.u in control cells, (p<0.001, n=3), while expression of Bax protein decreased to 0.84±0.09 a.u in cells expressing PV-MITO-GFP compared to 1.14±0.09 a.u in control cells, (p<0.05, n=3). Similar results were observed in cells treated with STA. These findings suggest that buffering Ca2+mit directs the expression ratio of pro- and anti- apoptotic protein members towards a predominant anti-apoptotic pathway.
Figure 4. Mitochondrial Ca2+ buffering alters expression levels of pro- and anti-apoptotic genes.

Control SKHep1 cells and cells transfected with either MITO-GFP or PV-MITO-GFP were incubated in the presence or absence of 300 nM STA for 6 hours. A–D. Upon STA treatment, buffering mitochondrial Ca2+ down-regulated the expression levels of p53, bax, apaf-1, and caspase-6 (p<0.001 relative to control cells treated with STA). E–G. After STA treatment, buffering mitochondrial Ca2+ upregulates the expression of bcl-2, mcl-1, and bcl-xL (p<0.001 relative to controls). H. Immunoblots demonstrate that buffering mitochondrial Ca2+ increases the expression of Bcl-2 and decreases expression of Bax. I–J. Densitometric analysis shows increased expression of Bcl-2 and reduction of Bax relative to controls (p<0.001, n=3).
To determine whether the decrease in cell death observed in PV-MITO-GFP cells was associated with changes in proliferation, SKHep1 cells were synchronized in G0 by serum withdrawal, transfected with the target constructs, and assayed for bromodeoxyuridine (BrdU) incorporation. No increase in cell proliferation was observed in PV-MITO-GFP cells compared with control cells or cells expressing MITO-GFP (supporting Figure 1). However, under agonist-induced cell death, BrdU uptake was smaller in cells expressing MITO-GFP, compared with cells that express PV in the mitochondria (51.1±5.3% in MITO-GFP versus 79.4±3.6% in PV-MITO-GFP), (p<0.001, n=3). Together, these results suggest that buffering Ca2+mit preferentially prevents cells from undergoing apoptosis, rather than stimulating proliferation.
Mitochondrial Ca2+ buffering accelerates liver mass restoration after partial hepatectomy
Liver regeneration requires both increased cell proliferation and reduced apoptosis (25). The role of Ca2+mit signaling in apoptosis is well known, but its role in liver regeneration has not been studied. Therefore, we investigated the involvement of Ca2+mit on liver growth after two-thirds hepatectomy (PH). Adenoviruses encoding PV-MITO-GFP were injected in rats, and GFP fluorescence was used to monitor PV expression in the liver (Figure 5A). PV was expressed throughout the liver lobule (Supporting Figure 2). No fluorescence was observed in livers of animals injected with saline solution. Additionally, no GFP fluorescence was observed in the intestine of animals injected with Ad-PV-MITO-GFP (Supporting Figure 3) demonstrating preferential targeting of the vector to the liver. Confocal images of liver slices showed that PV was highly expressed in the mitochondria of hepatocytes (Figure 5B). Moreover, immunoblot confirmed PV expression in the liver after adenovirus injection, while PV was not expressed in control liver (Figure 5C). Together, these data show that the injected adenoviruses efficiently delivered the Ca2+ buffering construct to hepatocytes in vivo and promoted expression of PV in these cell type.
Figure 5. Targeting PV expression in rat liver.
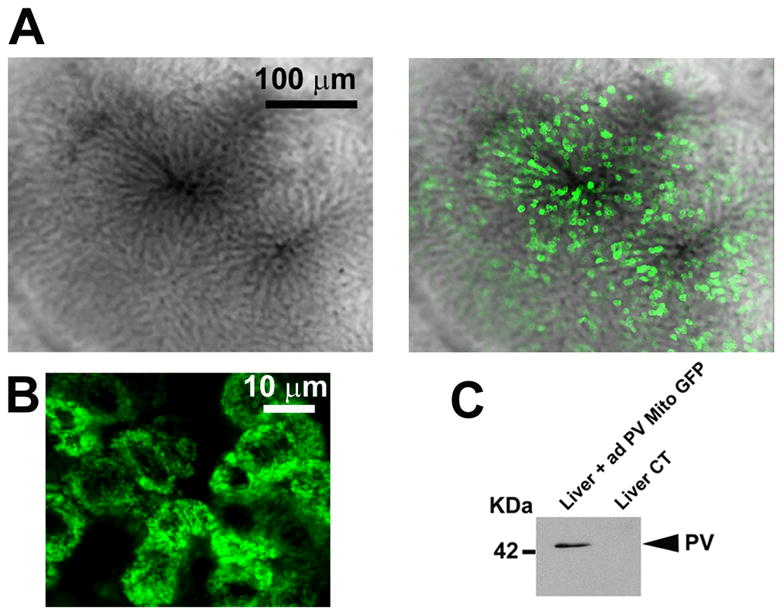
A. Representative intravital confocal images of rat hepatic lobule in an animal infected with AdPV-MITO-GFP shows expression of PV (green) in the liver, two days after adenovirus injection. B. Representative confocal images of liver slices indicating expression of PV (green) in hepatocytes. C. Western blot analysis of PV expression in the liver, two days after adenovirus infection. Tail vein injection of adenovirus in the rats leads to expression of PV in the liver.
To investigate the role of Ca2+mit in liver regeneration, PH was performed one day after Ad-PV-MITO-GFP injection, and liver regeneration was analyzed from 1-4 days after PH. Expression of PV-MITO-GFP significantly increased liver area relative to controls, mainly 24-48 hours after PH (Figure 6). There was no difference in liver area, from day one to day four, in sham-operated animals. However, one day after PH, liver area was significantly smaller in PH rats compared to animals injected with adenovirus (198.1±1.06% in PH versus 257.2±3.4% in PH+Ad-PV-MITO-GFP), (p<0.05, n=3). The difference in liver area was even more pronounced two days after PH (208.2±6.2% in PH versus 340.1±1.8% in PH+Ad-PV-MITO-GFP), (p<0.001, n=3). PCNA labeling of liver slices similarly demonstrated that hepatocyte proliferation is accelerated by buffering of mitochondrial Ca2+, which peaked at day 1 in Ad-PV-MITO + PH (61.2 ± 2.2 %, n=3) when compared to PH animals, which showed maximum PCNA index at day 2 (63.6 ± 4.0 %, n=3). These results indicate that buffering Ca2+mit accelerates liver regeneration after PH. This finding was further validated through measurements of liver/body mass after PH, which also demonstrated that liver regeneration occurred with accelerated kinetics in animals expressing PV in the mitochondria (Figure 7A). One day after PH, the liver/body weight index was significantly smaller in PH rats compared to PH animals injected with adenovirus (54.8±4.3% in PH versus 63.2±12.6% in PH + Ad-PV-MITO-GFP), (p<0.01, n=6). Two days after PH, the liver/body weight index was 72.3±6.9% in PH versus 89.4±8.8% in PH+Ad-PV-MITO-GFP), (p<0.01, n=6). The accelerated regeneration observed in the adenoviral-treated animals was not due to increased inflammation, as demonstrated by measurement of myeloperoxidase activity and histological examination of the livers from PH and PH + Ad-PV-MITO-GFP animals (Supporting Figure 4). Liver weights returned to preoperative levels three days after PH. Liver histology and liver chemistries were similar in control and PV-expressing animals 7 days after PH (Supporting Figures 5–6). These data indicate that Ca2+mit homeostasis is important during liver regeneration.
Figure 6. Scintigraphic imaging of liver area.
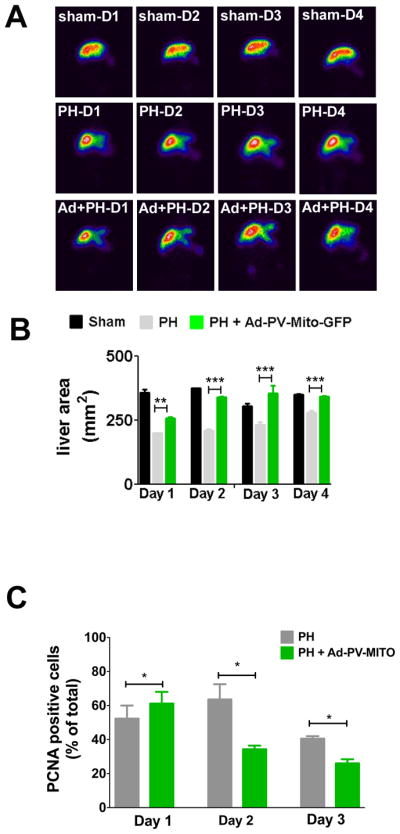
A. Representative scintigraphic images of sham-operated, control and Ad-PV-MITO-GFP rats at days 1–4 after PH. Liver area (mm2) was determined by the amount of radioactivity uptake in the organ. B. Quantification of liver area demonstrates that buffering Ca2+mit accelerates liver growth after PH. C. Proliferation was evaluated by PCNA staining of rat liver slices of PH and Ad-PV-MITO + PH animals. PCNA index was increased at day 1 post hepatectomy in the adenoviral-treated group when compared to PH animals (p<0.05), which reached its peak at day 2. On days 2 and 3, PCNA index was significantly reduced in the group in which Ca2+ was buffered in mitochondria (p<0.001).
Figure 7. Rate of liver regeneration is accelerated by expression of PV-MITO-GFP.

A. Analysis of liver/body weight at the indicated times, from sham-operated and PH rats and/or rats infected with Ad-PV-MITO-GFP. Buffering mitochondrial Ca2+ increases the rate of liver regeneration by 16.7±12.6% one day after PH, by 23.5±8.8% two days after PH compared to PH alone, and reached control levels by day 3 after PH (n=6 animals per condition). B. Bcl-2 and Bax protein expression two days after PH demonstrates that buffering mitochondrial Ca2+ increases the expression of Bcl2 and decreases expression of Bax (n=3). C. Representative western blots of EGFR and c-Met at days 1, 2 and 3 after PH. GAPDH was used as a loading control. D. Densitometric analysis of EGFR and c-Met shows no significant differences in the expression of these two receptors between PH and Ad-PV-MITO + PH livers during the course of liver regeneration.
To examine the mechanism by which Ca2+mit buffering accelerates liver regeneration, we investigated whether expression of the anti-apoptotic protein Bcl-2 and the pro-apoptotic protein Bax was altered in livers of adenovirus injected rats, as was observed in SKHep1 cells. Buffering Ca2+mit increased the expression of Bcl-2 and reduced expression of Bax (Figure 7B). Because growth factor signaling might affect expression of apoptotic proteins during liver regeneration (4), the expression of receptors for two essential liver mitogens, EGFR and c-Met were assessed. Both showed similar levels in PH and PH + Ad-PV-MITO-GFP during the 3 days after PH (Figure 7C–E). Together these results suggest that Ca2+mit buffering promotes liver regeneration by inhibiting apoptosis.
DISCUSSION
Liver regeneration involves multiple factors and pathways (1) which result in increased proliferation and decreased apoptosis of hepatocytes (25). Among the regulatory signaling pathways, a number of Ca2+-mobilizing agonists are known to contribute to liver regeneration (6, 26, 27). Hepatocytes respond to such agonists by altering intracellular Ca2+ signaling that propagates throughout the liver as intercellular Ca2+ waves (28, 29) regulating several process, including liver regeneration (6). Alterations in the Ca2+ signaling machinery have been reported to occur during liver regeneration (30) and although recent studies have examined the role of nuclear and cytosolic Ca2+ signals in cell proliferation (9, 31, 32), the impact of Ca2+mit on liver regeneration has not been directly investigated. Here we examined the role of Ca2+mit during liver regeneration after PH and found that buffering Ca2+mit accelerates regeneration, at least in part by inhibiting apoptosis.
Mitochondria play an integral role in Ca2+ signaling and exert a key function in most forms of apoptosis (33). Our results demonstrate that buffering Ca2+mit inhibits the intrinsic and extrinsic apoptotic pathways, as well as the mitochondrial amplification loop, observed by inhibiting activation of caspase 8, 9 and 3. This amplification is dependent on the release of cytochrome c from the mitochondrial matrix to the cytosol where it can further activate the effector caspases. Although we have not assessed the release of cytochrome C, we found that buffering Ca2+mit inhibits activation of caspase-9 by STA, a phenomenon that is dependent on cytochrome C release from mitochondria (34). We also found that buffering Ca2+mit inhibits caspase-independent but AIF-dependent cell death. This is consistent with previous observations that dysregulation of Ca2+ homeostasis is a prerequisite for AIF-mediated apoptosis (35).
Bcl-2 was the first gene identified as a regulator of apoptosis (36), and subsequently several bcl-2 homologues were discovered that act either as pro or anti-apoptotic effectors. The present data are in agreement with previous observations demonstrating that overexpression of bcl-2, mcl-1, bcl-xL (37, 38) prevent cells from undergoing apoptosis, whereas bax, apaf-1, caspase-6, and p53 function to promote cell death (39). Buffering Ca2+mit also shifted the Bax/Bcl-2 ratio towards the anti-apoptotic profile, resulting in accelerated restitution of liver mass after PH. This is in agreement with recent proteomic data showing that apoptosis pathways are inhibited during liver regeneration (40). Additionally, hepatocyte growth factor, an essential stimulus for liver regeneration, is known to have an anti-apoptotic activity in injured tissue (41). Similarly, tumor necrosis factor, another initiator of liver regeneration, also modulates apoptosis in addition to stimulating hepatocyte proliferation (42). Although our results suggest that buffering Ca2+mit accelerates liver regeneration by inhibiting apoptosis, an effect on cell proliferation cannot be entirely excluded because Bax/Bcl-2 family proteins regulate liver regeneration independent of their role in modulating apoptosis in the liver (43, 44). Moreover, buffering of mitochondrial Ca2+ might also accelerate liver regeneration by modulating ATP production in the mitochondrial matrix because the activity of enzymes of the TCA cycle is regulated by Ca2+ (13).
Heterologous expression of the Ca2+ binding protein PV has been widely used to study the role of Ca2+ signaling in the regulation of the cell cycle. PV was targeted to the nucleus or cytoplasm, and using this approach the role of nuclear Ca2+ in regulating the cell cycle was established in a liver cell line (9). More recently, expression of PV in the cytosol of hepatocytes in vivo demonstrated that cytosolic Ca2+ affects progression through the cell cycle after PH (32). We now show, using PV targeted to the mitochondria, that Ca2+mit also regulates liver regeneration. Future advances in this field should lead to a better understanding of how these various Ca2+ compartments act in an integrated manner to regulate liver regeneration.
Supplementary Material
Control SKHep1 cells and cells transfected with MITO-GFP or PV-MITO-GFP were treated for 6 hours with or without 300 nM STA. Expression of PV in mitochondria did not alter cell proliferation. STA treatment induced cell death in 20.6±6.2% of MITO-GFP cells. Under the same conditions, PV expression prevented cell death, although it did not induce cell proliferation. Results represent the mean±S.E.M. of 3 separate experiments.
Three sequential planes of an intravital confocal Z-stack (160 μM in 2 μM increments) of a rat hepatic lobule 2 days after tail vein injection of Ad-PV-MITO-GFP. PV is shown in green.
Upper panels show representative intravital confocal images of the liver of a rat 2 days after tail vein injection of saline solution. No fluorescence was observed in the liver under the same confocal settings used to capture images from livers expressing PV-GFP. Lower panels show representative confocal images of intestine of an Ad-PV-MITO-GFP-injected rat (3 × 10⁹ pfu/kg), indicating absence of PV expression (green) in this organ.
A. MPO activity was used to evaluate neutrophil infiltration in sham, PH or PH + Ad-PV-MITO livers. Inflammation was similarly increased at day 1 in PH and PH + Ad-PV-MITO relative to sham (p<0.02 by one-way ANOVA) but returned to control levels after day 2 post-surgery. B. Representative hematoxylin-eosin staining shows similar liver architecture with minimal inflammatory infiltrate in both PH and PH + Ad-PV-MITO during 3 days of liver regeneration.
A. Liver body weight index 7 days after PH demonstrates no difference in liver mass between sham-operated and animals subjected to PH with or with injection of Ad-PV-MITO-GFP. B. Hematoxylin-eosin staining of representative liver sections from sham-operated rats, rats after PH, and rats infected with Ad-PV-MITO-GFP one day prior to PH. Analysis was performed 7 days after PH. No identifiable morphological alteration was observed among the livers (n=3 rats per condition).
A–F. Serum albumin, bilirubin, AST, ALT, and ALP were evaluated in samples from sham-operated rats, rats after PH, and rats infected with Ad-PV-MITO-GFP. There were no significant changes in any of the biochemical parameters among the groups (n=3 experiments).
Acknowledgments
We thank Gilson Nogueira for technical support and Soraya Smaili for providing antibodies against Bax and Bcl-2 and for useful discussions. Confocal imaging was supported by CEMEL (UFMG, Brazil).
This work was supported by grants from HHMI (Howard Hughes Medical Institute) to Leite MF; CNPq (Conselho Nacional de Desenvolvimento Científico e Tecnólogico, Brazil) to Leite MF and Resende RR; FAPEMIG (Fundação de Amparo à Pesquisa do Estado de Minas Gerais, Brazil) to Leite MF and Resende RR; CAPES (Coordenação de Aperfeiçoamento de Pessoal de Nível Superior, Brazil) to Guerra MT, Andrade VA; Casteluber MF and Resende RR; INCT (Instituto Nacional de Ciência e Tecnologia, Brazil) to Aguiar CJ and NIH (DK57751, DK45710 and DK34989) to Nathanson MH.
References
- 1.Fausto N, Campbell JS, Riehle KJ. Liver regeneration. Hepatology. 2006;43:S45–53. doi: 10.1002/hep.20969. [DOI] [PubMed] [Google Scholar]
- 2.Cressman DE, Greenbaum LE, DeAngelis RA, Ciliberto G, Furth EE, Poli V, Taub R. Liver failure and defective hepatocyte regeneration in interleukin-6-deficient mice. Science. 1996;274:1379–1383. doi: 10.1126/science.274.5291.1379. [DOI] [PubMed] [Google Scholar]
- 3.Yamada Y, Kirillova I, Peschon JJ, Fausto N. Initiation of liver growth by tumor necrosis factor: deficient liver regeneration in mice lacking type I tumor necrosis factor receptor. Proc Natl Acad Sci U S A. 1997;94:1441–1446. doi: 10.1073/pnas.94.4.1441. [DOI] [PMC free article] [PubMed] [Google Scholar]
- 4.Paranjpe S, Bowen WC, Bell AW, Nejak-Bowen K, Luo JH, Michalopoulos GK. Cell cycle effects resulting from inhibition of hepatocyte growth factor and its receptor c-Met in regenerating rat livers by RNA interference. Hepatology. 2007;45:1471–1477. doi: 10.1002/hep.21570. [DOI] [PMC free article] [PubMed] [Google Scholar]
- 5.Baffy G, Yang L, Michalopoulos GK, Williamson JR. Hepatocyte growth factor induces calcium mobilization and inositol phosphate production in rat hepatocytes. J Cell Physiol. 1992;153:332–339. doi: 10.1002/jcp.1041530213. [DOI] [PubMed] [Google Scholar]
- 6.Nicou A, Serriere V, Prigent S, Boucherie S, Combettes L, Guillon G, Alonso G, et al. Hypothalamic vasopressin release and hepatocyte Ca2+ signaling during liver regeneration: an interplay stimulating liver growth and bile flow. FASEB J. 2003;17:1901–1903. doi: 10.1096/fj.03-0082fje. [DOI] [PubMed] [Google Scholar]
- 7.Tanaka Y, Hayashi N, Kaneko A, Ito T, Miyoshi E, Sasaki Y, Fusamoto H, et al. Epidermal growth factor induces dose-dependent calcium oscillations in single fura-2-loaded hepatocytes. Hepatology. 1992;16:479–486. doi: 10.1002/hep.1840160229. [DOI] [PubMed] [Google Scholar]
- 8.Cruz LN, Guerra MT, Kruglov E, Mennone A, Garcia CR, Chen J, Nathanson MH. Regulation of multidrug resistance-associated protein 2 by calcium signaling in mouse liver. Hepatology. 2010;52:327–337. doi: 10.1002/hep.23625. [DOI] [PMC free article] [PubMed] [Google Scholar]
- 9.Rodrigues MA, Gomes DA, Leite MF, Grant W, Zhang L, Lam W, Cheng YC, et al. Nucleoplasmic calcium is required for cell proliferation. J Biol Chem. 2007;282:17061–17068. doi: 10.1074/jbc.M700490200. [DOI] [PMC free article] [PubMed] [Google Scholar]
- 10.Leite MF, Thrower EC, Echevarria W, Koulen P, Hirata K, Bennett AM, Ehrlich BE, et al. Nuclear and cytosolic calcium are regulated independently. Proc Natl Acad Sci U S A. 2003;100:2975–2980. doi: 10.1073/pnas.0536590100. [DOI] [PMC free article] [PubMed] [Google Scholar]
- 11.de Brito OM, Scorrano L. Mitofusin 2 tethers endoplasmic reticulum to mitochondria. Nature. 2008;456:605–610. doi: 10.1038/nature07534. [DOI] [PubMed] [Google Scholar]
- 12.Csordas G, Varnai P, Golenar T, Roy S, Purkins G, Schneider TG, Balla T, et al. Imaging interorganelle contacts and local calcium dynamics at the ER-mitochondrial interface. Mol Cell. 2010;39:121–132. doi: 10.1016/j.molcel.2010.06.029. [DOI] [PMC free article] [PubMed] [Google Scholar]
- 13.Jouaville LS, Pinton P, Bastianutto C, Rutter GA, Rizzuto R. Regulation of mitochondrial ATP synthesis by calcium: Evidence for a long-term metabolic priming. Proc Natl Acad Sci USA. 1999;96:13807–13812. doi: 10.1073/pnas.96.24.13807. [DOI] [PMC free article] [PubMed] [Google Scholar]
- 14.Mendes CC, Gomes DA, Thompson M, Souto NC, Goes TS, Goes AM, Rodrigues MA, et al. The type III inositol 1,4,5-trisphosphate receptor preferentially transmits apoptotic Ca2+ signals into mitochondria. J Biol Chem. 2005;280:40892–40900. doi: 10.1074/jbc.M506623200. [DOI] [PubMed] [Google Scholar]
- 15.Rong Y, Distelhorst CW. Bcl-2 protein family members: versatile regulators of calcium signaling in cell survival and apoptosis. Annu Rev Physiol. 2008;70:73–91. doi: 10.1146/annurev.physiol.70.021507.105852. [DOI] [PubMed] [Google Scholar]
- 16.Hanson CJ, Bootman MD, Distelhorst CW, Wojcikiewicz RJ, Roderick HL. Bcl-2 suppresses Ca2+ release through inositol 1,4,5-trisphosphate receptors and inhibits Ca2+ uptake by mitochondria without affecting ER calcium store content. Cell Calcium. 2008;44:324–338. doi: 10.1016/j.ceca.2008.01.003. [DOI] [PubMed] [Google Scholar]
- 17.White C, Li C, Yang J, Petrenko NB, Madesh M, Thompson CB, Foskett JK. The endoplasmic reticulum gateway to apoptosis by Bcl-X(L) modulation of the InsP3R. Nat Cell Biol. 2005;7:1021–1028. doi: 10.1038/ncb1302. [DOI] [PMC free article] [PubMed] [Google Scholar]
- 18.Minagawa N, Kruglov EA, Dranoff JA, Robert ME, Gores GJ, Nathanson MH. The anti-apoptotic protein Mcl-1 inhibits mitochondrial Ca2+ signals. J Biol Chem. 2005;280:33637–33644. doi: 10.1074/jbc.M503210200. [DOI] [PubMed] [Google Scholar]
- 19.Aguiar CJ, Andrade VL, Gomes ER, Alves MN, Ladeira MS, Pinheiro AC, Gomes DA, et al. Succinate modulates Ca(2+) transient and cardiomyocyte viability through PKA-dependent pathway. Cell Calcium. 2010;47:37–46. doi: 10.1016/j.ceca.2009.11.003. [DOI] [PubMed] [Google Scholar]
- 20.McDonald B, Pittman K, Menezes GB, Hirota SA, Slaba I, Waterhouse CC, Beck PL, et al. Intravascular danger signals guide neutrophils to sites of sterile inflammation. Science. 2010;330:362–366. doi: 10.1126/science.1195491. [DOI] [PubMed] [Google Scholar]
- 21.Higgins G, Anderson R. Experimental pathology of the liver. I. Restoration of the liver of the white rat following partial surgical removal. Arch Pathol. 1931;12:186–202. [Google Scholar]
- 22.Soares AC, Pinho VS, Souza DG, Shimizu T, Ishii S, Nicoli JR, Teixeira MM. Role of the platelet-activating factor (PAF) receptor during pulmonary infection with gram negative bacteria. Br J Pharmacol. 2002;137:621–628. doi: 10.1038/sj.bjp.0704918. [DOI] [PMC free article] [PubMed] [Google Scholar]
- 23.Joseph SK, Hajnoczky G. IP3 receptors in cell survival and apoptosis: Ca2+ release and beyond. Apoptosis. 2007;12:951–968. doi: 10.1007/s10495-007-0719-7. [DOI] [PubMed] [Google Scholar]
- 24.Youle RJ, Strasser A. The BCL-2 protein family: opposing activities that mediate cell death. Nat Rev Mol Cell Biol. 2008;9:47–59. doi: 10.1038/nrm2308. [DOI] [PubMed] [Google Scholar]
- 25.Michalopoulos GK, DeFrances MC. Liver regeneration. Science. 1997;276:60–66. doi: 10.1126/science.276.5309.60. [DOI] [PubMed] [Google Scholar]
- 26.Cruise JL, Muga SJ, Lee YS, Michalopoulos GK. Regulation of hepatocyte growth: alpha-1 adrenergic receptor and ras p21 changes in liver regeneration. J Cell Physiol. 1989;140:195–201. doi: 10.1002/jcp.1041400202. [DOI] [PubMed] [Google Scholar]
- 27.Thevananther S, Sun H, Li D, Arjunan V, Awad SS, Wyllie S, Zimmerman TL, et al. Extracellular ATP activates c-jun N-terminal kinase signaling and cell cycle progression in hepatocytes. Hepatology. 2004;39:393–402. doi: 10.1002/hep.20075. [DOI] [PubMed] [Google Scholar]
- 28.Hirata K, Pusl T, O’Neill AF, Dranoff JA, Nathanson MH. The type II inositol 1,4,5-trisphosphate receptor can trigger Ca2+ waves in rat hepatocytes. Gastroenterology. 2002;122:1088–1100. doi: 10.1053/gast.2002.32363. [DOI] [PubMed] [Google Scholar]
- 29.Thomas AP, Renard-Rooney DC, Hajnoczky G, Robb-Gaspers LD, Lin C, Rooney TA. Subcellular organization of calcium signalling in hepatocytes and the intact liver. Ciba Found Symp. 1995;188:18–35. doi: 10.1002/9780470514696.ch3. discussion 35–49. [DOI] [PubMed] [Google Scholar]
- 30.Nicou A, Serriere V, Hilly M, Prigent S, Combettes L, Guillon G, Tordjmann T. Remodelling of calcium signalling during liver regeneration in the rat. J Hepatol. 2007;46:247–256. doi: 10.1016/j.jhep.2006.08.014. [DOI] [PubMed] [Google Scholar]
- 31.Soliman EM, Rodrigues MA, Gomes DA, Sheung N, Yu J, Amaya MJ, Nathanson MH, et al. Intracellular calcium signals regulate growth of hepatic stellate cells via specific effects on cell cycle progression. Cell Calcium. 2009;45:284–292. doi: 10.1016/j.ceca.2008.11.006. [DOI] [PMC free article] [PubMed] [Google Scholar]
- 32.Lagoudakis L, Garcin I, Julien B, Nahum K, Gomes DA, Combettes L, Nathanson MH, et al. Cytosolic calcium regulates liver regeneration in the rat. Hepatology. 2010;52:602–611. doi: 10.1002/hep.23673. [DOI] [PMC free article] [PubMed] [Google Scholar]
- 33.Pinton P, Giorgi C, Siviero R, Zecchini E, Rizzuto R. Calcium and apoptosis: ER-mitochondria Ca2+ transfer in the control of apoptosis. Oncogene. 2008;27:6407–6418. doi: 10.1038/onc.2008.308. [DOI] [PMC free article] [PubMed] [Google Scholar]
- 34.Li P, Nijhawan D, Budihardjo I, Srinivasula SM, Ahmad M, Alnemri ES, Wang X. Cytochrome c and dATP-dependent formation of Apaf-1/caspase-9 complex initiates an apoptotic protease cascade. Cell. 1997;91:479–489. doi: 10.1016/s0092-8674(00)80434-1. [DOI] [PubMed] [Google Scholar]
- 35.Norberg E, Gogvadze V, Ott M, Horn M, Uhlen P, Orrenius S, Zhivotovsky B. An increase in intracellular Ca2+ is required for the activation of mitochondrial calpain to release AIF during cell death. Cell Death Differ. 2008;15:1857–1864. doi: 10.1038/cdd.2008.123. [DOI] [PubMed] [Google Scholar]
- 36.Reed JC. Bcl-2 and the regulation of programmed cell death. J Cell Biol. 1994;124:1–6. doi: 10.1083/jcb.124.1.1. [DOI] [PMC free article] [PubMed] [Google Scholar]
- 37.Boise LH, Gonzalez-Garcia M, Postema CE, Ding L, Lindsten T, Turka LA, Mao X, et al. bcl-x, a bcl-2-related gene that functions as a dominant regulator of apoptotic cell death. Cell. 1993;74:597–608. doi: 10.1016/0092-8674(93)90508-n. [DOI] [PubMed] [Google Scholar]
- 38.Kozopas KM, Yang T, Buchan HL, Zhou P, Craig RW. MCL1, a gene expressed in programmed myeloid cell differentiation, has sequence similarity to BCL2. Proc Natl Acad Sci U S A. 1993;90:3516–3520. doi: 10.1073/pnas.90.8.3516. [DOI] [PMC free article] [PubMed] [Google Scholar]
- 39.Degterev A, Yuan J. Expansion and evolution of cell death programmes. Nat Rev Mol Cell Biol. 2008;9:378–390. doi: 10.1038/nrm2393. [DOI] [PubMed] [Google Scholar]
- 40.Deng X, Li W, Chen N, Sun Y, Wei H, Jiang Y, He F. Exploring the priming mechanism of liver regeneration: proteins and protein complexes. Proteomics. 2009;9:2202–2216. doi: 10.1002/pmic.200800648. [DOI] [PubMed] [Google Scholar]
- 41.Miyazawa K. Hepatocyte growth factor activator (HGFA): a serine protease that links tissue injury to activation of hepatocyte growth factor. FEBS J. 2010;277:2208–2214. doi: 10.1111/j.1742-4658.2010.07637.x. [DOI] [PubMed] [Google Scholar]
- 42.Cosgrove BD, Cheng C, Pritchard JR, Stolz DB, Lauffenburger DA, Griffith LG. An inducible autocrine cascade regulates rat hepatocyte proliferation and apoptosis responses to tumor necrosis factor-alpha. Hepatology. 2008;48:276–288. doi: 10.1002/hep.22335. [DOI] [PMC free article] [PubMed] [Google Scholar]
- 43.Bailly-Maitre B, Bard-Chapeau E, Luciano F, Droin N, Bruey JM, Faustin B, Kress C, et al. Mice lacking bi-1 gene show accelerated liver regeneration. Cancer Res. 2007;67:1442–1450. doi: 10.1158/0008-5472.CAN-06-0850. [DOI] [PubMed] [Google Scholar]
- 44.Vail ME, Chaisson ML, Thompson J, Fausto N. Bcl-2 expression delays hepatocyte cell cycle progression during liver regeneration. Oncogene. 2002;21:1548–1555. doi: 10.1038/sj.onc.1205212. [DOI] [PubMed] [Google Scholar]
Associated Data
This section collects any data citations, data availability statements, or supplementary materials included in this article.
Supplementary Materials
Control SKHep1 cells and cells transfected with MITO-GFP or PV-MITO-GFP were treated for 6 hours with or without 300 nM STA. Expression of PV in mitochondria did not alter cell proliferation. STA treatment induced cell death in 20.6±6.2% of MITO-GFP cells. Under the same conditions, PV expression prevented cell death, although it did not induce cell proliferation. Results represent the mean±S.E.M. of 3 separate experiments.
Three sequential planes of an intravital confocal Z-stack (160 μM in 2 μM increments) of a rat hepatic lobule 2 days after tail vein injection of Ad-PV-MITO-GFP. PV is shown in green.
Upper panels show representative intravital confocal images of the liver of a rat 2 days after tail vein injection of saline solution. No fluorescence was observed in the liver under the same confocal settings used to capture images from livers expressing PV-GFP. Lower panels show representative confocal images of intestine of an Ad-PV-MITO-GFP-injected rat (3 × 10⁹ pfu/kg), indicating absence of PV expression (green) in this organ.
A. MPO activity was used to evaluate neutrophil infiltration in sham, PH or PH + Ad-PV-MITO livers. Inflammation was similarly increased at day 1 in PH and PH + Ad-PV-MITO relative to sham (p<0.02 by one-way ANOVA) but returned to control levels after day 2 post-surgery. B. Representative hematoxylin-eosin staining shows similar liver architecture with minimal inflammatory infiltrate in both PH and PH + Ad-PV-MITO during 3 days of liver regeneration.
A. Liver body weight index 7 days after PH demonstrates no difference in liver mass between sham-operated and animals subjected to PH with or with injection of Ad-PV-MITO-GFP. B. Hematoxylin-eosin staining of representative liver sections from sham-operated rats, rats after PH, and rats infected with Ad-PV-MITO-GFP one day prior to PH. Analysis was performed 7 days after PH. No identifiable morphological alteration was observed among the livers (n=3 rats per condition).
A–F. Serum albumin, bilirubin, AST, ALT, and ALP were evaluated in samples from sham-operated rats, rats after PH, and rats infected with Ad-PV-MITO-GFP. There were no significant changes in any of the biochemical parameters among the groups (n=3 experiments).