

Abstract
Background
Given that genome wide association studies (GWAS) of psychiatric disorders have identified only a small number of convincingly associated variants, there is interest in seeking additional evidence for associated variants using tests of gene-gene interaction. Comprehensive pair-wise SNP-SNP interaction analysis is computationally intensive and the penalty for multiple testing is severe given the number of interactions possible. Aiming to minimize these statistical and computational burdens, we have explored approaches to prioritise SNPs for interaction analyses.
Methods
Primary interaction analyses were performed using the Wellcome Trust Case Control Consortium Bipolar Disorder GWAS (1868 cases, 2938 controls). Replication analyses were performed using the Genetic Association Information Network BD dataset (1001 cases, 1033 controls). SNPs were prioritized for interaction analysis that showed evidence for association that surpassed a number of nominally significant thresholds, are within genome-wide significant genes, or are within genes that are functionally related.
Results
For no set of prioritized SNPs did we obtain evidence to support the hypothesis that the selection strategy identified pairs of variants that were enriched for true (statistical) interactions.
Conclusions
SNPs prioritized according to a number of criteria do not have a raised prior probability for significant interaction that is detectable in samples of this size. As is now widely accepted for single SNP analysis, we argue the use of significance levels reflecting only the number of tests performed does not offer an appropriate degree of protection against the potential for GWAS studies to generate an enormous number of false positive interactions.
Keywords: GWAS, SNP, epistasis, association, interaction, gene
Introduction
Genome-wide association studies (GWAS) have identified hundreds of genetic loci at which common variation confers disease susceptibility (1, 2). These include Bipolar Disorder (BD); when this study was performed, a meta-analysis of just over 10,000 individuals had shown strong evidence for association between susceptibility to BD and variants within ANK3 (encoding the protein ankyrin G) and CACNA1C (encoding the alpha-1C subunit of the L-type voltage-gated calcium channel) (3). While these findings are potentially informative for our understanding of pathophysiology, they account for only a trivial amount of the population variance in risk of the disorder.
Some of the missing variance in risk to BD is likely to be conferred by a large number of common alleles of small effect (4), but the proportion that will ultimately be accounted for by such alleles, in contrast to rare alleles, awaits empirical resolution. One potential source of the gap between the observed genetic variance accounted for and that predicted is epistasis or gene-gene interaction (5). However, a challenge to systematic genome-wide interaction analysis is the computational time required to perform the requisite tests, the number of which for even pair-wise analysis, corresponds to N(N-1)/2, where N is the number of markers. In the case of a GWAS study of 300,000 markers (for example), this requires 44,999,850,000 tests, this being only the tip of the iceberg if tests of higher-order interactions (between three or more markers) are to be conducted. For higher order interactions, the number of tests is 2N-N-1 for all 2-, 3- … N- markers interactions. In the context of such multiple testing, stringent levels of significance are required to control the type I error rate.
One potential way of overcoming the multiple testing burden is to restrict analysis to subsets of SNPs with a higher prior probability for interaction. Intuitively reasonable strategies include selecting variants within genes whose products are functionally related (6), particularly variants that themselves display nominally significant main effects (7). However, there is no straightforward equivalence between functional and statistical interaction (8), and there is little evidence that variants selected along these lines have a higher prior probability for interaction. Indeed there is evidence from lower organisms that genetic interaction is prevalent among products whose functions seem entirely unrelated (9).
Aiming to identify scenarios where variants have a higher probability for statistical interaction, we systematically explored the distributions of pair-wise interaction results among sets of SNPs selected according to a range of criteria. We tested these for evidence for interaction using the Wellcome Trust Case Control Consortium BD GWAS dataset (10), and followed up the strongest findings in the Genetic Association Information Network (GAIN) BD GWAS dataset of European ancestry (11).
Methods
Datasets
For the primary analysis, we used the WTCCC data (10) of 1868 BD cases and 2938 controls typed with the Affymetrix GeneChip® 500K Mapping Array Set. All individuals self-identified as white Europeans living in the UK. The controls were from the 1958 British Birth Cohort or were UK Blood Donors. Neither group was screened for BD, but the use of unscreened controls does not significantly impact on power for a disorder with the frequency of BD (12). The details of the samples and conduct of the GWAS are provided in the primary manuscript. Interaction analysis is not robust for markers with small minor allele frequencies (MAF) (13), so we excluded markers with MAF<0.1 in cases and controls combined. As in our previous publications (14, 15) we excluded SNPs with call rates<0.97, or with Hardy-Weinberg equilibrium (HWE) p<0.001 in controls or p< 0.00001 in cases, retaining 297665 markers. We used the filtered GAIN dataset as supplied via dbGaP (http://www.ncbi.nlm.nih.gov/gap) of 673715 markers (1001 Bipolar cases and 1033 controls) typed on the Affymetrix Genome-Wide Human SNP Array 6.0. We used the dataset as supplied (MAF≥0.01 in the combined sample, HWE p<10-6 in controls). Individuals were Americans of European ancestry. Thus the two datasets analysed here are of the same broad ethnic background, although they will differ by sub-European ethnic strata. Although the GAIN dataset has more markers than the WTCCC, our replication design means we only examined markers that are present the WTCCC data set. The sample size of the GAIN dataset is smaller than the WTCCC, and therefore is less powerful for large scale analyses.
Single marker association P values were calculated using a 1df Armitage trend test. These results have been the subject of a previous paper (10) and meta-analysis (3) and are not discussed here. An overall inflation in the association signal is evident from the quantile-quantile (Q-Q) plot which compares the observed values of chi-square statistics versus expected (Figure S1 in the Supplement) and from a genomic control (16) inflation factor (λGC) of 1.12. This inflation is not likely to be attributable to population structure (10), and at least part of the signal is likely explained by a polygenic component to BD comprising many weak genetic effects (4, 17).
Interaction analysis
Interactions were assessed using PLINK-V1.06 (18) via significance of the multiplicative term in the logistic regression model over and above that of the joint additive allelic effects (on a logarithmic scale) (19) for discussion of models). Just prior to submission of this manuscript, it became feasible to conduct a comprehensive analysis of all pairs of SNPs. This was performed using EPIBLASTER (20). A fast scan is first performed for all possible SNP pairs to identify those for which there are differences in the Pearson's correlation between cases and controls. A standard likelihood ratio test of two regression models with and without the interaction terms is then performed for those pairs identified in stage 1 as showing differences (20). Interaction analyses of the GAIN dataset were performed using R-Statistical software. Four covariates identified by Multidimensional Scaling (MDS) analysis were taken into account as in the primary manuscript describing that GWAS dataset.
Power of test for interaction
Analysis of power for detecting interaction requires multiple parameters unique to each SNP pairing, including allele frequencies, main effect sizes, the magnitude and type of interaction, and the extent of linkage disequilibrium between markers, to be defined. The impact of many of these has been explored (13, 21). Since there are infinite combinations of the above, we limited power calculations to the most significant interactions we aimed to replicate, using the corresponding parameters from the WTCCC dataset and 10000 simulations using the sample sizes in the GAIN dataset. Under the assumption of modest power to detect any single interaction, the effect sizes that attain significant P-values in the discovery data set are likely to be higher than the true effect sizes, a phenomenon known as the ‘winner's curse’. Therefore our estimates of power are likely to be inflated. Differences in the second sample in terms of allele frequencies or unknown aspects of the phenotype that index genetic and environmental heterogeneity, may also influence power, although how that might influence any particular SNP pair cannot be known in advance.
SNP selection
We tested the hypothesis that interactions are enriched among nominally significant variants. An evaluation of this using simulated datasets (21) reported the impact on power of marker allele frequencies, nominal significance thresholds, and sample size. Using a sample slightly smaller than the WTCCC, maximal power was achieved selecting variants with P ranging between 0.01-0.001, but for a sample about twice the size, maximal power was obtained in the range P 0.02-0.001. We selected SNPs comprising all variants surpassing nominally significant thresholds (p≤0.05, 0.01, and 0.001). While these thresholds are arbitrary, they are consistent with those described as approximately optimal under the conditions tested in the earlier study and which we found (using powerGWASinteraction software those authors made available) remain approximately optimal despite fewer SNPs (N= 297665) in the present study compared with 500,000 in their study (21). To achieve partial independence, we identified SNPs in at least moderate LD (r2≥0.5) using sliding windows of 50 variants spanning no more than 250kb. From such pairs, we pruned the sets by discarding the least significant SNP using the --clump function in PLINK (18). After pruning, 9614 SNPs surpassed p≤0.05, 2491 SNPs surpassed p≤0.01, and 326 SNPs surpassed p≤0.001. All pairs of SNPs within each category were then examined for evidence for interaction. Pairs identified from for which the interaction evidence surpassed nominally significant thresholds were then examined in the GAIN dataset for replication. As a null comparator, we tested interaction among an LD pruned (r2≥0.5) set of SNPs which attained p≥0.95 in the GWAS.
-
The above strategy requires evidence for main effects at both loci. Another approach is to select variants in genes that are robustly supported for association, regardless of whether the variants themselves have main effects, and then to test those against other sets of variants selected without regard to any prior association evidence. We identified SNPs in the two genes that at the time, had been strongly implicated in BD (3); ANK3 (chr10:61,458,165-62,163,161 (NCBI Build 36.1/ hg 18) and CACNA1C (chr12:2,032,677-2,677,376). After exclusion of variants with MAF≤0.1 (but not LD pruning), we tested the following sets of SNPs for interaction.
interaction analysis between each variant in ANK3 and each variant in CACNA1C.
every SNP in each of these genes and every variant in the GWAS dataset.
the most significantly associated variant in each gene and the remaining variants in the genome.
Based upon the hypothesis that interactions are enriched among variants within genes with related functions, we selected genes encoding dihydropyridine-sensitive calcium channel subunits. This was selected because a) CACNA1C is a member of this category and b) 4 of 6 genes for which we have data show gene-wide significance in the dataset of Ferreria and colleagues (3) (unpublished data). Thus, the group are functionally connected and have multiple members with evidence for association. Other than CACNA1C, the members of this category are CACNA1D, CACNA1S, CACNA2D1, CACNG1, CACNB1, CACNB3, and CACNA1F. We did not include CACNB1 or CACNB3 as neither are covered by variants. We also excluded CACNA1F which maps to the X-chromosome as this adds complexities to the interaction analysis. We then tested all pair-wise interactions among all SNPs (not LD pruned, N=204) without selecting on the basis of P values.
To evaluate whether among unselected sets of SNPs, there was any evidence for epistasis, we performed a comprehensive pair-wise interaction analysis for all possible pairs of SNPs in the WTCCC BD dataset and tested the 1000 most significant interactions for replication in the GAIN dataset.
Results
1. Interactions among nominally significant variants
For the null comparator group (SNPs p≥0.95, N = 10355) the QQ-plot did not deviate from the null (Figure 1A) and there was no inflation in λGC (λGC =1.00). Similar Q-Q plots and λGC values were obtained for marker pairs surpassing p≤0.05 (Figure 1B, λGC=1.00), p≤0.01 (Figure 1C, λGC=1.00), and p≤0.001 (Figure 1D, λGC=1.00).
Figure 1.
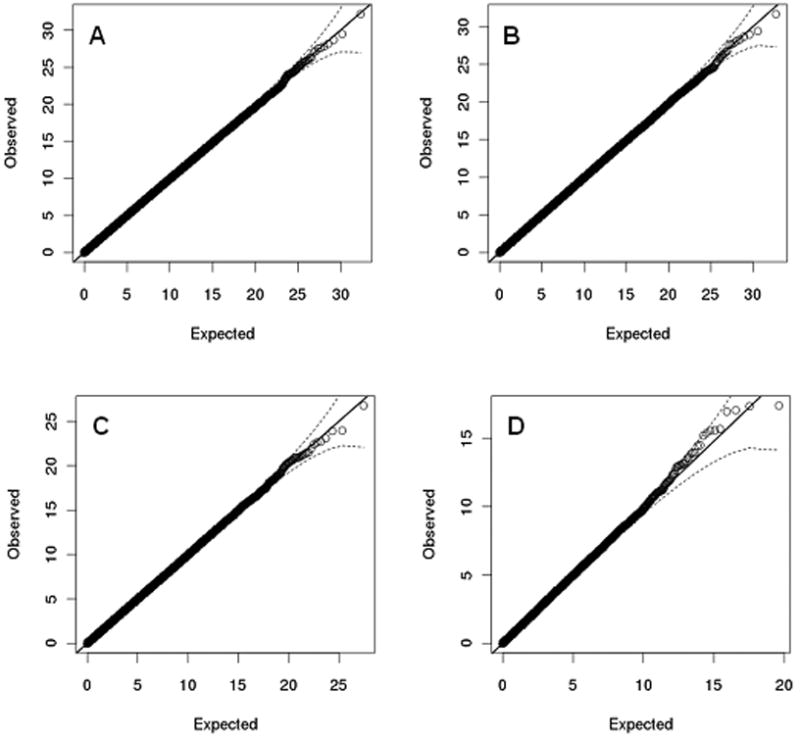
Q-Q plots for SNP-SNP interaction analyses of SNPs with MAF>0.1 (the dotted line represents 95% confident intervals).
A. All SNPs with association p-values ≥0.95.
B. Top significant SNPs at 5% level and non-independent SNPs at r2≥0.5 removed.
C. Top significant SNPs at 1% level and non-independent SNPs at r2≥0.5 removed.
D. Top significant SNPs at 0.1% level and non-independent SNPs at r2≥0.5 removed.
Although the test statistics for interaction do not deviate from the null for any of the above SNP sets, we tested the hypothesis that true interactions are enriched among those with the strongest evidence for interaction by attempting to replicate in the GAIN dataset interactions among all pairs for which the evidence for interaction surpassed a range of statistical thresholds. Of a total of 52975 interactions based upon SNPs with single locus p≤0.001 (Figure 1D), 9 interaction tests surpassed p≤10-4, 53 surpassed p≤10-3, and 506 surpassed p≤10-2. These variants and P values are available in Table S1 in the Supplement. The corresponding pairs of markers were respectively available for 8, 43, and 391 of these in the GAIN dataset. Of the interactions surpassing the two most stringent thresholds, none replicated at the 0.05 significance level. Of 391 interactions that in the WTCCC data surpassed p≤10-2, only 17 of these replicated in GAIN. This is not significantly different than chance (p=0.72). (P value calculated using the z-score obtained from a binomial test (assuming that tests are independent). The expected number of tests replicated at 0.05 significance level was estimated as Np (=19.55) and the variance was estimated as N*p*(1-p), where p=0.05 and N=391).
2. Variants in robustly associated genes
After filtering for MAF, there were 53 and 83 variants in ANK3 and CACNA1C respectively (not LD pruned). When each variant in ANK3 was tested against each variant in CACNA1C we found no evidence for either a highly significant interaction beyond that chance, or for inflation of the observed distribution of P values (Figure 2A, λGC =1.00).
Figure 2.
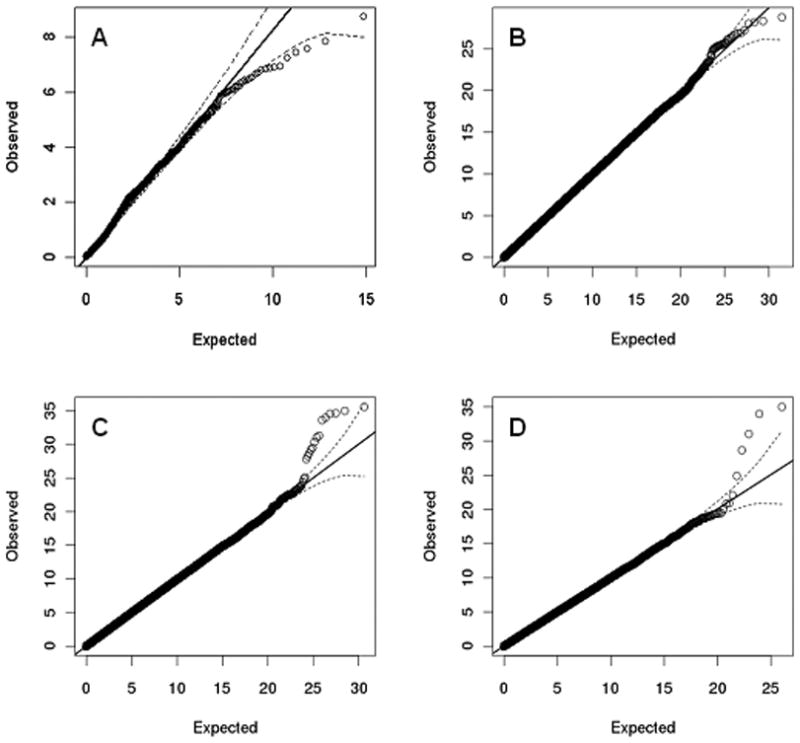
Interactions of SNPs from ANK3 and CACNA1C.
A. Interactions between CACNA1C and ANK3 SNPs (no LD pruning).
B. Interactions of all SNPs from CACNA1C against the whole genome.
C. Interactions of all SNPs from ANK3 against the whole genome.
D. Interactions of top significant (0.1% level) SNPs from ANK3 and non-independent SNPs at r2≥0.5 removed against the whole genome.
A similar pattern was obtained when all variants in CACNA1C (Figure 2B, λGC=1.00) were tested against the rest of the genome.
However, when all variants in ANK3 were tested against the rest of the genome, while there was no inflation in the interaction test statistics (λGC =1.00), there was an excess of extremely small P values, the smallest being between rs10821729 (ANK3) and rs4741377 (∼30kb 5′ to nuclear factor I/B (NFIB) on chr 9). This survives Bonferroni correction for all 15,776,105 tests (p=2.5×10⁻⁹, corrected p=0.04) in this particular analysis, but not for all the subsets of the analyses we have performed. Among these were multiple interactions from correlated ANK3 SNPs (e.g. 4 highly correlated (r2>0.95) markers each had a P value for interaction to rs4741377 less than 1.5×10⁻⁶). Nevertheless, after pruning ANK3 (Figure 2D, λGC=1.00), the excess of small P values remained. This excess was enriched for non-ANK3 SNPs in LD with each other, for example the four most significant interactions in Figure 2D include 4 markers at chr 9 (rs4741377, rs4741376, rs1008943 rs2039052) which have pair-wise values of r2 between 0.75 - 0.99. The most significant interaction (p=3.3×10⁻⁹) was between rs4582919 at ANK3 and rs4741377 (as before) which simply reflects the finding above. None of the other interactions survives correction for multiple testing of the post-pruned data. In the GAIN data markers were available to test 107 of the top 133 significant interactions (p≤10-5) from the WTCCC un-pruned data. Of these, 6 replicated at the 0.05 significance level, but none survives correction for multiple testing (interaction pmin=0.002, Table S2 in the Supplement). The top interaction in the unpruned marker dataset between rs10821729 (ANK3) and rs4741377 was not replicated in the GAIN sample (p=0.825) and the same was true for that in the pruned dataset (rs4582919 (ANK3) and rs4741377, p=0.889).
To evaluate whether the absence of replication for the top interactions might be a type II error, we estimated the power to replicate the interaction model between rs4582919 (ANK3) and rs4741377 using simulations of samples sizes available in GAIN. Power at the 0.05 significance level was 61%.
When we limited interaction analyses to pairs containing at least one of the strongly associated variants markers from meta-analysis (3), that is rs1938526 at ANK3 (Pmeta=1.3×10⁻⁸) or rs1006737 at CACNA1C, (Pmeta=7.0×10⁻⁸), again, the distribution of P values for both ANK3 and CACNA1C did not show much, if any, inflation (Figures 3A (λGC=1.015) and 3B (λGC=1.00)). For ANK3, the most significant interaction result (p=7.67×10⁻⁸) was between rs1938526 (ANK3) and rs7176022 (lectin, mannose-binding, 1 like precursor (LMAN1L)) on chromosome 15 at 75.1Mb. While significant at a Bonferroni corrected level for this sub-analysis (the threshold is 0.05/297665=1.7×10-7) though not for multiple sets of interactions examined in this study, this interaction showed no trend for replication in the GAIN BD dataset (p=0.428). Power to detect this in the GAIN sample was 42% at the 0.05 significance level and 54% at a trend level of 0.1. For rs1006737 at CACNA1C, the most significant interaction was to rs10090710 (p=8.4×10⁻⁷, chr 8, 55. 8Mb) which is not within 100kb of any known gene. Again, the finding did not replicate in GAIN (p=0.422, power = 48% at 0.05 significance level). We also found no evidence for any replication in GAIN for interactions that surpassed p≤10-5 in the WTCCC dataset (n=10, all available in GAIN; replication P values 0.23-0.46, Table S3 in the Supplement).
Figure 3.
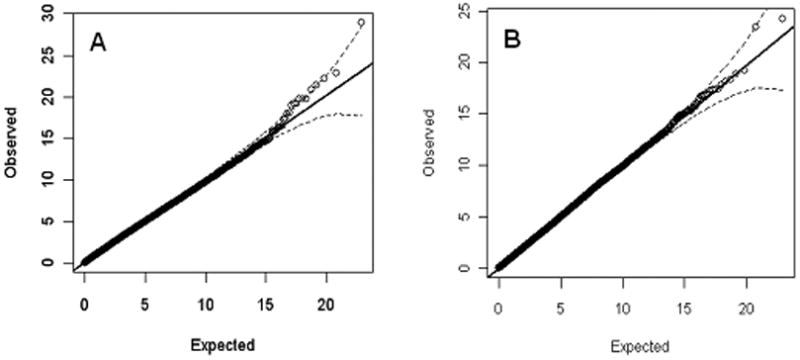
Interactions of published genome wide significant SNPs against the whole genome (no LD pruning).
A. rs1938526 in ANK3 vs the whole genome.
B. rs1006737 in CACNA1C vs the whole genome.
3. SNPs in genes encoding dihydropyridine-sensitive calcium channel subunits
We found a slight excess of significant interactions (λGC=1.035) in the WTCCC dataset. This is more clearly visualized in Figure 4A where we plot the distribution of P values in windows each representing ∼2% of all (20613) tests. Under the null, a perfectly flat distribution is expected, contrasting with the observed data where we see a slight excess for P values <0.01. This is also seen in the Q-Q plot as a deviation from the null at around chi-square statistic 6.63 (corresponding to P value 0.01, Figure 4B). Of 248 pairs of SNPs with interaction P values ≤0.01 in the WTCCC, 229 were available in GAIN. Of these, only 11 replicated at the 0.05 significance level, a number that is not significantly greater than chance (p=0.55). None is significant corrected for multiple testing (Pmin=0.006, Table S4 in the Supplement). Aiming to see if a similar degree of inflation occurred for all SNPs in this category in the GAIN data, we ran a full analysis of all SNPs in that dataset but obtained no inflation in the interaction test statistic (λGC=1.00; Figures S1 and S2 in the Supplement). We also tested a LD pruned (clumped option) WTCCC dataset for this set of genes (15 SNPs out of 204 after clumping) to investigate if the inflation was attributable to the inclusion of markers in LD. In that analysis, there was no inflation in the test statistics (Figure S3 in the Supplement).
Figure 4.
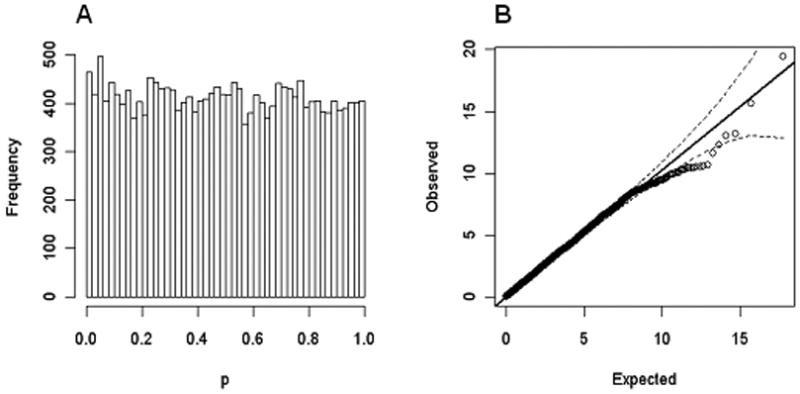
Interactions of SNPs in genes encoding dihydropyridine-sensitive calcium channel subunits (no LD pruning).
A. Histogram of P values.
B. Q-Q plot.
4. All pairs of SNPs interaction analysis
From the analysis of all possible SNP-SNP pair-wise, we stored results for the top thousand, none of which would be significant allowing for multiple testing (range of P values = 3.04×10⁻¹⁰ - 4.2×10⁻⁵) (Table S5 in the Supplement). Of the 1000 pairs, 918 were available in GAIN. Of these, 27 replicated at 5% significance level which does not significantly deviate from chance (p=0.998). None replicated at a level that would survive correction for 1000 tests (Pmin=0.01).
Conclusions
While GWAs studies have implicated a small number of strongly supported loci for BD and other psychiatric disorders, but much larger samples will be required to identify an appreciable proportion of the common variants involved in these disorders (4, 22). In parallel, it is at least possible that gene-gene interaction analyses might provide an opportunity for mining GWAS datasets for additional associations that may not be apparent from single locus tests. Several methods and software implementations are available for testing for interactions (19), and the conduct of comprehensive pair-wise genome-wide interaction analyses (23, 24) has, as performed in the present study, become computationally feasible. However, it is unclear whether the interaction effect sizes (should they exist) are of sufficient magnitude to allow the attainment of the stringent statistical thresholds that are required to control the type I error rate arising from the vast number of tests involved in genome wide interaction analyses. One possible solution is to identify sets of variants with enhanced prior probability for true statistical interaction.
In the present study, we have selected a number of scenarios for constraining the number of tests. However, for none did we obtain strong evidence that the resultant distribution of interaction P values in the primary dataset was indicative of an increased prior probability for interaction, and/or that the distribution of independent replication P values deviated from that expected by chance. In particular, selecting markers on the basis of their marginal (i.e. single marker P values) was not an effective approach.
In the case of ANK3, but not CACNA1C, we did obtain initial weak support for the strategy of selecting markers that map to a locus which is implicated at a genome-wide level of significance by single marker tests (3), and also by testing the most strongly supported variant at that locus against the remainder of the genome. Thus, in each of these analyses, there were more interactions at the extreme level of significance than expected. However, none replicated even at a nominal level in an independent dataset. Thus, our analysis does not provide convincing endorsement of these strategies. Although the power for any individual replication was not estimated to be high, and conclusions may not generalize as there are only 2 genes at a genome wide significant threshold, this finding is consistent with recent studies of height and body mass index. Despite samples comprising over 100,000 individuals and large numbers of highly significant variants (e.g. for height, 207 SNPs P<5×10⁻⁶), exploration of the top hits revealed no evidence for interactions that survive correction for multiple testing (25, 26). One speculative explanation is that loci that are convincingly detectable by univariate analyses are detectable because they do not require interactions to exert an effect.
Similarly, weak support was initially obtained for selecting SNPs from a closely related functional category, in this case genes encoding dihydropyridine-sensitive calcium channel subunits. Here, there was no excess of highly significant interactions, but there was some mild elevation in the number of weakly significant interactions (∼p=0.01). However, no individual pair-wise interaction was significant in the WTCCC data allowing for multiple testing, no interaction for which there was even modest support in the WTCCC dataset replicated at a level better than chance in GAIN, the set of interactions with p<0.01 in the WTCCC did not deviate from the null in the GAIN, and, finally, interactions based upon the full set of variants in this set of genes did not deviate from the null in the GAIN. Thus, we cannot conclude that the modest inflation in the test statistics we observed in the WTCCC data supports this selection approach. It be noted that even if the replication analyses represent type II errors, that is our initial finding represents a true inflation in interactions, the findings are not interpretable in terms of specific loci.
We have not undertaken a comprehensive analysis of every possible functional pathway, and therefore our conclusions here are constrained, but we note we have examined a system with both genome wide significant variation and in which multiple genes show nominally significant gene-wide evidence. It is also important to add that a challenge to testing such functional clusters is that there are no clear boundaries to the numbers of reasonable groupings of genes. Thus, we could have chosen different ways of defining the category, used a different classification schemes, or chosen totally different categories (e.g. dopamine receptors, dopamine receptors plus dopamine metabolizing enzymes, dopamine receptors plus dopamine metabolizing enzymes, etc). This adds uncertainty to the true extent of multiple testing that can be achieved through functional group analysis.
In summary, attempting to contain the multiple testing burden required by interaction analysis of GWAS datasets, we have tested a number of plausible SNP selection strategies in the hope that by so doing, we can identify groups of SNPs with higher prior probabilities for displaying significant (statistical) interaction. However, we found no evidence that any of the approaches we explored achieved that outcome. Our findings could mean a) there are no true pair-wise statistical interactions to be found b) such interactions do occur but these are not enriched for by our selection strategies or c) true interactions are enriched for among the SNPs selected, but these cannot be confidently demonstrated or replicated in currently available sample sizes. Regardless of the explanation, the issue we aimed to address is whether these strategies can be demonstrated to increase the prior probability for observing a true interaction in sample sizes that are currently available. We find they do not. In the absence of demonstrable enhanced prior probability for association between a disease and any particular single genetic variant, it has been argued that the threshold for significant association should not depend on the number of markers tested (10), and that tests of single markers require the same stringent statistical support as those required by genome wide SNP tests. This argument has gained acceptance in the genetics community. Since we have failed to find that the selection strategies we have deployed demonstrably enhance the prior probability for interaction, until proven otherwise, we suggest that the same considerations apply to interaction tests. We therefore suggest the use of thresholds reflecting only the number of tests performed in subsets of SNPs drawn from GWAS data does not afford an appropriate degree of protection against the potential for interaction studies to generate an enormous number of false positive interactions.
Supplementary Material
Acknowledgments
This study makes use of data generated by the Wellcome Trust Case Control Consortium (www.wtccc.org.uk) and Genetic Information Association Network (http://www.genome.gov/19518664). This research was supported by grants from the MRC (UK) the Wellcome Trust and by a NIMH (USA) CONTE: 2 P50 MH066392-05A1. Valentina Moskvina was supported by a RCUK Fellowship.
Footnotes
Financial Disclosures. All authors report no biomedical financial interests or potential conflicts of interest.
Publisher's Disclaimer: This is a PDF file of an unedited manuscript that has been accepted for publication. As a service to our customers we are providing this early version of the manuscript. The manuscript will undergo copyediting, typesetting, and review of the resulting proof before it is published in its final citable form. Please note that during the production process errors may be discovered which could affect the content, and all legal disclaimers that apply to the journal pertain.
References
- 1.Manolio TA, Brooks LD, Collins FS. A HapMap harvest of insights into the genetics of common disease. J Clin Invest. 2008;118:1590–605. doi: 10.1172/JCI34772. [DOI] [PMC free article] [PubMed] [Google Scholar]
- 2.Altshuler D, Daly MJ, Lander ES. Genetic mapping in human disease. Science. 2008;322:881–888. doi: 10.1126/science.1156409. [DOI] [PMC free article] [PubMed] [Google Scholar]
- 3.Ferreira MAR, O'Donovan MC, Meng YA, Jones IR, Ruderfer DM, Jones L, et al. Collaborative genome-wide association analysis of 10,596 individuals supports a role for Ankyrin-G (ANK3) and the alpha-1C subunit of the L-type voltage-gated calcium channel (CACNA1C) in bipolar disorder. Nature Genetics. 2008;40:1056–1058. doi: 10.1038/ng.209. [DOI] [PMC free article] [PubMed] [Google Scholar]
- 4.International Schizophrenia Consortium Rare chromosomal deletions and duplications increase risk of schizophrenia. Nature. 2008;455:237–241. doi: 10.1038/nature07239. [DOI] [PMC free article] [PubMed] [Google Scholar]
- 5.Manolio TA, Collins FS, Cox NJ, Goldstein DB, Hindorff LA, Hunter DJ, et al. Finding the missing heritability of complex diseases. Nature. 2009;461:747–753. doi: 10.1038/nature08494. [DOI] [PMC free article] [PubMed] [Google Scholar]
- 6.Talkowski ME, Mansour H, Chowdari KV, Wood J, Butler A, Varma PG, et al. Novel, replicated associations between dopamine D3 receptor gene polymorphisms and schizophrenia in two independent samples. Biol Psych. 2006;60(6):570–577. doi: 10.1016/j.biopsych.2006.04.012. [DOI] [PubMed] [Google Scholar]
- 7.Georgieva L, Moskvina V, Peirce P, Norton N, Bray NJ, Jones L, et al. Convergent evidence that oligodendrocyte lineage transcription factor 2 and interacting genes influence susceptibility to schizophrenia. PNAS. 2006;103(33):12469–12474. doi: 10.1073/pnas.0603029103. [DOI] [PMC free article] [PubMed] [Google Scholar]
- 8.Cordell HJ. Epistasis: what it means, what it doesn't mean, and statistical methods to detect it in humans. Hum Mol Genet. 2002;11(20):2463–2468. doi: 10.1093/hmg/11.20.2463. [DOI] [PubMed] [Google Scholar]
- 9.He X, Qian W, Wang Z, Li Y, Zhang J. Prevalent positive epistasis in Escherichia coli and Saccharomyces cerevisiae metabolic networks. Nature Genetics. 2010;42:272–276. doi: 10.1038/ng.524. [DOI] [PMC free article] [PubMed] [Google Scholar]
- 10.Wellcome Trust Case Control Consortium Genome-wide association study of 14,000 cases of seven common diseases and 3,000 shared controls. Nature. 2007;447:661–678. doi: 10.1038/nature05911. [DOI] [PMC free article] [PubMed] [Google Scholar]
- 11.Smith EN, Bloss CS, Badner JA, Barrett T, Belmonte PL, Berrettini W, et al. Genome-wide association study of bipolar disorder in European American and African American individuals. Mol Psych. 2009;14:755–763. doi: 10.1038/mp.2009.43. [DOI] [PMC free article] [PubMed] [Google Scholar]
- 12.Moskvina V, Holmans P, Schmidt KM, Craddock N. Design of case-controls studies with unscreened controls. Annals of Human Genetics. 2005;69:566–576. doi: 10.1111/j.1529-8817.2005.00175.x. [DOI] [PubMed] [Google Scholar]
- 13.Marcini J, Donnelly P, Cardon LR. Genome-wide strategies for detecting multiple loci influencing complex diseases. Nature Genetics. 2005;37:413–417. doi: 10.1038/ng1537. [DOI] [PubMed] [Google Scholar]
- 14.O'Donovan MC, Craddock N, Norton N, Williams H, Peirce T, Moskvina V, et al. Identification of loci associated with schizophrenia by genome-wide association and follow-up. Nature Genetics. 2008;40:1053–1055. doi: 10.1038/ng.201. [DOI] [PubMed] [Google Scholar]
- 15.Craddock N, Jones L, Jones IR, Kirov G, Green EK, Grozeva D, et al. Strong genetic evidence for a selective influence of GABAA receptors on a component of the bipolar disorder phenotype. Mol Psych. 2010;15:146–153. doi: 10.1038/mp.2008.66. [DOI] [PMC free article] [PubMed] [Google Scholar]
- 16.Devlin B, Roeder K. Genomic control for association studies. Biometrics. 1999;55(4):997–1004. doi: 10.1111/j.0006-341x.1999.00997.x. [DOI] [PubMed] [Google Scholar]
- 17.Moskvina V, Craddock N, Holmans P, Nikolov I, Pahwa JS, Green E, et al. Gene-wide analyses of genome-wide association datasets: evidence for multiple common risk alleles for schizophrenia and bipolar disorder and for overlap in genetic risk. Mol Psych. 2009;14:252–260. doi: 10.1038/mp.2008.133. [DOI] [PMC free article] [PubMed] [Google Scholar]
- 18.Purcell S, Neale B, Todd-Brown K, Thomas L, Ferreira MAR, Bender D, et al. PLINK: a toolset for whole-genome association and population-based linkage analysis. Am J Hum Genet. 2007;81(3):559–575. doi: 10.1086/519795. [DOI] [PMC free article] [PubMed] [Google Scholar]
- 19.Cordell HJ. Detecting gene-gene interactions that underlie human diseases. Nature Reviews Genetics. 2009;10:392–404. doi: 10.1038/nrg2579. [DOI] [PMC free article] [PubMed] [Google Scholar]
- 20.Kam-Thong T, Czamara D, Tsuda K, Borgwardt K, Lewis CM, Erhardt-Lehmann A, et al. EPIBLASTER-Fast exhaustive two-locus epistasis detection strategy using graphical processing units. European J Hum Genet. 2010 doi: 10.1038/ejhg.2010.196. in press. [DOI] [PMC free article] [PubMed] [Google Scholar]
- 21.Kooperberg, LeBlanc Increasing the power of identifying gene × gene interactions in genome-wide association studies. Genetic Epidemiology. 2008;32:255–263. doi: 10.1002/gepi.20300. [DOI] [PMC free article] [PubMed] [Google Scholar]
- 22.Owen MJ, Craddock N, O'Donovan MC. Suggestion of roles for both common and rare risk variants in genome-wide studies of schizophrenia. Arch Gen Psych. 2010;67(7):667–673. doi: 10.1001/archgenpsychiatry.2010.69. [DOI] [PubMed] [Google Scholar]
- 23.Hu X, Liu Q, Zhang Z, Li Z, Wang S, He L, Shi Y. SHEsisEpi, a GPU-enhanced genome-wide SNP-SNP interaction scanning algorithm, efficiently reveals the risk of genetic epistasis in bipolar disorder. Cell Research. 2010 doi: 10.1038/cr.2010. [DOI] [PubMed] [Google Scholar]
- 24.Steffens M, Becker T, Sander T, Fimmers R, Herold C, Holler DA, et al. Feasible and Successful: Genome-Wide Interaction Analysis Involving All 1.9×10¹¹ Pair-Wise Interaction Tests. Hum Hered. 2010;69(4):268–284. doi: 10.1159/000295896. [DOI] [PubMed] [Google Scholar]
- 25.Speliotes EK, Willer CJ, Berndt SI, Monda KL, Thorleifsson G, Jackson AU, et al. Association analyses of 249,796 individuals reveal 18 new loci associated with body mass index. Nature Genetics. 2010;42:937–948. doi: 10.1038/ng.686. [DOI] [PMC free article] [PubMed] [Google Scholar]
- 26.Allen HL, Estrada K, Lettre G, Berndt SI, Weedon MN, Rivadeneira F, et al. Hundreds of variants clustered in genomic loci and biological pathways affect human height. Nature. 2010;467:832–838. doi: 10.1038/nature09410. [DOI] [PMC free article] [PubMed] [Google Scholar]
Associated Data
This section collects any data citations, data availability statements, or supplementary materials included in this article.