Abstract
A novel electrochemical method, termed flash chronopotentiometry (FCP), is used to develop a rapid and sensitive method to detect protease activities. In this method, an appropriate current pulse is applied across a polycation-selective polymer membrane to induce a strong flux of the polycationic peptides from the sample phase into the organic membrane of the electrode. During this current pulse, the cell potential (EMF) is monitored continuously, and is a function of the polypeptide concentration. The imposed current causes a local depletion of the polypeptide at the sample/membrane interface, which yields a drastic potential change in the observed chronopotentiogram at a characteristic time, called the transition time (τ). For a given magnitude of current, the square root of τ is directly proportional to the concentration of the polypeptide. Proteases cleave polypeptides into smaller fragments that are not favorably extracted into the membrane of the sensor. Therefore, a decrease in the transition time is observed during the proteolysis process. The degree of change in the transition time can be correlated to protease activity. To demonstrate this approach, the activities of trypsin and α-chymotrypsin are detected using protamine and synthetic polycationic oligopeptides that possess specific cleavage sites that are recognized by these proteases.
Keywords: Reversible polyion sensor, Chronopotentiometric detection, protease assays, polymeric membrane
Introduction
Proteases are enzymes that function by cleaving peptide bonds of natural protein substrates catalytically and specifically to produce smaller peptide fragments. They play critical roles in a number of biological and physiological processes such as blood clotting, digestion and a variety of cellular activities [1–3]. In addition, they are involved in a number of pathological processes [4–13]. Owing to their specificity, they are excellent biomarkers for disease diagnosis and inhibitors of these proteases are widely employed as therapeutic agents [14–16]. Thus, measurement of protease activities and developing assays that can screen for potential inhibitors is very important for disease diagnosis and drug development.
Many analytical techniques have been utilized to measure the activities of proteases [17–29]. Most often, simple UV-Vis absorption or fluorescence methods are employed along with non-physiological synthetic chromogenic or fluorogenic substrates to monitor protease activities [30–32]. While highly sensitive, it is often difficult to incorporate the entire amino acid sequence recognized by a protease into the synthetic chromogenic and fluorogenic substrates [33]. Furthermore, such spectroscopic assays are incapable of measuring protease activities in highly colored and turbid samples such as whole blood and cell culture suspensions.
Potentiometric sensors based on polymeric membrane polyion-selective electrodes have been successfully used previously to monitor various protease enzyme activities and inhibitors of given enzymes [33–37]. These sensors yield a large, non-equilibrium potentiometric response to protamine and similar polycationic oligopeptides and the magnitude of the observed potential change is related to the chain length and charge density of the polypeptides [38]. In the potentiometric protease activity assays, protamine and synthetic oligopeptides have been used as substrates and the change in the EMF has been monitored potentiometrically as the polypeptide is digested by the specific protease. Since the proteolytic products of the polypeptides are not favorably extracted into the polymeric membrane of the electrode [38], the sensor is much less sensitive to these species. Thus, after observing an initial EMF response to the substrate, the initial rate of change in the membrane potential (EMF) in the reverse direction is monitored after addition of the protease, and is proportional to the enzyme activity present. These sensors are simple, inexpensive and can be prepared as miniature devices. Moreover, they can work in highly colored media such as whole blood. However, the original potentiometric polyion membrane electrode sensors yield EMF responses that are inherently irreversible, limiting these sensors to single-use operations.
Fully reversible and stable pulsed chronopotentiometric polyion-selective electrodes have been reported recently and used for direct detection of protamine and potentially other polycations [39], as well as heparin and similar polyanions [40]. In this new method, a current pulse of fixed magnitude, duration and sign is applied across a polyion-selective membrane containing a lipophilic neutral salt of the form R+R− (where R+ and R− are a lipophilic cation and a lipophilic anion, respectively), to cause a flux of the polyion from the sample phase into the membrane. The phase boundary potential (related to polyion concentration in sample phase) is monitored as a function of time during the current pulse. This is followed by a zero-current measurement pulse period [41]. The equilibrium membrane ion concentrations are then restored by applying a baseline potential pulse for a longer time (usually ≥10-fold of the uptake current pulse time) [42]. These sensors have been used for detecting protease activities by employing measurement of potentials at the end of each current pulse after serially varying the concentrations of the enzymes added to a given level of protamine substrate [43,44]. However, there is no simple and direct way of measuring enzyme activities without prior calibration toward varying enzyme activities, which consumes considerable time and materials.
We report here a novel transduction protocol, called flash chronopotentiometry (FCP) [45–47], as a more rapid, sensitive and direct sensor of protease activities and their inhibitors. It will be shown that sensitive and rapid detection of trypsin and chymotrypsin activities, as well as soybean trypsin inhibitor can be achieved with the new FCP detection scheme using a polycation-sensitive polymer membrane electrode formulated with tridodecylmethylammonium-dinonylnaphthalenesulfonate (TDMA-DNNS), where DNNS serves as a polycationic peptide recognition element.
Experimental
Reagents
High molecular weight poly(vinyl chloride) (PVC), o-nitrophenyl octyl ether (o-NPOE), tridodecylmethylammonium chloride (TDMACl), dinonylnaphthalenesulfonic acid (DNNS), tetrahydrofuran (THF) and all salts were purchased from Fluka (Milwaukee, WI). Protamine sulfate (from herring), trypsin, α-chymotrypsin, and soybean trypsin inhibitor were purchased from Sigma (St. Louis, MO). The synthetic polypeptides were obtained from Celtek Bioscience, LLC (Nashville, TN). The inert salt tridodecylmethylammonium-dinonylnaphthalene sulfonate (TDMA-DNNS) was prepared by metathesis of TDMACl and DNNS (acid form) in a 1:1 molar ratio in benzene. Aqueous solutions were prepared by dissolving the appropriate compounds in Nanopure-deionized water (18.2 MOhm cm).
Membrane Preparation
The polycation-selective membrane (~200 µm thick) used to assemble the pulsed chronopotentiometric sensor was prepared by solvent casting using THF as the solvent, a membrane cocktail containing 10 wt% of the inert lipophilic salt TDMA-DNNS, 30 wt% PVC and 60 wt% o-NPOE.
Electrodes
The polymer membranes were cut with cork borer (6 mm diameter) from the parent membrane and incorporated onto an electrode body UnilSE MTO50 S7/120 (Oesch Sensor Technology, Sargans, Switzerland). The actual membrane area was 20 mm2. The inner solution (10 mM phosphate buffer, pH 7.4, with 10 mM NaCl) was in contact with an internal Ag/AgCl electrode. The external reference electrode was a double-junction Ag/AgCl electrode with saturated KCl as inner solution and a 1 M LiOAc as the bridge electrolyte. A high surface area coiled Pt-wire in contact with the sample solution was used as a counter electrode. The working electrodes were conditioned for at least 12 h prior to experiments and kept in the conditioning solution when not in use.
Experimental setup
A conventional three-electrode setup was used for the pulsed chronopotentiometric measurements with the polycation sensing membrane electrode, with the internal Ag/AgCl electrode of the membrane electrode connected as the working electrode and the external reference and counter electrodes were immersed into the sample solution. The measurements were made with an AFCBI bipotentiostat (Pine Instruments, Grove City, PA) controlled by a PCI-MIO-16E4 interface board and LabVIEW 8.6 data acquisition software (National Instruments, Austin, TX) on a PC computer. The potentials were sampled at 6 ms intervals and recorded and saved in two files as a raw data and as an averaged data during the last 10% time period of the cathodic current pulse and at the end of the zero current pulse period. An uptake (cathodic current pulse) time of 3 s, a zero-current pulse of 0.5 s and a stripping (potentiostatic pulse) time of 30 s were used throughout the flash chronopotentiometric experiments, unless specified otherwise. A baseline potential pulse of 0 V versus the Ag/AgCl reference electrode (as determined from initial measurements, where the stability of potential response and the return of the current to zero at the end of the potentiostatic pulse were monitored) was applied as the stripping potential throughout the experiments. All experiments were conducted at room temperature (21 – 23 °C).
Results and Discussion
As mentioned above, in the FCP detection mode, an appropriate cathodic current pulse is applied across a polymer membrane electrode to cause a strong flux of the polycationic peptide from the sample phase to the membrane while the potential is continuously monitored across the same membrane as a function of time. This causes a local depletion of the polypeptide at the membrane surface at a transition time (τ) and a strong potential drop (inflection) results in the chronopotentiogram (potential-time curve). For a given current, the square root of the transition time (τ) is directly proportional to the concentration of the polypeptide according to the well-known Sand equation (Equation 1).
| (Equation 1) |
where n is the net charge, c is the concentration and Daq is the diffusion coefficient of the polypeptide in the aqueous phase, F is Faraday’s constant, A is the membrane area and i is the absolute value of the applied current. Thus, the shift in the transition time is monitored as a function of time as the polypeptide substrate is catalytically hydrolyzed after a single injection of the specific protease and the activity of the protease can be determined from the rate of change in the transition time.
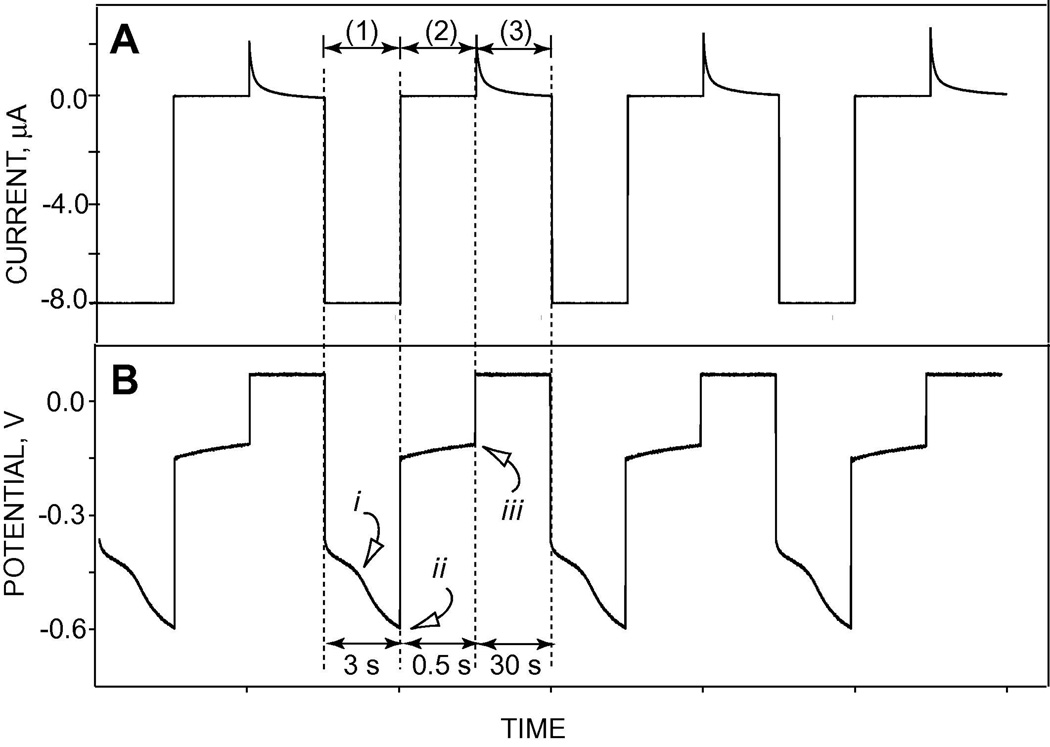
Figure 1-A shows the typical current-time trace and Figure 1-B shows observed potential-time behavior of a flash chronopotentiometric experiment in the presence of 100 µg/ml protamine in a background of 10 mM phosphate buffer containing 10 mM NaCl at pH 7.4, during the three-pulse sequences. A high and constant cathodic current pulse (−8 mA, in this case) is initially applied across a polymeric membrane formulated with the lipophilic neutral salt TDMA-DNNS while the potential is monitored at the same membrane (see pulse (1) in Figure 1) and recorded. Since the phase boundary potential at the membrane/sample interface changes in response to the concentration of the polyions at the interface, as the current flows, the local concentration of polycationic peptide is decreased, and this causes a break (inflection) in the resulting chronopotentiogram (see (i) in Figure 1B). A high concentration of hydrophilic ions is used in the inner filling solution to prevent a similar depletion on the back side of the membrane; hence, the voltage inflections observed (superimposed on IR drop across the membrane) are due to changes in polycation concentration during the 3 s current pulse.
Figure 1.
Current-time (A) and observed potential-time (B) responses of flash chronopotentiometry experiment in the presence of 100 µg/ml protamine in a background of 10 mM phosphate containing 10 mM NaCl at pH 7.4. (1), (2) and (3) show uptake current pulse, zero current pulse and baseline potential pulse, respectively. i indicates the inflection point in the potential-time curve when ion depletion occurs, while ii and iii show sampled potentials at the end of the applied current pulse and zero current pulse, respectively.
The cathodic current pulse is followed by a zero-current measurement pulse as shown by pulse (2) in Figure 1. Here, the phase boundary potential, which is a function of the polycation concentration, can be measured without the superimposition of iR drop. Then, a baseline (equilibrium) potential is applied across the membrane for a longer time to expel the ions extracted during the current pulse and regenerate the initial equilibrium membrane ion concentration profile (pulse (3)). This results in stable and reproducible potential responses (see (ii) and (iii) in Figure 1B).
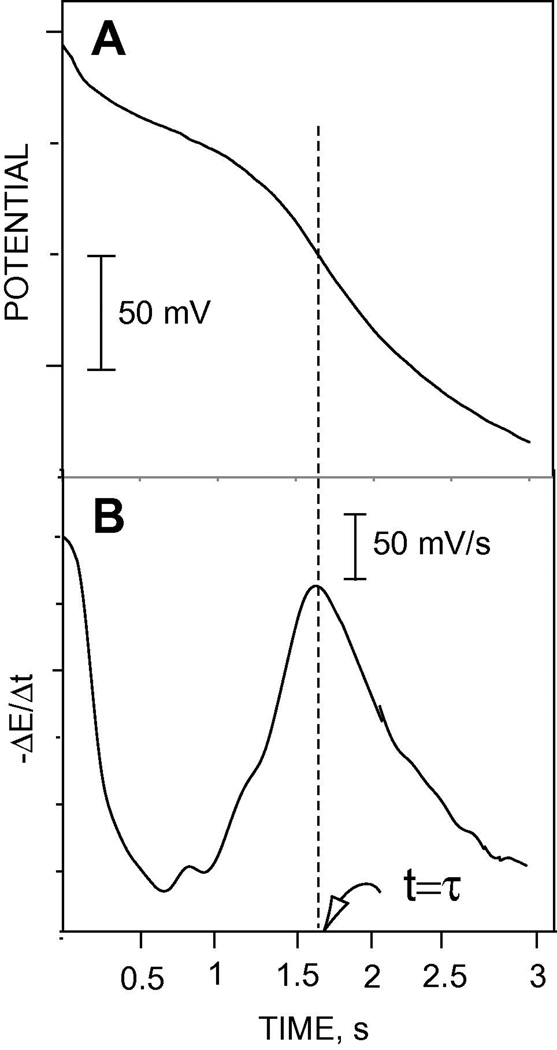
The data obtained during the first current pulse is used as the analytical signal in the flash chronopotentiometric mode of measurement. Figure 2A shows the potentiometric response of the flash chronopotentiometric sensor during the initial current pulse period (see pulse (1) in Figure 1B). A characteristic inflection point is observed in the chronopotentiogram at the transition time (t=τ) when the polycationic peptide at the sample/membrane interface is depleted. Figure 2B shows the first derivative of the data in Figure 2A. The transition time is directly obtained from the peak position in the first derivative curve or alternatively from the zero value of the second derivative of the chronopotentiometric data. Note that ion depletion can be avoided (when not needed) to measure in the regular pulstrode mode by using low magnitude of current or shorter current pulse time [39,40]. For example, if a current pulse <1.5 s in duration is used, no significant ion depletion of the polypeptide is observed (see Figure 2A). Also, a 3-s cathodic current pulse of ≤ 4 µA did not result in any significant polycation depletion (data not shown).
Figure 2.
(A) Potential-time response curve from pulse (1) period of Figure 1B and (B) first derivative curve of the data in Figure (2A). The transition time (τ) is clearly depicted as a peak point in the first derivative curve.
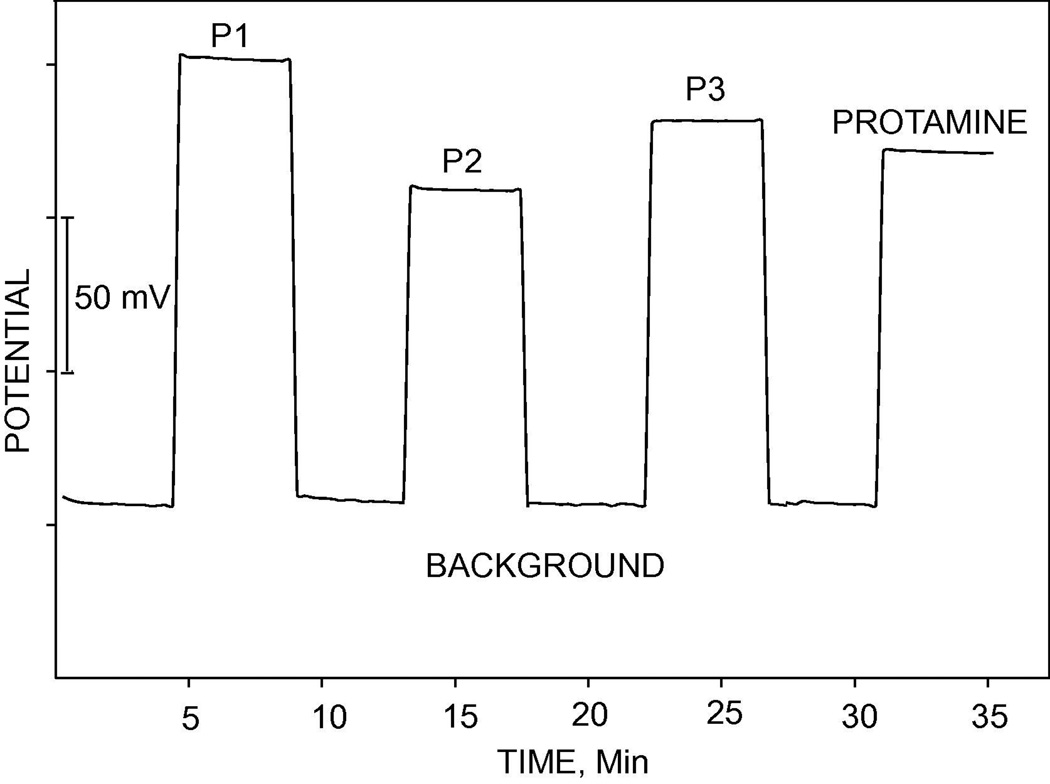
The key advantage of pulsed chronopotentiometric polyion sensors compared to classical potentiometric polyion sensors is the reversibility of the sensor response, which enables reuse of the sensors. Figure 3 shows the reversible, reproducible and sensitive EMF responses of TDMA-DNNS-based pulstrode sensor under the zero-current measurement mode upon alternate measurement in a given background solution (10 mM phosphate buffer containing 10 mM NaCl) and 100 µg/ml solutions of the various synthetic polypeptides and protamine in the same buffer. Each discrete section in the curve is composed of 16 data points recorded as averaged data during the last 10% of repetitive zero-current pulses (see (iii) in pulse (2) of Figure 1B). The amino acid sequences in protamine and the synthetic oligopeptides and the observed potential responses are shown in Table 1. The EMF responses of peptides (P1) and (P3) are greater than the others and this is likely due to the presence of the lipophilic amino acids F and L, respectively, which favor thermodynamically the extraction of the oligopeptides into the polymeric membrane [33]. This data demonstrates the significant potentiometric response that the membrane exhibits toward these polycationic substrates, once the membrane is polarized by a constant cathodic current of sufficient magnitude for a fixed period of time.
Figure 3.
Pulsed chronopotentiometric potential response of polyion sensor upon alternating measurement in a background solution and 100 µg/ml of protamine and the various oligopeptides (see Table 1 for the amino acid sequences). The potential was sampled as averaged value toward the end of the second (zero-current) measurement pulse. Each discrete portion in the curve is composed of 16 data points (see Figure 1).
Table 1.
Amino acid sequences in protamine and the synthetic oligopeptides viz., P1, P2 and P3 and observed potential responses under zero current mode of measurement (see Figure 3)
| Peptide | Amino acid Sequence | ΔEMF, mV |
|---|---|---|
| P1 | F-R-R-R-F-R-R-F-V-R-R-F-NH2 | 145 |
| P2 | V-R-R-R-R-P-R-R-V-NH2 | 103 |
| P3 | R-R-R-L-L-R-R-L-L-R-R-R | 126 |
| Protamine | A(P)-R-R-R-R-S-S-S-R-P-I(V)-R-R-R-R-P-RR-R(V)-T-T-R-R-R-R-A-G-R-R-R-R | 114 |
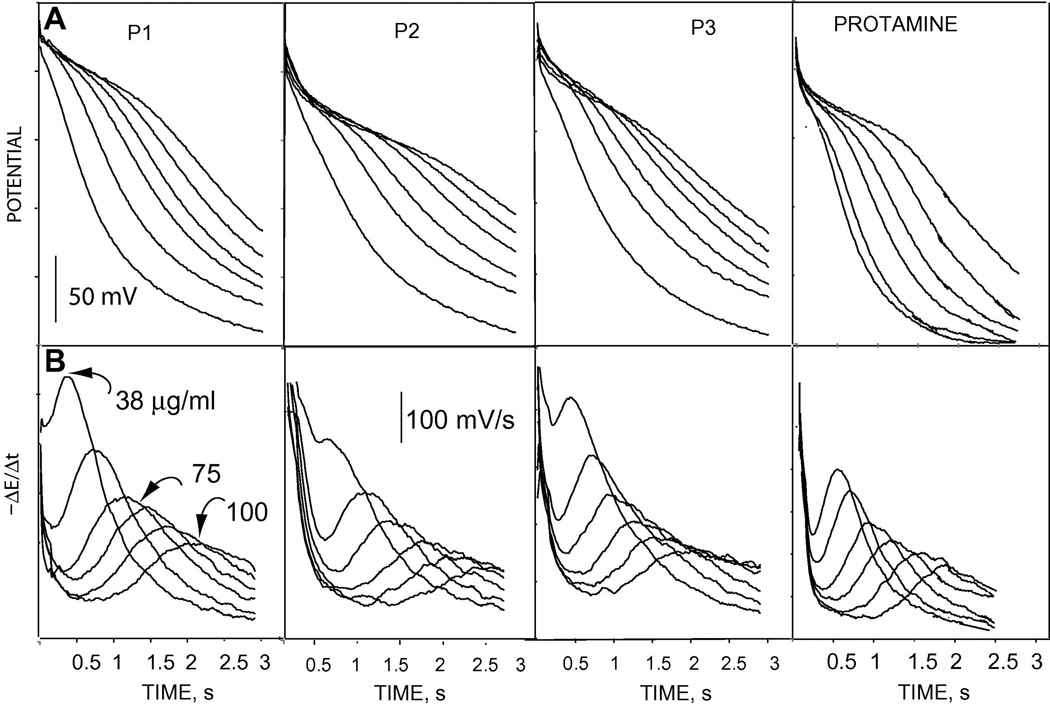
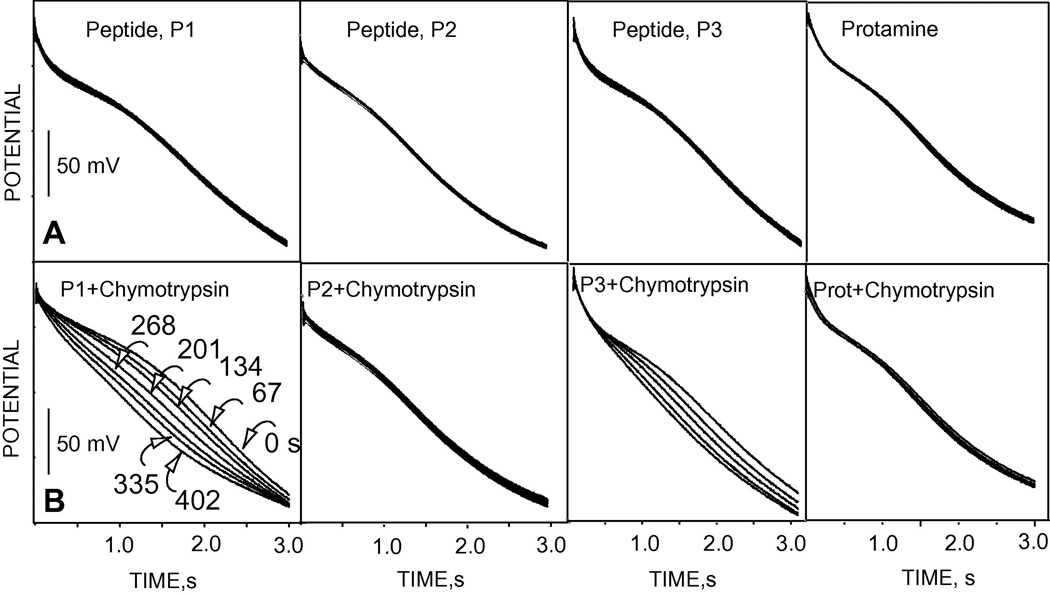
The analytically more useful flash chronopotentiometric responses to the various synthetic polypeptides and protamine are shown in Figure 4. The transition time varies as a function of the polypeptide concentration as clearly shown in the observed chronopotentiograms (Figure 4A) and the first derivative plots of the chronopotentiograms (Figure 4B). Proteases break the peptide bonds through specific proteolysis. The proteolytic products are not favorably extracted into the polymeric membrane. Thus, as the concentration of the polypeptide substrate at the sample/membrane interface decreases due to protease activity, a decrease in the transition time results (see Equation 1). This is clearly shown in Figure 5, where (A) shows the response of the flash chronopotentiometric sensor to 100 µg/ml of the various polypeptides and (B) shows the response to 100 µg/ml of the polypeptide after addition of 4 µl of 1 mg/ml α-chymotrypsin. The curves in (Figure 5A) show stable and reproducible (overlapping) responses of the sensor for 16 repetitive measurements of a constant concentration of the polypeptides under the applied current pulse (pulse (1)). The specificity of the protease α-chymotrypsin is shown in Figure 5B. Peptide P1 possesses a specific R-F bond cleavage site for the protease α-chymotrypsin. As a result, a decrease in the transition time is observed due to the degradation of P1 by the α-chymotrypsin. A slower reaction of α-chymotrypsin with P3 can also be observed from the decrease in the transition time as a function of reaction time. This interaction between the polypeptide P3 and α-chymotrypsin may be due to the presence of the lipophilic amino acid, leucine [33]. Peptide P2 and protamine do not contain the specific cleavage site for the enzyme α-chymotrypsin and thus no significant change in the transition time was observed as a function of the reaction time after addition of the enzyme.
Figure 4.
(A) Observed chronopotentiograms (flash chronopotentiometric potential-time responses) to varying concentrations of protamine and synthetic polycationic oligopeptides in a background of 10 mM phosphate buffer, pH 7.4 containing 10 mM NaCl and (B) first derivative of the data in (A); the numbers over the curves show concentrations of the peptides and the concentrations were varied in the same manner for all the peptides.
Figure 5.
Flash chronopotentiometric responses to 100 µg/ml each of the peptides before addition of α-chymotrypsin (A) and after addition of 4 µl of 1-mg/ml α-chymotrypsin to 5 ml of the test solution (B). The numbers over the chronopotentiograms under “P1+α-chymotrypsin” show the reaction time in seconds.
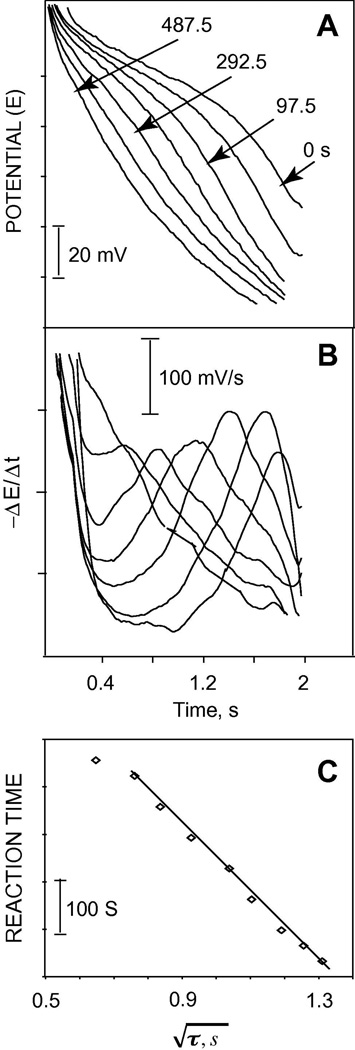
The activity of another important protease, trypsin, was studied using protamine as a substrate. Trypsin cleaves the R-R bonds specifically. A considerable shift in the transition time is observed as a function of reaction time after a single addition of 10 µl of 1 mg/ml trypsin to 50 ml of 100 µg/ml protamine (see Figure 6). Figure 6B shows the first derivative of the data in Figure 6A. A linear relationship is observed between the square root of the transition time and the digestion time at the beginning of the reaction. This rate of reaction, which is obtained from the change of transition time as a function of reaction time can be utilized to assay the enzymatic activity without the need for calibration experiment. The change in the square root of the transition time (τ), which is a direct function of the concentration of the polypeptide, can be utilized to assay the kinetics of the enzyme reaction (proteolysis) as follow:
| (Equation 2) |
The coefficient of the right-hand side of equation 2, (), is a constant, B, for a given diffusion coefficient. Thus, the change in concentration, Dc can be given by
| (Equation 3) |
Therefore, the rate of the enzymatic reaction, Δc/Δt, where Δt is the change in the reaction time can be easily evaluated from the rate of change of transition time as:
| (Equation 4) |
The rate of hydrolysis of protamine upon addition of 0.2 µg/ml (2.5 U/ml) of trypsin to 50 ml of 100 µg/ml protamine (see Figure 6 and associated text) was calculated to be 27 nM/s (0.135 µg/ml-s) using Equation 4, with |i| = 8µA, A=20 mm2, n=21, F=96500 Coulomb/mol, Daq=1.2×10⁻⁶ cm2/s [48], molecular weight of protamine 5 kDa, and and Δt obtained from the linear region of Figure 6C to be 0.086 s1/2 and 65 s, respectively. This value is in a good agreement with previous work [43,44]. In separate sets of experiments (data not shown), it was found that trypsin activity could be measured reliably in a concentration range of 0.25–75 U/ml (20–6100 ng/ml) using protamine as a substrate. Above 75 U/ml of trypsin, an abrupt break in the pulsed chronopotentiometric response was observed showing a complete hydrolysis of protamine, while below 0.25 U/ml of trypsin, no considerable shift in the transition time was observed after 20 min of incubation. This measuring range may be slightly extended by varying the substrate concentration and the magnitude and duration of the applied current (see Equation 1).
Figure 6.
(A) Flash chronopotentiometric response of pulstrode sensor to 50 ml of 100 µg/ml protamine after a single injection of 10 µl of 1 mg/ml trypsin; (B) first derivative of the data in (A); (C) linear dependence of the square root of transition time on the proteolysis time; the numbers over the curves show the reaction time.
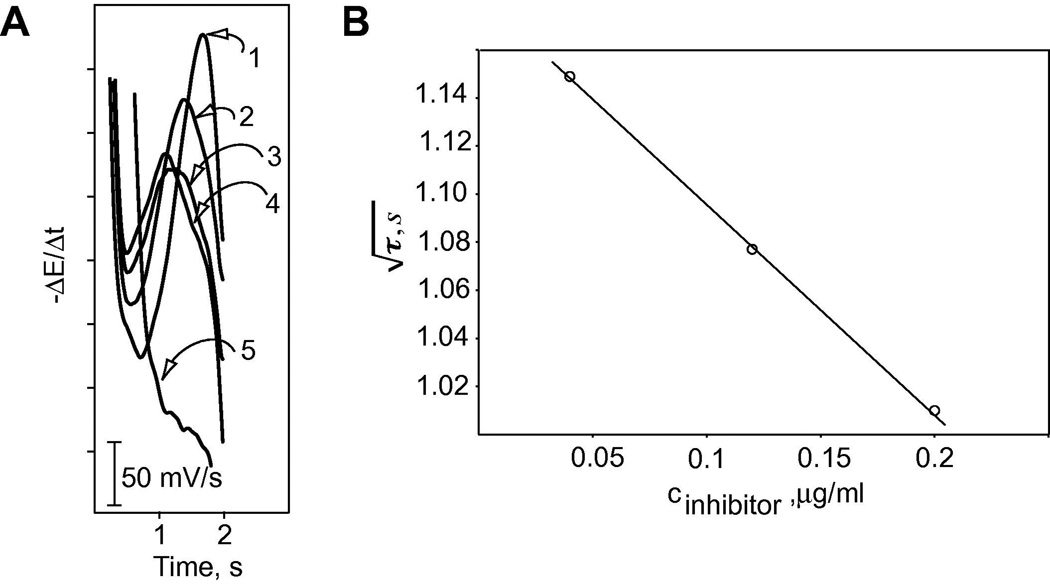
The ability to detect inhibition of protease reactions using the FCP measurement scheme is demonstrated for soybean trypsin inhibitor (see Fig. 7). Figure 7A, (1) shows the first derivative of pulsed chronopotentiometric response to 100 µg/ml of protamine without added trypsin and/or trypsin inhibitor, whereas (2), (3), (4) and (5) show the responses after additions of 80 µl of 1 mg/ml of trypsin incubated with 100, 60, 20 and 0 µl of 0.5 mg/ml soybean trypsin inhibitor. With an increased level of the inhibitor, the response approaches that of protamine in the absence of trypsin, showing that soybean trypsin inhibitor dramatically reduces the activity of trypsin. In the absence of the inhibitor (see 5), the protease completely consumes all of the protamine, as expected.
Figure 7.
(A) First derivative curves of flash chronopotentiometric response to 100 µg/ml protamine before addition of trypsin/soybean trypsin inhibitor (1) and after additions of 80 µl of 1 mg/ml trypsin incubated with 100 µl (2), 60 µl (3), 20 µl (4) and 0 µl (5) of 0.5 mg/ml soybean trypsin inhibitor for 0.5 h; (B) Linear relationship between the square root of transition time and the concentration of soybean trypsin inhibitor.
Conclusions
Flash chronopotentiometric sensors are very promising for rapid, sensitive and reliable detection of protease activities and their inhibitors. In this method, the change in the transition time is monitored as a function of time after a single injection of protease into the substrate solution and for analytes/media of known polycation diffusion coefficients, no pre-calibration experiments are required. This saves considerable amount of time and samples. The sensitivity of this technique for the detection of trypsin, ca 20 ng/ml, is quite acceptable for important analytical applications, although it is somewhat higher than common spectroscopic methods that utilize chromogenic substrates. However, such chromogenic assays cannot be conducted in highly colored media, like whole blood. Further, polycationic oligopeptide substrates can be prepared fairly easily by linking amino acid sequences that possess the characteristic cleavage sites that are recognized by the specific proteases to di- and triarginine sequences. Hence a number of proteases of biological importance that have not been studied thoroughly due to the lack of a convenient method of assay (can’t make suitable chromogenic substrate that exhibits high activity) can potentially be attempted by this simple, sensitive and inexpensive method.
Acknowledgment
The authors are grateful to the National Institutes of Health through grant EB-000784 for supporting this research.
References
- 1.Davie EW, Fujikawa K, Kisiel W. The coagulation cascade – initiation, maintenance and regulation. Biochem. 1991;30:10363–10370. doi: 10.1021/bi00107a001. [DOI] [PubMed] [Google Scholar]
- 2.Cleemann F, Karuso P. Fluorescence anisotropy assay for the traceless kinetic analysis of protein digestion. Anal. Chem. 2008;80:4170–4174. doi: 10.1021/ac7025783. [DOI] [PubMed] [Google Scholar]
- 3.Shekhawat SS, Porter JR, Sriprasad A, Ghosh I. An autoinhibited coiled-coil design strategy for split-protein protease sensors. J. Am. Chem. Soc. 2009;131:15284–15290. doi: 10.1021/ja9050857. [DOI] [PMC free article] [PubMed] [Google Scholar]
- 4.Stetler-Stevenson WG, Yu AE. Proteases in invasion: matrix metalloproteinases. Semin. Cancer Biol. 2001;11:143–152. doi: 10.1006/scbi.2000.0365. [DOI] [PubMed] [Google Scholar]
- 5.Hidalgo M, Eckhardt SG. Development of matrix metalloproteinase inhibitors in cancer therapy. J. Natl. Cancer I. 2001;93:178–193. doi: 10.1093/jnci/93.3.178. [DOI] [PubMed] [Google Scholar]
- 6.Reddy ST, Kumar NS, Venkateswerlu G. Identification and purification of the 69-kDa intracellular protease involved in the proteolytic processing of the crystal delta endotoxin of Bacillus thuringiensis subsp tenebrionis. Fems Micro. Lett. 2000;183:63–66. doi: 10.1111/j.1574-6968.2000.tb08934.x. [DOI] [PubMed] [Google Scholar]
- 7.Reddy YC, Venkateswerlu G. Intracellular proteases of Bacillus thuringiensis subsp kurstaki and a protease-deficient mutant Btk-q. Curr. Microbiol. 2002;45:405–409. doi: 10.1007/s00284-002-3767-9. [DOI] [PubMed] [Google Scholar]
- 8.DeLano FA, Schmid-Schonbein GW. Proteinase activity and receptor cleavage-Mechanism for insulin resistance in the spontaneously hypertensive rat. Hypertension. 2008;52:415–423. doi: 10.1161/HYPERTENSIONAHA.107.104356. [DOI] [PMC free article] [PubMed] [Google Scholar]
- 9.Lee SW, Song KE, Shin DS, Ahn SM, Ha ES, Kim DJ, Nam MS, Lee KW. Alterations in peripheral blood levels of TIMP-1, MMP-2, and MMP-9 in patients with type-2 diabetes. Diabetes Res. Clin. Pr. 2005;69:175–179. doi: 10.1016/j.diabres.2004.12.010. [DOI] [PubMed] [Google Scholar]
- 10.Singh RB, Dandekar SP, Elimban V, Gupta SK, Dhalla NS. Role of proteases in the pathophysiology of cardiac disease. Mol. Cel. Biochem. 2004;263:241–256. doi: 10.1023/B:MCBI.0000041865.63445.40. [DOI] [PubMed] [Google Scholar]
- 11.Molinari F, Meskanaite V, Munnich A, Sonderegger P, Colleaux L. Extracellular proteases and their inhibitors in genetic diseases of the central nervous system. Hum. Mol. Genet. 2003 Dec;:R195–R200. doi: 10.1093/hmg/ddg276. [DOI] [PubMed] [Google Scholar]
- 12.Lathia US, Ornatsky O, Baranov V, Nitz M. Multiplexed protease assays using element-tagged substrates. Anal. Biochem. 2011;408:157–159. doi: 10.1016/j.ab.2010.09.008. [DOI] [PMC free article] [PubMed] [Google Scholar]
- 13.Lathia US, Ornatsky O, Baranov V, Nitz M. Development of inductively coupled plasma-mass spectrometry-based protease assays. Anal. Biochem. 2010;398:93–98. doi: 10.1016/j.ab.2009.11.010. [DOI] [PMC free article] [PubMed] [Google Scholar]
- 14.Kim DH, Kim KB. Design of a novel type of zinc-containing protease inhibitor. J. Am. Chem. Soc. 1991;113:3200–3202. [Google Scholar]
- 15.Scott CJ, Taggart CC. Biologic protease inhibitors as novel therapeutic agents. Biochimie. 2010;92:1681–1688. doi: 10.1016/j.biochi.2010.03.010. [DOI] [PubMed] [Google Scholar]
- 16.Elie BT, Gocheva V, Shree T, Dalrymple SA, Holsinger LJ, Joyce JA. Identification and pre-clinical testing of a reversible cathepsin protease inhibitor reveals anti-tumor efficacy in a pancreatic cancer model. Biochimie. 2010;92:1618–1624. doi: 10.1016/j.biochi.2010.04.023. [DOI] [PMC free article] [PubMed] [Google Scholar]
- 17.Raijmakers R, Neerincx P, Mohammed S, Heck AJR. Cleavage specificities of the brother and sister proteases Lys-C and Lys-N. Chem. Commun. 2010;46:8827–8829. doi: 10.1039/c0cc02523b. [DOI] [PubMed] [Google Scholar]
- 18.Rao RN, Ramachandra B, Vali RM, Raju SS. LC-MS/MS studies of ritonavir and its forced degradation products. J. Pharmaceut. Biomed. 2010;53:833–842. doi: 10.1016/j.jpba.2010.06.004. [DOI] [PubMed] [Google Scholar]
- 19.Hirano A, Takahashi M, Kinoshita E, Shibata M, Nomura T, Yokomaku Y, Hamaguchi M, Sugiura W. High performance liquid chromatography using UV detection for the simultaneous quantification of the new non-nucleoside reverse transcriptase inhibitor etravirine (TMC-125), and 4 protease inhibitors in human plasma. Biolo. Pharmaceut. Bulletin. 2010;33:1426–1429. doi: 10.1248/bpb.33.1426. [DOI] [PubMed] [Google Scholar]
- 20.D'avolio A, Simiele M, Siccardi M, Baietto L, Sciandra M, Bonora S, Di Perri G. HPLC-MS method for the quantification of nine anti-HIV drugs from dry plasma spot on glass filter and their long term stability in different conditions. J. Pharmaceut. Biomed. 2010;52:774–780. doi: 10.1016/j.jpba.2010.02.026. [DOI] [PubMed] [Google Scholar]
- 21.Riva S, Chopineau J, Kieboom APG, Klibanov AM. Protease-catalyzed regioselective esterification of sugars and related-compounds in anhydrous dimethylformamide. J. Am. Chem. Soc. 1988;110:584–589. [Google Scholar]
- 22.Kumar AG, Nagesh N, Prabhakar TG, Sekaran G. Purification of extracellular acid protease and analysis of fermentation metabolites by Synergistes sp utilizing proteinaceous solid waste from tanneries. Bioresource Technol. 2008;99:2364–2372. doi: 10.1016/j.biortech.2007.05.001. [DOI] [PubMed] [Google Scholar]
- 23.Chen T, Lee TR, Liang WG, Chang WSW, Lyu PC. Identification of trypsin inhibitory site and structure determination of human SPINK2 serine proteinase inhibitor. Proteins. 2009;77:209–219. doi: 10.1002/prot.22432. [DOI] [PubMed] [Google Scholar]
- 24.Tsantrizos YS. The design of a potent inhibitor of the hepatitis C virus NS3 protease: BILN 2061 - From the NMR tube to the clinic. Biopolymers. 2004;76:309–323. doi: 10.1002/bip.20127. [DOI] [PubMed] [Google Scholar]
- 25.Lefkowitz RB, Marciniak JY, Hu CM, Schmid-Schonbein GW, Heller MJ. An electrophoretic method for the detection of chymotrypsin and trypsin activity directly in whole blood. Electrophoresis. 2010;31:403–410. doi: 10.1002/elps.200900424. [DOI] [PubMed] [Google Scholar]
- 26.Todd MJ, Gomez J. Enzyme kinetics determined using calorimetry: A general assay for enzyme activity. Anal. Biochem. 2001;296:179–187. doi: 10.1006/abio.2001.5218. [DOI] [PubMed] [Google Scholar]
- 27.Sun C, Su KH, Valentine J, Rosa-Bauza YT, Ellman JA, Elboudwarej O, Mukherjee B, Craik CS, Shuman MA, Chen FF, Zhang X. Time-resolved single-step protease activity quantification using nanoplasmonic resonator sensors. Acs Nano. 2010;4:978–984. doi: 10.1021/nn900757p. [DOI] [PMC free article] [PubMed] [Google Scholar]
- 28.Kim YP, Daniel WL, Xia ZY, Xie HX, Mirkin CA, Rao JH. Bioluminescent nanosensors for protease detection based upon gold nanoparticle-luciferase conjugates. Chem. Commun. 2010;46:76–78. doi: 10.1039/b915612g. [DOI] [PMC free article] [PubMed] [Google Scholar]
- 29.Marcondes MF, Torquato RJS, Assis DM, Juliano MA, Hayashi MAF, Oliveira V. Mitochondrial intermediate peptidase: Expression in Escherichia coli and improvement of its enzymatic activity detection with FRET substrates. Biochem. Biophys. Res. Com. 2010;391:123–128. doi: 10.1016/j.bbrc.2009.11.014. [DOI] [PubMed] [Google Scholar]
- 30.Hortin GL, Warshawsky I, Laude-Sharp M. Macromolecular chromogenic substrates for measuring proteinase activity. Clin. Chem. 2001;47:215–222. [PubMed] [Google Scholar]
- 31.Abuknesha RA, Jeganathan F, DeGroot R, Wildeboer D, Price RG. Detection of proteases using an immunochemical method with haptenylated-gelatin as a solid-phase substrate. Anal. Bioanal. Chem. 2010;396:2547–2558. doi: 10.1007/s00216-010-3540-z. [DOI] [PubMed] [Google Scholar]
- 32.Wang F, Krai P, Deu E, Bibb B, Lauritzen C, Pedersen J, Bogyo M, Klemba M. Biochemical characterization of Plasmodium falciparum dipeptidyl aminopeptidase 1. Mol. Biochem. Parasit. 2011;175:10–20. doi: 10.1016/j.molbiopara.2010.08.004. [DOI] [PMC free article] [PubMed] [Google Scholar]
- 33.Han IS, Ramamurthy N, Yun JH, Schaller U, Meyerhoff ME, Yang VC. Selective monitoring of peptidase activities with synthetic polypeptide substrates and polyion-sensitive membrane electrode detection. Faseb J. 1996;10:1621–1626. doi: 10.1096/fasebj.10.14.9002554. [DOI] [PubMed] [Google Scholar]
- 34.Han IS, Yun JH, Byun YR, Meyerhoff ME, Yang VCM. A novel assay for chymotrypsin utilizing a protamine-responsive polymer membrane-electrode as the probe. Mol. Biol. Cell. 1995;6:2591–2591. [Google Scholar]
- 35.Abd-Rabboh HSM, Nevins SA, Durust N, Meyerhoff ME. Electrochemical assay of protease activities based on polycation/polyanion complex as substrate and polyion sensitive membrane electrode detection. Biosens. Bioelectron. 2003;18:229–236. doi: 10.1016/s0956-5663(02)00181-1. [DOI] [PubMed] [Google Scholar]
- 36.Badr IHA, Ramamurthy N, Yang VC, Meyerhoff ME. Electrochemical assay of proteinase inhibitors using polycation-sensitive membrane electrode detection. Anal. Biochem. 1997;250:74–81. doi: 10.1006/abio.1997.2188. [DOI] [PubMed] [Google Scholar]
- 37.Chang LC, Meyerhoff ME, Yang VC. Electrochemical assay of plasminogen activators in plasma using polyion-sensitive membrane electrode detection. Anal. Biochem. 1999;276:8–12. doi: 10.1006/abio.1999.4299. [DOI] [PubMed] [Google Scholar]
- 38.Fu B, Bakker E, Yang VC, Meyerhoff ME. Extraction thermodynamics of polyanions into plasticized polymer membranes doped with lipophilic ion-exchangers - a potentiometric study. Macromolecules. 1995;28:5834–5840. [Google Scholar]
- 39.Shvarev A, Bakker E. Response characteristics of a reversible electrochemical sensor for the polyion protamine. Anal. Chem. 2005;77:5221–5228. doi: 10.1021/ac050101l. [DOI] [PubMed] [Google Scholar]
- 40.Gemene KL, Meyerhoff ME. Reversible detection of heparin and other polyanions by pulsed chronopotentiometric polymer membrane electrode. Anal. Chem. 2010;82:1612–1615. doi: 10.1021/ac902836e. [DOI] [PMC free article] [PubMed] [Google Scholar]
- 41.Makarychev-Mikhailov S, Shvarev A, Bakker E. Pulstrodes: Triple pulse control of potentiometric sensors. J. Am. Chem. Soc. 2004;126:10548–10549. doi: 10.1021/ja047728q. [DOI] [PubMed] [Google Scholar]
- 42.Jadhav S, Meir AJ, Bakker E. Normal pulse voltammetry as improved quantitative detection mode for amperometric solvent polymeric membrane ion sensors. Electroanalysis. 2000;12:1251–1257. [Google Scholar]
- 43.Xu Y, Shvarev A, Makarychev-Mikhailov S, Bakker E. Reversible detection of proteases and their inhibitors by a pulsed chronopotentiometric polyion-sensitive electrode. Anal. Biochem. 2008;374:366–370. doi: 10.1016/j.ab.2007.10.043. [DOI] [PMC free article] [PubMed] [Google Scholar]
- 44.Fordyce K, Shvarev A. Solid-cantact electrochemical polyion sensors for monitoring peptidase activities. Anal. Chem. 2008;80:827–833. doi: 10.1021/ac701775n. [DOI] [PubMed] [Google Scholar]
- 45.Gemene KL, Bakker E. Direct sensing of total acidity by chronopotentiometric flash titrations at polymer membrane ion-selective electrodes. Anal. Chem. 2008;80:3743–3750. doi: 10.1021/ac701983x. [DOI] [PMC free article] [PubMed] [Google Scholar]
- 46.Gemene KLG, Bakker E. Measurement of total calcium by flash chronopotentiometry at polymer membrane ion-selective electrodes. Anal. Chim. Acta. 2009;648:240–245. doi: 10.1016/j.aca.2009.07.004. [DOI] [PubMed] [Google Scholar]
- 47.Gemene KL, Bakker E. Flash chronopotentiometric sensing of the polyions protamine and heparin at ion-selective membranes. Anal. Biochem. 2009;386:276–281. doi: 10.1016/j.ab.2008.12.023. [DOI] [PubMed] [Google Scholar]
- 48.Yuan Y, Wang L, Amemiya S. Chronopotentiometry at Micropipet Electrodes for determination of diffusion coefficients and transferred charges at liquid/liquid interfaces. Anal. Chem. 2004;76:5570–5578. doi: 10.1021/ac0493774. [DOI] [PubMed] [Google Scholar]


