Abstract
The development and analysis of a microfluidic sample preconcentration system using a highly ion-conductive charge-selective polymer (poly-AMPS) is reported. The preconcentration is based on the phenomenon of concentration polarization which develops at the boundaries of the poly-AMPS with buffer solutions. A negatively charged polymer, poly-AMPS, positioned between two microchannels efficiently extracts cations through its large cross section, resulting in efficient anion sample preconcentration. The present work includes the development of a robust polymer that is stable over a wide range of buffers with varying chemical compositions. The sample preconcentration effect remains linear to over 3 mM (0.15 pmol) and 500 μM (15 fmol) for fluorescein and TRITC-tagged albumin solutions, respectively. The system can potentially be used for concentrating proteins on microfluidic devices with subsequent analysis for proteomic applications.
Introduction
Proteomic research involves the determination of protein function and structure within cellular organisms. Due to the large number and dynamic concentration range of proteins, the typical proteomic analysis involves a separation step followed by mass spectrometry (MS) for protein identification. A common analysis method would be 2D gel-electrophoresis with subsequent electrospray ionization (ESI) or matrix-assisted laser desorption ionization (MALDI).1 Microfabricated devices have been developed for rapid and automated ESI-MS analysis integrated with sample pretreatment and separation strategies.2,3 However, low ion transfer efficiency at the source, mass analyzer, and detection process in mass spectrometry makes sensitive detection challenging using microfabricated devices. The ability to concentrate the sample prior to sample analysis would improve the detection of the low level proteins.
Preconcentration methods utilize analyte characteristics such as charge, affinity, mobility, and size. Methods include field-amplified sample stacking,4–7 isotachophoresis,8–11 electrokinetic trapping,12–18 micellar electrokinetic sweeping,19–21 solid-phase extraction,22–25 isoelectric focusing,26–29 porous filtering,30–34 temperature gradient focusing,35 film electrode techniques,36 and programmable surface techniques.37 Among these, electrokinetic trapping has received much attention because its implementation in a lab-on-a-chip device is straightforward, shows high efficiency with charged biomolecules, does not require spatial or temporal buffer changes, and is compatible with subsequent analysis techniques such as capillary electrophoresis (CE). Electrokinetic trapping was demonstrated by Wang et al. at the interface between a micro- and nanochannel on a microfluidic device.13 By creating electric double-layer (EDL) overlap condition in charged nanochannels or nanoporous polymer, co-ions are excluded, and therefore the nano-structure acts as a counter-ion permselective channel. When an electric field is applied across the ion-permselective nanochannel, local electric field gradients and corresponding concentration polarization develop, resulting in sample preconcentration.38
Since its first demonstration, various structures and materials have been applied for improving the preconcentration efficiency. Horizontal nanochannels (width ≫ height) were fabricated by reversible bonding of PDMS to a glass substrate and surface-patterned Nafion® membrane.15,17 However, the low aspect ratio (height over width) of the horizontal nanochannels with respect to the main microchannels limits the counter-ion selective extraction efficiency due to the high resistance and low sample interaction with the nanochannel.14 Han's group further explored sample preconcentration at a cross-intersection where two opposing nanochannels were vertical in orientation (width ≪ height) with respect to the microchannels, yielding a better coupling between the nano- and microchannels.14,18 The vertical nanochannels span the microchannel's height, increasing the sample interaction and sample preconcentration efficiency. However, the nano-thin structure remains highly resistive compared to the micron-wide sample channel, limiting the counter-ion selective extraction efficiency. To increase the counter-ion selective extraction efficiency, an ion-permselective structure with comparable resistance and cross sectional area to the main microchannel would be desirable. Incorporating charged hydrophilic nanoporous polymers with high surface area instead of nanochannels is one way of achieving these conditions. Recently, Kim et. al. showed stable electrokinetic trapping using heterogeneous ionic hydrogel strips incorporated in a microchannel, however, the preconcentration efficiency was not characterized.39
We have previously developed and applied polyelectrolytic gel electrodes (PGEs) to microfluidic systems for velocimetry/cytometry,40 micromixing,41 and photothermal absorbance detection.42 The PGEs were photopolymerized in glass microfluidic channels and showed good electrical properties including low impedance, high frequency response, good reproducibility, and long-term stability. The PGEs in these previous works were all positively charged polymers. For consistency and comparison with previously published results using negatively charged nanochannels, a negatively charged polymer was fabricated. An important design criteria for the polymer structure included compatibility with common buffer systems of subsequent analysis methods. In this paper, we report a negatively charged hydrophilic polymer using 2-acrylamido-2-methyl-l-propanesulfonic acid (AMPS) for sample preconcentration by electrokinetic trapping. The low pKa value of the sulfonic group makes AMPS ideal for maintaining a negative charge over a wide pH range. The highly ion-conductive poly-AMPS was placed between microchannels, coupling them with a cross-sectional area on the same order as the microchannels. This results in more efficient counter-ion selective extraction and consequently higher yield sample preconcentration. The poly-AMPS based sample preconcentration system was analyzed and compared to nanochannel based systems.
Experimental Section
Reagents
All materials were used as received without further modification. TRITC-tagged albumin (tetramethylrhodamine isothiocyanate bovine albumin, lyophilized powder), Rhodamine 6G, sodium chloride (NaCl), AMPS, 2-hydroxy-4′-(2-hydroxyethoxy)-2-methylpropiophenone, N,N′-methylenebisacrylamide, and 3-(trimethoxysilyl)propyl methacrylate (TMSMA) were purchased from Sigma (St. Louis, MO). Glacial acetic acid and ethanol were purchased from Fisher Scientific (Fair Lawn, NJ). Fluorescein disodium salt dihydrate was purchased from Acros Organics (Geel, Belgium). All solutions were prepared using deionized water filtered through a Barnstead Nanopure Filtration System (Boston, MA). Buffer solutions were 10 mM phosphate buffer/15 mM NaCl at pH 7.4 unless otherwise stated.
Microchip fabrication
Glass microchip fabrication and channel coating procedures were based on previous work.42 Briefly, chrome/photoresist coated 4 inch square 0.9 mm thick B270 glass (Telic, Valencia, CA) was used as the base substrate. The desired pattern was exposed on the substrate with a maskless SF-100 photoexposure system (Intelligent Patterning, LLC, St. Petersburg, FL). The patterned substrate was developed using MF-319 (MicroChem, Corp, Newton, MA), and the chrome layer etched using chrome etchant (Transene, Danvers, MA). The substrate was then etched using a 10:1 buffered oxide etchant (Transene) to give channels 50 μm wide at full height and 12 μm deep. All channel lengths from chip center to reservoir were 8 mm. One-millimeter access holes were made using a MB-1000-1 powder blaster (Comco Inc., Burbank, CA). After removing the remaining chrome/photoresist layer, a 150 μm thick coverglass (Corning 2940-245, Corning, NY) was bonded to the patterned substrate. Cloning cylinders 6 mm in diameter (Fisher Scientific) were placed on top of the access holes and bonded using UV curable optical adhesive (NOA 63, Norland, Cranbury, NJ) to provide fluid reservoirs.
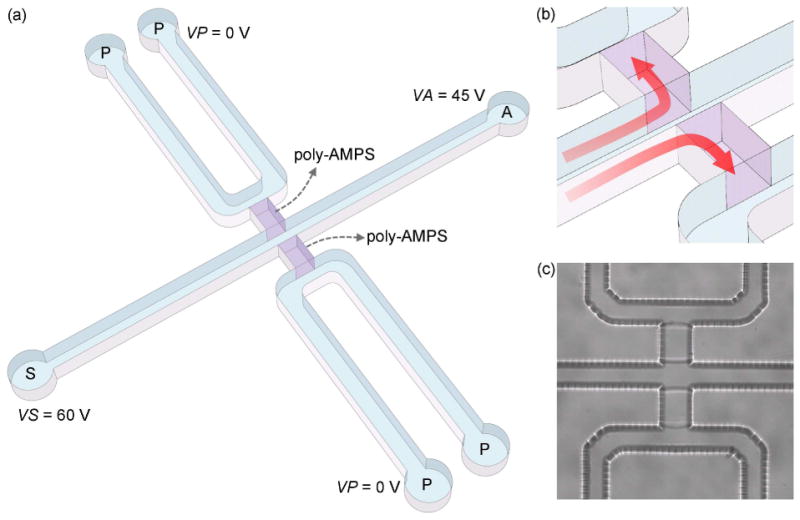
In-situ photopolymerization process for the poly-AMPS fabrication is based on previous works.40,41 TMSMA was coated inside the microchannels to covalently link the substrate and the polymer. 200 μL of TMSMA was diluted in 40 mL ethanol, and 1.2 mL of dilute acetic acid (1:10 glacial acetic acid:water) was added. The microchannels were filled with the dilute TMSMA solution for 3 min and then washed with ethanol and dried. Monomer, photo initiator, crosslinker concentrations as well as UV intensity and exposure time are important factors controlling the polymer pore size which determines the counter-ion selective extraction efficiency. The monomer solution was prepared with 2 M AMPS, 2% 2-hydroxy-4′-(2-hydroxyethoxy)-2-methylpropiophenone (photoinitiator) and 2% N,N′-methylenebisacrylamide (crosslinker). The microchip was filled with the monomer solution and aligned under a mask to define the polymer shape, and then exposed to UV light (365 nm) using a J200 UV Exposure System (OAI, Milpitas, CA) at 4.8 mW cm-2 for 30 s. After polymerization, the microchip was washed with a 1 M KC1 solution. All channels were flushed with 0.1 N NaOH for 3 min before each experiment. The chip design and the fabricated poly-AMPS in the microchannels are shown in Figure 1. All channel resistances were measured with a 6487 Picoammeter/Voltage Source (Keithley, Cleveland, Ohio) with 5V bias through Ag/AgCl electrodes before and after the polymer fabrication.
Figure 1.

Sample preconcentration microfluidic chip using poly-AMPS, (a) 3-D schematic of the microchip. (b) A magnified view of the area of poly-AMPS plugs. Large cross sectional area of the poly-AMPS enables efficient charge-selective extraction within a short period (red arrows). (c) The microscope CCD image that shows the poly-AMPS plugs in the microchannel. The polymeric plugs look transparent and only the boundaries are observable. VS, VA, and VP stand for the applied voltages to sample (S), analysis (A), and the polymer (P) channel reservoirs, respectively.
Optical system
Sample preconcentration and analysis was performed on a TE300 inverted microscope (Nikon, Melville, NY) equipped with a 10× objective, a high pressure mercury lamp, and a 16-bit resolution NTE/CCD-512-EBFT CCD camera (Roper Scientific, Trenton, NJ). Images were acquired every 30 seconds using IPLab (BD Biosciences Bioimaging, Rockville, MD). Neutral density filters were used to prevent CCD signal saturation. Data analysis was performed using custom software written in Matlab 7 (The MathWorks, Natick, MA).
Flow control
Flow control was performed using a high voltage power supply EMCO E10128 (EMCO, Sutter Creek, CA). Each output was connected to ground through a 10 MΩ resistor for current sink and stabilized by a 3 kV-rated, 680 pF radial disc capacitor (Panasonic-ECG, Secaucus, NJ). Voltages were applied to the fluid reservoirs using platinum wires, and controlled by a custom program written in LabVIEW 8.0 (National Instruments, Austin, TX) using the analog output of a NI-PCI 6713 DAQ board (National Instruments).
Results and Discussion
Chemical and electrical properties of poly-AMPS
The fabricated poly-AMPS was 65 × 12 × 80 μm in width, height, and length, respectively. The poly-AMPS was treated with various solvents including base (1 N NaOH), acid (1 N HC1), low ionic strength buffer (1 mM phosphate buffer, pH 7.4), deionized water, and organic solvents (methanol and ethanol). No change in its electrical characteristics or shape was detected. This stability over a wide range of chemical conditions ensures that poly-AMPS should be compatible with common buffer systems of subsequent analysis methods such as CE and ESI-MS.
Charge selectivity was investigated by monitoring the diffusion of charged molecules through the poly-AMPS. A 30 μM solution of cationic dye (Rhodamine 6G in 10 mM phosphate buffer at pH 7.4) easily diffused through the poly-AMPS. The same experiment repeated with a 50 μM solution of the anion fluorescein, showed no diffusion through the poly-AMPS, indicating anion exclusion due to the double-layer overlap in the nanoporous polymer structure. Therefore, the poly-AMPS can be applied for developing local electric field gradients and corresponding concentration polarization that is responsible for the sample preconcentration.
Maximizing the conductance of the poly-AMPS enhances its charge extraction ability resulting in an enhanced sample concentration effect. In order to determine the poly-AMPS conductance, the channel resistances were measured with different buffer concentrations before and after poly-AMPS fabrication (see supporting information, conductance measurement). The microchannels were modeled as resistors using Ohm's Law to determine how the polymer plug affected the channel resistance. Because all microchannel dimensions are identical, each microchannel resistance from the poly-AMPS to the reservoir, RCH, is identical. There was a negligible difference in the open channel resistance and the resistance in the same channel following poly-AMPS polymerization. The calculated relative resistance of poly-AMPS, Rp, to microchannel resistance, RCH, was also negligible (RP/RCH= 0.00819 (σ = 0.137)). In comparison, the relative resistance between the vertical nanochannel and microchannel was 5.96.18
Sample preconcentration process
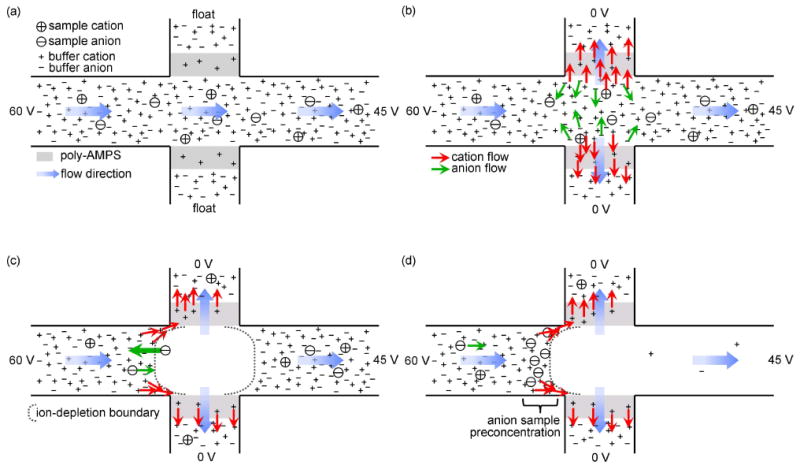
Figure 2 illustrates the mechanism involved in sample preconcentration process based on electrokinetic trapping using the poly-AMPS plugs integrated on a microfluidic chip. When P reservoirs are floated, sample solution simply flows along the sample and analysis channel (Figure 2a). When P reservoirs are grounded (VP = 0 V), cations are selectively extracted through the negatively charged polymer, poly-AMPS, and anions expelled from the area near poly-AMPS plugs to maintain the charge neutrality as shown in Figure 2b. As a result, an ion-depleted region develops between the poly-AMPS pair. The resistant substantially increases along the ion-depleted region where the electric field gradient becomes proportionally steeper than that in the rest of the microchannel. Therefore, electrophoretic force (EP) is locally augmented due to enhanced electric field in the sample channel side ion-depletion region while the sample channel flow rate caused by electroosmotic flow (EOF) does not change significantly. In this region, anion EP direction is in the opposite of the sample channel EOF, and therefore, anions initially entering the ion-depleted region experience an enhanced EP that drives back towards the sample reservoir (Figure 2c). Consequently, anions are stacked to the left of the ion-depletion boundary where the sample channel flow rate and EP find a balance as shown in Figure 2d. At the same time, cations keep being extracted through the poly-AMPS while the ion-depleted region is maintained.
Figure 2.

Sample preconcentration process based on electrokinetic trapping. (a) VS, VP, and VA are 60, float, and 45 V, respectively. Sample solution flows along the sample and analysis channel. (b) VP is 0 V. Only cations are extracted through the negatively charged polymer, poly-AMPS, while anions are expelled from the interface between polymeric plug and solution. (c)-(d) Then, ion-depletion region expands towards the analysis channel. Anions are stacked to the left of the ion-depletion boundary due to the concentration polarization. Blue arrows show flow direction at each location. Red and green arrows indicate cation and anion movement near the poly-AMPS, respectively.
Sample preconcentration results
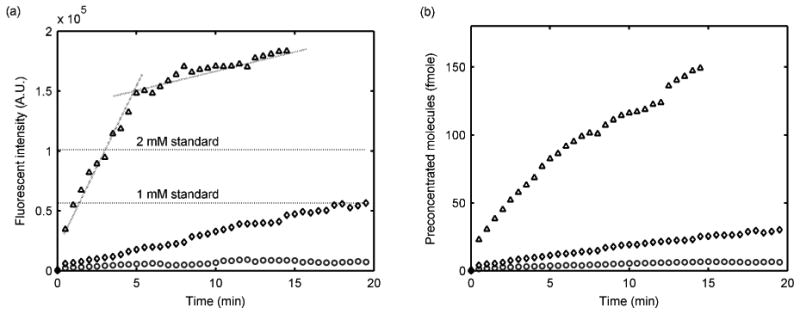
Figure 3 shows images of electrokinetic trapping sample preconcentration using the fabricated poly-AMPS based microchip. A solution of 10 μM fluorescein in 10 mM phosphate buffer/15 mM NaCl at pH 7.4 filled the main microchannel (Figure 3a). By applying voltages for flow control at VS, VP, and VA of 60, 0, and 45 V, respectively, fluorescein molecules begin concentrating to the left side of the depleted concentration polarization zone (Figure 3b). Figure 3c, d, and e show the signal intensity increasing over time (see supporting information, sample preconcentration). The sample concentrating process was analyzed with different initial sample concentrations (100 nM, 1 μM, and 10 μM) while applying voltages at VS, VP, and VA of 230, 0, and 140 V, respectively. The preconcentrated sample concentration was estimated by comparison to standard fluorescein solution fluorescence intensities (Figure 4a). During the 10 μM sample preconcentration experiment, the fluorescent intensity increased linearly for 5 min after which the concentrating effect leveled off, showing saturation after 20 min. However, the sample plug length continued to increase at this point, maintaining the rate at which molecules were being trapped. For this reason, the number of sample molecules concentrated was calculated based on integrated fluorescent intensities over the entire preconcentrated plugs, showing a linear increase (Figure 4b). The preconcentration effect maintained linearity until the preconcentrated sample concentration and quantity were as high as 3 mM and 0.15 pmole, respectively. The high cation selectivity and conductivity of the poly-AMPS is believed to be responsible for the high-yield preconcentration effect.
Figure 3.

Example of sample preconcentration. The channel was filled with 10 μM fluorescein in 10 mM PBS/15 mM NaCl at pH 7.4. VS, VP, and VA were 60, 0, and 45 V, respectively. (a) 0 s, (b) 2 s, (c), 4 s, (d) 6 s, and (e) 10 min. (a)-(d) images are contrast adjusted for better visualization. See supporting information.
Figure 4.

Sample preconcentration results with fluorescein in 10 mM PBS/15 mM NaCl, pH 7.4. (a) Fluorescent intensity and (b) number of molecules in the preconcentrated plug. ○, ◊, and Δ represent 100 nM, 1 μM, and 10 μM sample, respectively.
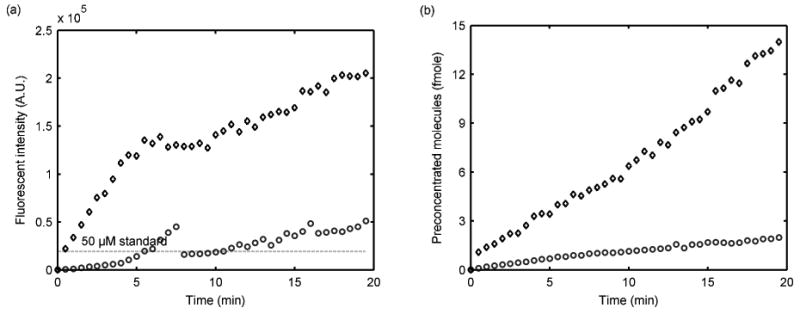
The same experiment was repeated with 100 nM and 1 μM of TRFTC-tagged albumin in the same buffer. Voltages applied at VS, VP, and VA were 60, 0, and 45 V, respectively. The pI value of bovine serum albumin is 4.7, therefore most of the sample should be negatively charged at the experimental pH. The fluorescence intensity was observed to increase with time with a discontinuity point for the 100 nM sample at 8 min due to a change in the preconcentrated sample plug shape (Figure 5a). However, the number of preconcentrated molecules kept increasing linearly during the course of the experiment up to 15 fmol (Figure 5b). The fluorescent intensity of the 1 μM sample showed the expected linear increase with time and eventually saturated at the equivalent of a 500 μM TRTTC-BSA solution (Figure 5a), much lower than the fluorescein saturation concentration. The different saturation concentrations originate from the different sample charges and solubilities in the buffer. Although the TRITC-tagged albumin showed a lower sample preconcentration effect, the plug size increased faster and the sample collecting speed was comparable to that of the fluorescein sample under the same experimental conditions.
Figure 5.

Sample preconcentration results with TRITC-tagged Albumin in 10 mM PBS/15 mM NaCl, pH 7.4. (a) Fluorescent intensity, (b) Number of molecules in the preconcentrated plug. ○ and ◊ represent 100 nM and 1 μM sample, respectively.
The high conductivity of poly-AMPS results in highly efficient cation extraction for high-yield sample preconcentration. In comparison, sample preconcentration with nanochannels showed a decreasing collection rate over time and lost linearity when the preconcentrated sample plug concentration was over 1 μM for green fluorescent protein solutions.13 Another important advantage of poly-AMPS in electrokinetic trapping application is its high buffer ion strength compatibility. The concentration mechanism requires EDL overlap in the nanochannel (or nanoporous polymer), which limits the buffer ion strength. For example, EDL thickness in a glass channel with 1 mM and 10 mM phosphate buffer (pH = 7.4) are about 6 nm and under 2 nm, respectively. This is the reason why most of preconcentration experiments using nanochannels (or nanoporous polymer) were performed with low (∼1 mM) ion strength buffers.14,39,43–45 This low ion strength buffer is not desirable for practical applications, particularly for cell analysis. The present work showed stable preconcentration with high ion strength buffer up to 20 mM phosphate + 45 mM KC1 at pH 9.1. However, the potential distribution near the preconcentration region is sensitive to the applied voltage at VS, VP, and VA due to the high conductivity. Therefore, the voltage should be precisely controlled within an appropriate range. Otherwise, the preconcentrating sample plug loses its stability and linearity. An example of an unstable sample preconcentration is available in supporting information (unstable sample preconcentration).
In conclusion, a highly ion-conductive charge-selective structure was fabricated with a negatively charged polymer, poly-AMPS, for a high-yield microfluidic preconcentration system. The wide range of buffer compatibility and high efficiency of the system can contribute to proteomics research by providing on-line preconcentration with increased sensitivity for subsequent separation and detection techniques, including CE with LIF or ESI-MS.
Supplementary Material
Acknowledgments
This research was sponsored by the National Heart Lung and Blood Institute proteomics initiative under Grant N01-HV-28182. This research was supported by the Nano/Bio Science & Technology Program (M10536090001-05N3609-00110) of the Ministry of Education, Science and Technology(MEST), by the MKE (Ministry of Knowledge Economy), Korea, under the ITRC (Information Technology Research Center) support program supervised by the NIPA (National IT Industry Promotion Agency) (NIPA-2009-(C1090-0902-0002)) and by the grant from the Industrial Source Technology Development Program (10033657) of the Ministry of Knowledge Economy (MKE) of Korea.
Footnotes
Supporting Information Available: Additional information on conductance measurement, sample preconcentration, and unstable sample preconcentration, as noted in the text.
References
- 1.Aebersold R, Mann M. Nature. 2003;422(6928):198–207. doi: 10.1038/nature01511. [DOI] [PubMed] [Google Scholar]
- 2.Lazar IM, Ramsey RS, Ramsey JM. Anal Chem. 2001;73(8):1733–1739. doi: 10.1021/ac001420+. [DOI] [PubMed] [Google Scholar]
- 3.Mellors JS, Gorbounov V, Ramsey RS, Ramsey JM. Anal Chem. 2008;80(18):6881–6887. doi: 10.1021/ac800428w. [DOI] [PMC free article] [PubMed] [Google Scholar]
- 4.Burgi DS, Chien RL. Anal Chem. 1991;63(18):2042–2047. [Google Scholar]
- 5.Kutter JP, Ramsey RS, Jacobson SC, Ramsey JM. Journal of Microcolumn Separations. 1998;10(4):313–319. [Google Scholar]
- 6.Lichtenberg J, Verpoorte E, Rooij NFd. Electrophoresis. 2001;22(2):258–271. doi: 10.1002/1522-2683(200101)22:2<258::AID-ELPS258>3.0.CO;2-4. [DOI] [PubMed] [Google Scholar]
- 7.Jung B, Bharadwaj R, Santiago JG. Electrophoresis. 2003;24(20):3476–3483. doi: 10.1002/elps.200305611. [DOI] [PubMed] [Google Scholar]
- 8.Everaerts FM, Verheggen TPEM, Mikkers FEP. J Chromatogr A. 1979;169(1):21–38. [Google Scholar]
- 9.Gebauer P, Bocek P. Electrophoresis. 2002;23(22):3858–3864. doi: 10.1002/elps.200290006. [DOI] [PubMed] [Google Scholar]
- 10.Vreeland WN, Williams SJ, Barron AE, Sassi AP. Anal Chem. 2003;75(13):3059–3065. doi: 10.1021/ac0259921. [DOI] [PubMed] [Google Scholar]
- 11.Wainright A, Williams SJ, Ciambrone G, Xue Q, Wei J, Harris D. J Chromatogr A. 2002;979(1):69–80. doi: 10.1016/s0021-9673(02)01246-3. [DOI] [PubMed] [Google Scholar]
- 12.Astorga-Wells J, Swerdlow H. Anal Chem. 2003;75(19):5207–5212. doi: 10.1021/ac0300892. [DOI] [PubMed] [Google Scholar]
- 13.Wang YC, Stevens AL, Han J. Anal Chem. 2005;77(14):4293–4299. doi: 10.1021/ac050321z. [DOI] [PubMed] [Google Scholar]
- 14.Kim SJ, Han J. Anal Chem. 2008;80(9):3507–3511. doi: 10.1021/ac800157q. [DOI] [PMC free article] [PubMed] [Google Scholar]
- 15.Lee JH, Song YA, Han JY. Lab Chip. 2008;8(4):596–601. doi: 10.1039/b717900f. [DOI] [PMC free article] [PubMed] [Google Scholar]
- 16.Wang YC, Han JY. Lab Chip. 2008;8(3):392–394. doi: 10.1039/b717220f. [DOI] [PMC free article] [PubMed] [Google Scholar]
- 17.Kim SM, Burns MA, Hasselbrink EF. Anal Chem. 2006;78(14):4779–4785. doi: 10.1021/ac060031y. [DOI] [PubMed] [Google Scholar]
- 18.Lee JH, Chung S, Kim SJ, Han JY. Anal Chem. 2007;79(17):6868–6873. doi: 10.1021/ac071162h. [DOI] [PMC free article] [PubMed] [Google Scholar]
- 19.Quirino JP, Terabe S. Science. 1998;282(5388):465–468. doi: 10.1126/science.282.5388.465. [DOI] [PubMed] [Google Scholar]
- 20.Sera Y, Matsubara N, Otsuka K, Terabe S. Electrophoresis. 2001;22(16):3509–3513. doi: 10.1002/1522-2683(200109)22:16<3509::AID-ELPS3509>3.0.CO;2-Z. [DOI] [PubMed] [Google Scholar]
- 21.Liu YJ, Foote RS, Jacobson SC, Ramsey JM. Lab Chip. 2005;5(4):457–465. doi: 10.1039/b416414h. [DOI] [PubMed] [Google Scholar]
- 22.Berrueta LA, Gallo B, Vicente F. Chromatographia. 1995;40(8):474–483. [Google Scholar]
- 23.Broyles BS, Jacobson SC, Ramsey JM. Anal Chem. 2003;75(11):2761–2767. doi: 10.1021/ac025503x. [DOI] [PubMed] [Google Scholar]
- 24.Hoyt AM, Beale SC, Larmann JP, Jorgenson JW. Journal of Microcolumn Separations. 1993;5(4):325–330. [Google Scholar]
- 25.Yu C, Davey MH, Svec F, Frechet JMJ. Anal Chem. 2001;73(21):5088–5096. doi: 10.1021/ac0106288. [DOI] [PubMed] [Google Scholar]
- 26.Kohlheyer D, Eijkel JCT, Schlautmann S, van den Berg A, Schasfoort RBM. Anal Chem. 2007;79(21):8190–8198. doi: 10.1021/ac071419b. [DOI] [PubMed] [Google Scholar]
- 27.Cui HC, Horiuchi K, Dutta P, Ivory CF. Anal Chem. 2005;77(24):7878–7886. doi: 10.1021/ac050781s. [DOI] [PubMed] [Google Scholar]
- 28.Tan W, Fan ZH, Qiu CX, Ricco AJ, Gibbons I. Electrophoresis. 2002;23(20):3638–3645. doi: 10.1002/1522-2683(200210)23:20<3638::AID-ELPS3638>3.0.CO;2-Y. [DOI] [PubMed] [Google Scholar]
- 29.Wen J, Lin Y, Xiang F, Matson DW, Udseth HR, Smith RD. Electrophoresis. 2000;21(1):191–197. doi: 10.1002/(SICI)1522-2683(20000101)21:1<191::AID-ELPS191>3.0.CO;2-M. [DOI] [PubMed] [Google Scholar]
- 30.Khandurina J, Jacobson SC, Waters LC, Foote RS, Ramsey JM. Anal Chem. 1999;71(9):1815–1819. doi: 10.1021/ac981161c. [DOI] [PubMed] [Google Scholar]
- 31.Khandurina J, McKnight TE, Jacobson SC, Waters LC, Foote RS, Ramsey JM. Anal Chem. 2000;72(13):2995–3000. doi: 10.1021/ac991471a. [DOI] [PubMed] [Google Scholar]
- 32.Song S, Singh AK, Kirby BJ. Anal Chem. 2004;76(15):4589–4592. doi: 10.1021/ac0497151. [DOI] [PubMed] [Google Scholar]
- 33.Wei W, Yeung ES. Anal Chem. 2002;74(15):3899–3905. doi: 10.1021/ac025612b. [DOI] [PubMed] [Google Scholar]
- 34.Foote RS, Khandurina J, Jacobson SC, Ramsey JM. Anal Chem. 2005;77(1):57–63. doi: 10.1021/ac049136w. [DOI] [PubMed] [Google Scholar]
- 35.Ross D, Locascio LE. Anal Chem. 2002;74(11):2556–2564. doi: 10.1021/ac025528w. [DOI] [PubMed] [Google Scholar]
- 36.Lin YC, Ho HC, Tseng CK, Hou SQ. Journal of Micromechanics and Microengineering. 2001;11(3):189–194. [Google Scholar]
- 37.Huber DL, Manginell RP, Samara MA, Kim BI, Bunker BC. Science. 2003;301(5631):352–354. doi: 10.1126/science.1080759. [DOI] [PubMed] [Google Scholar]
- 38.Hlushkou D, Dhopeshwarkar R, Crooks RM, Tallarek U. Lab Chip. 2008;8(7):1153–1162. doi: 10.1039/b800549d. [DOI] [PubMed] [Google Scholar]
- 39.Kim P, Kim SJ, Han J, Sun KY. Nano Lett. 2010;10(1):16–23. doi: 10.1021/nl9023319. [DOI] [PMC free article] [PubMed] [Google Scholar]
- 40.Chun HG, Chung TD, Kim HC. Anal Chem. 2005;77(8):2490–2495. doi: 10.1021/ac048535o. [DOI] [PubMed] [Google Scholar]
- 41.Chun H, Kim HC, Chung TD. Lab Chip. 2008;8(5):764–771. doi: 10.1039/b715229a. [DOI] [PubMed] [Google Scholar]
- 42.Chun HG, Dennis PJ, Ferguson ER, Alarie JP, Jorgenson JW, Ramsey JM. microTAS. San Diego, CA: Oct 12-16, 2008. pp. 934–936. [Google Scholar]
- 43.Kim SJ, Li LD, Han J. Langmuir. 2009;25(13):7759–7765. doi: 10.1021/la900332v. [DOI] [PMC free article] [PubMed] [Google Scholar]
- 44.Datta A, Gangopadhyay S, Temkin H, Pu QS, Liu SR. Talanta. 2006;68(3):659–665. doi: 10.1016/j.talanta.2005.05.011. [DOI] [PubMed] [Google Scholar]
- 45.Pu QS, Yun JS, Temkin H, Liu SR. Nano Lett. 2004;4(6):1099–1103. [Google Scholar]
Associated Data
This section collects any data citations, data availability statements, or supplementary materials included in this article.


