Abstract
Head motion is difficult to avoid in long PET studies, degrading the image quality and offsetting the benefit of using a high-resolution scanner. As a potential solution in an integrated MR-PET scanner, the simultaneously acquired MR data can be used for motion tracking. In this work, a novel data processing and rigid-body motion correction (MC) algorithm for the MR-compatible BrainPET prototype scanner is described and proof-of-principle phantom and human studies are presented.
Methods
To account for motion, the PET prompts and randoms coincidences as well as the sensitivity data are processed in the line or response (LOR) space according to the MR-derived motion estimates. After sinogram space rebinning, the corrected data are summed and the motion corrected PET volume is reconstructed from these sinograms and the attenuation and scatter sinograms in the reference position. The accuracy of the MC algorithm was first tested using a Hoffman phantom. Next, human volunteer studies were performed and motion estimates were obtained using two high temporal resolution MR-based motion tracking techniques.
Results
After accounting for the physical mismatch between the two scanners, perfectly co-registered MR and PET volumes are reproducibly obtained. The MR output gates inserted in to the PET list-mode allow the temporal correlation of the two data sets within 0.2 s. The Hoffman phantom volume reconstructed processing the PET data in the LOR space was similar to the one obtained processing the data using the standard methods and applying the MC in the image space, demonstrating the quantitative accuracy of the novel MC algorithm. In human volunteer studies, motion estimates were obtained from echo planar imaging and cloverleaf navigator sequences every 3 seconds and 20 ms, respectively. Substantially improved PET images with excellent delineation of specific brain structures were obtained after applying the MC using these MR-based estimates.
Conclusion
A novel MR-based MC algorithm was developed for the integrated MR-PET scanner. High temporal resolution MR-derived motion estimates (obtained while simultaneously acquiring anatomical or functional MR data) can be used for PET MC. An MR-based MC has the potential to improve PET as a quantitative method, increasing its reliability and reproducibility which could benefit a large number of neurological applications.
Keywords: PET, MRI, multimodality imaging, motion tracking, motion correction
INTRODUCTION
Simultaneous MR-PET data acquisition (1-6) permits temporal correlation of the signals from the two modalities, opening up opportunities impossible to realize using sequentially acquired data. One such example is using the MR information for PET data motion correction (MC). Typically, subject motion is difficult to avoid and can lead to degradation (blurring) of PET images and to severe artifacts when motion has large amplitude. In the case of neurological PET studies performed using stand-alone PET scanners efforts have been made to minimize these effects by using different techniques to restrain the head of the subject, but these methods have had limited success (7, 8). Alternatively, methods to correct for head movements have been investigated (7-14). The simplest technique consists of realigning individual frames to a reference position (e.g. using a mutual information algorithm) and summing them together to create a single volume. In a variation of this method, video cameras were used to monitor the motion of the head and a new frame was started each time motion above a set threshold was detected. These image-based methods allow a frame-by-frame correction to be implemented but do not account for motion within the pre-defined frame. Furthermore, low statistics images obtained from very short duration frames are sometimes used, making the software co-registration less accurate.
A more sophisticated method previously proposed consisted of obtaining more detailed motion estimates using external monitors that track the motion of sensors placed on the head of the subject. For example, Bloomfield et al. demonstrated that it is possible to perform MC during a brain PET study using the Polaris optical tracking system (9). This work has been extended by Rahmim et al. using axially rebinned list-mode data (10) and Carson et al. with the MOLAR reconstruction using list-mode data at full resolution (11). Combining the optical motion tracking method with list-mode data acquisition, an event-by-event (or extremely short frames depending on the temporal resolution of the tracking device) MC can be performed before image reconstruction (the most precise method actually applies MC on LOR data and reconstructs them in list-mode (11)). Using the motion information an event detected in one LOR can be reassigned offline to the correct LOR using a simple spatial transformation. Although this method has the potential of producing the most accurate results, there are some limitations. For example, events may be detected in LORs that have different efficiencies than the ones the events are reassigned to, forcing a normalization on- the-flight. Because of the limited extent of the PET scanner FOV in the axial and radial directions, events that would have normally gone undetected are repositioned in the FOV, and conversely, some detected events need to be discarded after correction as they fall outside the FOV. Any gaps present between the detectors further complicate this problem. Furthermore, the precision of the optical tracking methods is limited by the residual freedom of the reflectors positioned on the subject’s head. To address this problem, a promising technique is currently being developed that uses video cameras and structured light to observe a portion of the patient’s face (12). However, all these methods require an unobstructed view of the optical sensors from outside the scanner, which is not the case on an integrated MR-PET scanner because of the presence of the RF coils.
In a combined MR-PET scanner, the MR data acquired simultaneously with the PET data could be used for providing high temporal resolution motion tracking and replacing an optical tracking system. An MR-based MC approach could also eventually be used in more difficult situations such as correcting for internal motion associated with respiratory or cardiac activity, especially outside the brain. External markers can at best approximate the motion of organs assuming a rigid body transformation, while the MR data could be used to more accurately model the movement of the internal organs using non-rigid body transformations.
In this work, rigid-body MR-assisted PET MC was demonstrated. First, a MC algorithm in LOR space is proposed. Next, the quantitative accuracy of this correction algorithm was tested in phantom experiments. Finally, proof-of-principle studies in human volunteers were performed.
MATERIALS AND METHODS
Integrated MR-PET Scanner
PET Scanner Geometry
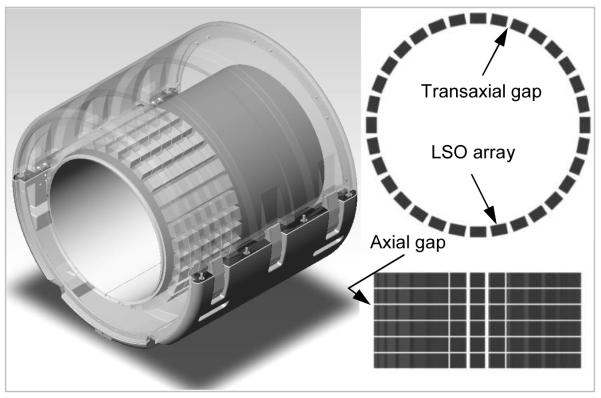
The BrainPET prototype is a dedicated-brain scanner that can be operated inserted into the bore of the Siemens MAGNETOM 3T MR scanner, a TIM system. Its main characteristics are summarized in Table 1. Briefly, there are 32 detector cassettes that make up the PET gantry, each consisting of six detector blocks (Fig. 1). Each detector block consists of a 12×12 array of LSO crystals readout by a 3×3 array of magnetic field-insensitive avalanche photodiodes (APDs). To minimize the potential for interference with the MR system, each cassette was individually shielded. This introduced a 6 mm gap between adjacent heads in the same ring (i.e. there are 32 gaps in the transaxial direction). Additionally, there is a one crystal size gap between the blocks in the same cassette (i.e. there are five 2.5 mm gaps in the axial direction).
TABLE 1.
BrainPET scanner characteristics
| Characteristic | Value | |
|---|---|---|
| Scintillator | Crystal material | LSO |
| Crystal size (mm3) | 2.5×2.5×20 | |
| Crystals per detector block | 12×12 | |
| Photon detector | Hamamatsu APD | 8664-55 |
| Size (mm2) | 5×5 | |
| APDs per detector block | 3×3 | |
| System | No. of detector blocks | 192 |
| No. of crystals | 27,648 | |
| Axial FOV (cm) | 19.25 | |
| Transaxial FOV (cm) | 32 | |
| Gantry inner diameter (cm) | 36 | |
| Gantry outer diameter (cm) | 60 | |
| Dataset | No. of LORs | 226,934,784 |
| No. of sinograms (3D) | 1,399 | |
| Axial compression: | ||
| span | 9 | |
| maximum ring difference | 67 | |
| Sinogram size | 256×192 | |
| Image size | 256×256 | |
| No. of imaging planes | 153 | |
| Recon. voxel size (mm3) | 1.25×1.25×1.25 |
FIGURE 1.
BrainPET scanner – 3D rendering showing the placement of the detector blocks inside the gantry (left). Transaxial (top right) and axial (bottom right) sections illustrating the gaps between the LSO arrays: 32 in the transaxial plane and 5 in the axial direction.
Data Processing and Image Reconstruction Workflow
Coincidence event data are acquired and stored in list-mode format. A look-up-table is then used to assign each pair of crystals to a particular LOR. LORs are then rebinned using nearest neighbor approximation into an arbitrary size parallel projection space (sinograms). A total of 1399 sinograms (span=9, maximum ring difference=67) are produced, each consisting of 192 angular projections and 256 radial elements. A set of sinograms – prompts and randoms – are obtained after data rebinning and histogramming. The calculation of random coincidences is performed sorting the delayed coincidences into delayed single maps from which the total singles rate as well as the variance reduced randoms are estimated (13).
The sensitivity LOR data are acquired with a plane source which is scanned in 16 positions, for 4 hours per position. The normalization is obtained by sorting these data into sinogram space, removing the dwell, then the outliers, reintroducing the dwell and inverting. The head attenuation map is obtained using a recently implemented MR-based attenuation correction (AC) method (14). Briefly, this AC method relies on novel dual-echo ultra-short echo sequences (DUTE) to segment the head in three compartments (i.e. soft tissue, bone tissue and air cavities) and combine this with the RF coil attenuation map obtained from a CT scan. The complete attenuation map thus obtained is forward projected and exponentiated to obtain the attenuation correction sinogram.
The scatter sinogram is obtained using a calculation method based on the single scatter estimation method proposed by Watson (15). The implementation has been revisited for improving the speed, allowing a full 3D calculation (Inki Hong, private communication). First the normalization and attenuation corrected emission volume is reconstructed. Second, a scatter estimate is obtained by simulation from this volume and the attenuation map. Third, the scatter estimate is scaled axially to fit the tails of the normalized true data which accounts for the out of field of view scatter.
The images are reconstructed using the Ordinary Poisson Ordered Subset Expectation Maximization (OP-OSEM) 3D algorithm from prompt and expected random coincidences, normalization, attenuation and scatter coincidences using 16 subsets and 6 iterations (16). The reconstructed volume consists of 153 slices with 256×256 pixels (1.25×1.25×1.25 mm3).
PET Motion Correction Algorithm
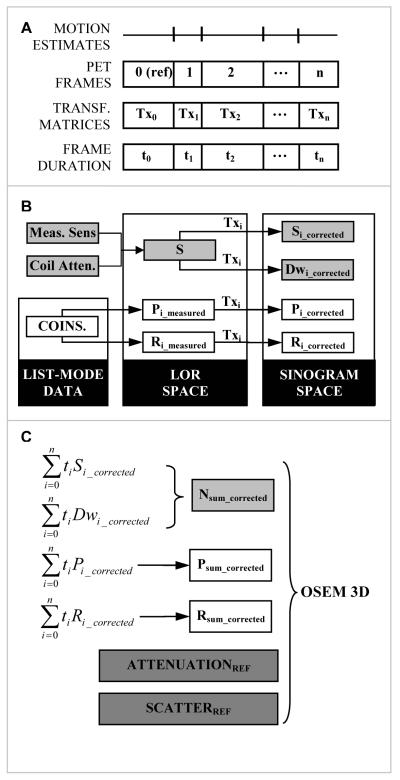
The MC algorithm for the BrainPET’s data processing and image reconstruction workflow was implemented as follows (Fig. 2).
FIGURE 2.
Motion compensation algorithm for the BrainPET data workflow: (A) PET data framing based on the motion estimates (derived from MR); (B) LOR-space processing of each individual frame based on the transformation matrices (Tx) and rebinning into the motion corrected sinograms: prompts (P) and smoothed delays (R) coincidences, dwell (Dw) and sensitivity (S); (C) Generation of the motion corrected data by summing the time weighted sinograms and image reconstruction using the standard OP-OSEM 3D algorithm.
The list-mode data set is divided into n frames of variable duration (ti, i=0,n) according to the desired protocol. The first frame is set as the reference frame and the rigid-body transformation matrices (Txi, i=1,n) for all the subsequent frames are obtained from the MR data. These list-mode data from each frame are histogrammed and prompts (Pi_measured, i=0,n) and randoms (Ri_measured, i=0,n) LOR files are generated. The motion is accounted for in the LOR space by “moving” the coordinates of all crystals based on the transformer (Txi, i=1,n). For each frame, prompts (Pi_corrected, i=0,n) and randoms (Ri_corrected, i=0,n) sinograms are generated from these data. The rebinning dwell (Di) that accounts for the variable number of LORs in each sinogram bin is also calculated in a similar way. Because the RF coil is stationary with respect to the scanner, its attenuation cannot simply be combined with the head attenuation as it is usually done without MC (14) but it is combined with the sensitivity. The sensitivity (Si) sinogram for each frame is then obtained by transforming the coil corrected sensitivity LOR data.
The normalization (Nsum) is obtained from the summed time weighted transformed sensitivity and dwell sinograms. The emission data from all the frames are added in the sinogram space to obtain the corrected prompt and random coincidences files. Head attenuation and scatter correction sinogram are estimated only for the reference frame. The motion corrected PET volume is reconstructed from these summed sinograms using the standard 3D OP-OSEM algorithm.
MR Motion Tracking
One method for tracking the motion using the MR is to repeatedly acquire anatomical data during the PET data acquisition and then co-register the individual MR volumes to obtain the motion estimates. The MR-based intra-modality co-registration is likely more accurate than the PET-based method. The disadvantage however, is that motion estimates with a temporal resolution in the minute range are obtained (depending on the MR sequence acquisition time) and they do not allow for inter-frame MC. Furthermore, this method cannot be used for sequences that do not provide anatomical information (e.g. MR angiography or spectroscopy).
Another method for tracking the motion is the one already implemented on the Siemens Trio scanner – PACE (prospective acquisition correction) (17). This requires that an EPI series be collected, and prospective real-time motion tracking be performed by registering each volume with the first in the series. Thus, motion estimates that could be retrospectively used for PET data MC are obtained every time a complete volume is acquired, typically every 2 or 3 s.
Motion tracking information during high-resolution anatomical imaging with MR can also be obtained using embedded cloverleaf navigators (CLN), as we have previously demonstrated (18). Briefly, a CLN (duration < 4 ms) is inserted every repetition time (TR) of a 3D-encoded FLASH sequence and it provides an estimate of the rigid-body transformer between the current position of the object relative to the initial map (acquired in 12 s). The object is assumed to be a single rigid body such as the part of the head above the lower jaw including the brain. The motion estimates are simultaneously fed back to the MR sequence to rotate the gradients in real-time and adjust the slice select RF pulse frequency to track the moving object during imaging. In-plane translations are corrected by adding linear phase terms to the k-space lines and the corrected MR image is reconstructed as usual immediately after acquisition on the scanner host. A log file containing all the transformers is produced.
All these methods are suitable for tracking the translations and rotations of the head that moves as a single rigid body and were used in this work.
MR and PET Data Correlation
In spite of the simultaneous acquisition, the PET and MRI data acquired with the BrainPET are not correlated by default and two issues had to be addressed: the spatial co-registration of the two volumes and the temporal correlation of the two signals.
Spatial Correlation
The spatial mis-registration between the PET and MRI volumes comes from the fact that due to physical limitations, the center of the FOV of the PET scanner does not coincide with the isocenter of the magnet, the axial FOVs are not identical (fixed in PET, variable in MR), and the MR slices can be prescribed in any orientation. These issues are particularly important for MC because the MR motion estimates are obtained relative to the magnet’s isocenter (or relative to the MR image space) and the corrections have to be applied relative to the PET FOV center. Acquiring isotropic 3D MR data in the transversal orientation solves all these limitations with the exception of the spatial mismatch issue. A solution to this problem is to obtain a transformation matrix (TMR→PET) by scanning a structured phantom visible in both PET and MR, each time the PET insert is repositioned inside the magnet. A Derenzo 20 cm diameter phantom with holes ranging from 2.5 to 6 mm was filled with 1.5 mCi of F718 water and PET and morphological MR data were acquired simultaneously. The two volumes were co-registered based on the mutual information and the three rotations and three translations were obtained. The experiment was repeated six times after repositioning the phantom inside the scanner.
It should also be noted that the MR and PET scanners’ device coordinate systems (DCSs) follow the same rules for defining the orientations of and the rotations along each of the three orthogonal axes and these same rules have been adopted in this work. Based on these conventions, TMR→PET accounts for the transformation from the MRI scanner’s DCS (DCSMRI) to the PET scanner’s DCS (DCSPET). However, the estimates provided by the CLN sequence follow the gradient coordinate system (GCSMRI) conventions. Fortunately, only simple sign changes are required to convert these estimates from the GCSMRI to the DCSMRI. In this work, PET and MR data are both presented using the radiological convention.
Temporal Correlation
In addition to spatial correlation, the MR and PET data acquisition have to be correlated in time. However, on this prototype scanner, no clock synchronization between the two systems was implemented by default and the PET and MR data are acquired independently under the control of different computers.
A method for synchronizing the data acquisitions was implemented and it consisted of inserting MR output triggers into the PET list-mode data through the PET input/output system (IOS) board every time a motion estimate is obtained (i.e. every TR). Time marks are normally inserted into the PET list-mode data every 0.2 s and they are used to “time stamp” these MR trigger events. Thirty-two different gates can be encoded and a mechanism that allows the manual switching between the inputs on which the gates are inserted (e.g. each time a new sequence starts a different trigger is inserted) was implemented.
To verify that all the trigger events are recorded (which is required for accurate data acquisition synchronization) the following experiments were performed. First, a pulse generator was used to create TTL signals at the input of the IOS board and PET list-mode data were acquired with a Ge-68 line source. The 48 bits list-mode data events were analyzed to identify the trigger events. The events were recorded for different pulse frequencies and acquisition times. As a next step, triggers were obtained directly from the MR scanner. Because the MR output signal was narrower (i.e. 10 μs) than the signal expected by the BrainPET IOS board, a signal stretcher was built. List-mode data were acquired with the line source and an MR-visible phantom in the field of view. The number of trigger events recorded was tested for various sequences, acquisition times and TRs.
Hoffman Phantom Studies
A Hoffman phantom filled with ~1.5 mCi of FDG was used to acquire MR and PET data simultaneously in five positions (i.e. for various rotations and translations). After each acquisition, the phantom was manually moved to a different location. A multi-echo magnetization prepared rapid gradient echo (ME-MPRAGE) sequence was used to acquire morphological data in each case without modifying the sequence geometry between acquisitions. Subsequently, the first frame was set as the reference position. The other four MR volumes were co-registered to the reference volume using mutual information and the transformation parameters (3 translations and 3 rotations) were derived in each case. These transformers were used to correct the PET data both in the LOR and in the image space. In the first case, the procedure outlined above was followed. The attenuation map in the reference position was created by assuming uniform linear attenuation coefficients throughout the phantom volume (i.e. 0.096 cm−1 corresponding to water at 511 keV). In the second case, the five PET volumes were first reconstructed individually using the standard procedure. The attenuation maps for these positions were obtained from the reference attenuation map by applying the inverse of the transformations derived from the MR. Subsequently, the reconstructed PET volumes were moved back to the reference position and summed up in image space. A PET volume uncorrected for motion was also reconstructed from all the data summed in the sinogram space.
Human Volunteer Studies
For testing the MC algorithm in a more realistic situation, three human volunteers were recruited to undergo combined MR-PET brain examinations. As per our approved IRB protocol, the subjects injected with ~5 mCi of FDG were scanned for ~90 minutes and the data were acquired in list-mode format. In each case, the subject was asked to maintain a fixed head position during the first 25 minutes after the FDG injection. The MR sequences run during this time included dual-echo ultra-short echo time (DUTE), diffusion, time-of-flight MR angiography (TOF-MRA), and high resolution MEMPRAGE. Next, the fMRI PACE sequence was run for approximately 15 minutes and the subjects were asked to move their heads four times. After acquiring another MEMPRAGE dataset with the subjects in a fixed position, the CLN sequence was run for another 15 minutes and the subjects were again asked to move their head four more times. PET data were acquired simultaneously with the MR data acquisition throughout the scan.
fMRI derived Motion Estimates
The PACE sequence provides motion estimates in the MR reference frame (TMR) every three seconds. To derive the estimates in the PET reference frame (TPET), the individual MR volumes obtained every TR were first transformed to account for the mismatch between the two scanners and then they were retrospectively co-registered. In this way, the motion estimates were obtained directly in the PET reference frame (i.e. TPET). Each individual frame was processed using these estimates and a corrected volume was reconstructed. Additionally, the data were reconstructed without MC.
CL0 derived Motion Estimates
A series of motion estimates with a sample rate of 50 Hz was obtained using the following acquisition protocol: 2×2×2 mm3 resolution, 112 axial slices, TR 20 ms, TE 9.6 ms, FA 25°, BW 260 Hz/px. The navigator map consists of a set of navigators acquired at various combinations of rotations of the GCSMRI. The effect on the navigator of rotating the GCSMRI is assumed to be equivalent to rotating the object by the same amount. However, the combined B1 receive profile for the multichannel array is not homogeneous, so this assumption is not entirely correct. Because the body coil cannot be used to transmit in the presence of the PET insert, a local birdcage was used for excitation in the MR-PET configuration. The problem of correcting for multiple receive elements for the navigator was circumvented by receiving the navigator signal using the birdcage while collecting the image information from the array.
RESULTS
MR and PET Data Correlation
Spatial Correlation
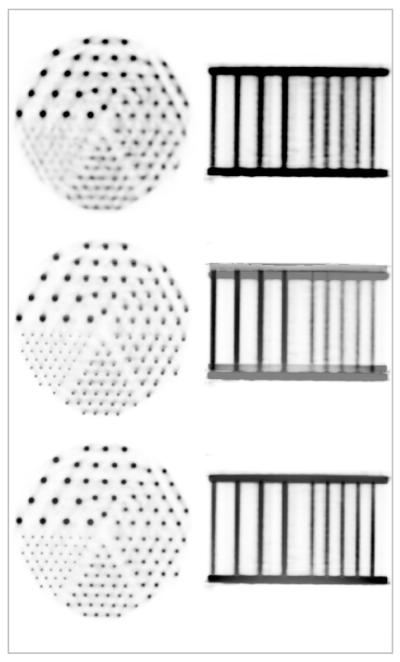
Representative PET images of the Derenzo phantom in the transaxial and coronal orientations are shown in the first row of Figure 3. Note that even the smallest structures (e.g. 2.5 mm) are resolved. A fusion of the PET and MR images acquired at the same level is shown in the second row, demonstrating the offset between the two volumes. The translations and rotations derived by co-registering the PET and MR data acquired after repositioning the phantom inside the scanner are provided in Table 2. The average transformations obtained from these measurements were used for the subsequent studies. After applying this transformation, perfectly co-registered PET and MR data, as demonstrated in the fused images shown in the bottom row of the Figure 3 were obtained.
FIGURE 3.
Simultaneously acquired MR-PET data using a Derenzo phantom: representative PET images (top), fused MR-PET before (middle) and after (bottom) accounting for the spatial mismatch between the two scanners. Images in the transaxial and coronal orientations are shown in each case. Note the perfect co-registration between the two volumes after performing the motion correction.
TABLE 2.
Spatial mismatch between the PET and MR scanners obtained by co-registration of the PET and MR volumes obtained using a structured phantom filled with FDG.
| Exp. # |
Rotations (degrees) | Translations (mm) | ||||
|---|---|---|---|---|---|---|
| x | y | z | x | y | z | |
| 1 | 0.04 | −0.07 | −0.68 | −2.05 | 1.45 | 8.16 |
| 2 | 0.01 | −0.08 | −0.67 | −2.11 | 1.41 | 8.19 |
| 3 | 0.05 | −0.05 | −0.60 | −2.13 | 1.50 | 8.24 |
| 4 | −0.01 | −0.11 | −0.67 | −2.15 | 1.43 | 8.06 |
| 5 | 0.02 | 0.00 | −0.60 | −2.18 | 1.45 | 8.22 |
| 6 | 0.05 | −0.07 | −0.67 | −2.08 | 1.43 | 8.13 |
| AVG | 0.03 | − 0.06 | − 0.65 | − 2.12 | 1.44 | 8.16 |
Temporal Correlation
The number of gates detected into the PET list-mode data recorded for different MR sequences (e.g. EPI CLN), using a wide range of TRs (e.g 20 ms to 5 seconds) and changing the number of measurements (e.g. 1 to 10) or the acquisition times perfectly matched the expected values.
Hoffman Phantom Studies
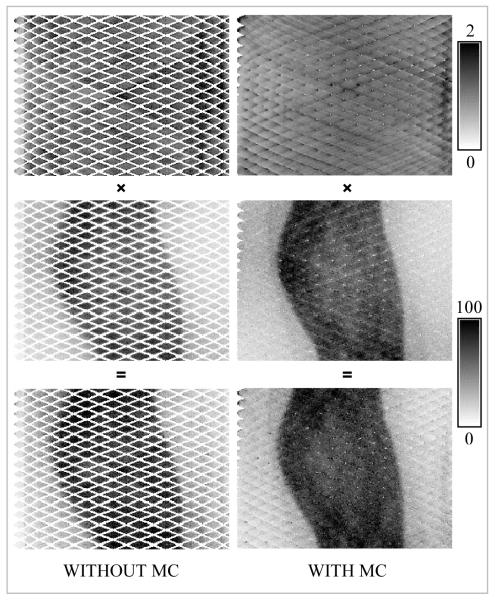
A representative prompts sinogram (plane #77 – the central direct plane) for the BrainPET scanner is shown in Figure 4 (middle left). These data were obtained by summing the individual prompts sinograms corresponding to the five positions in which the phantom was scanned. The normalization sinogram for the same plane is also shown in Figure 4 (top left). Note the missing data (i.e. diagonal sinogram bins with zero counts) due to the transaxial gaps between the detectors. They account for 44.1 % for plane #77 and 37.4 % for all the sinogram planes. The summed normalization and prompts sinogram after applying the MC are shown in Figure 4, top and middle right images. Note that most of the sinogram space has now been filled with data, only 1.7 % of the bins being empty (4.2 % when all 1399 planes were considered). In the last row the product of the prompts and normalization sinograms are shown for the same plane before and after applying the motion transformation.
FIGURE 4.
Representative sinograms for the BrainPET scanner before and after applying spatial transformations. The normalization and the corresponding prompt sinograms from the data acquired with the Hoffman phantom and their product are shown in the top, middle and bottom rows, respectively. Note the empty bins in the data uncorrected for motion. After applying the transformation most of these bins were filled with data in both the prompts as well as the normalization sinograms.
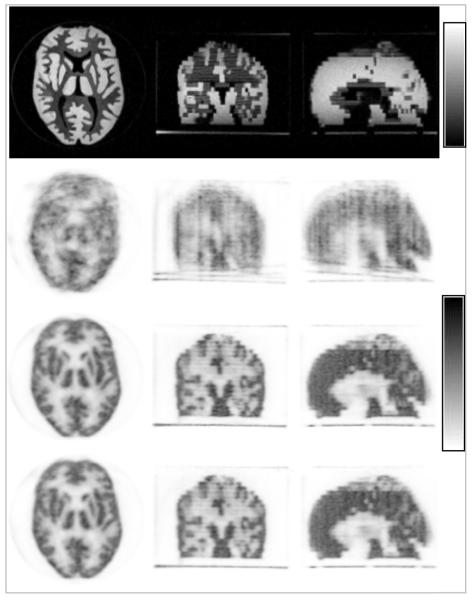
Representative MR images (in the transaxial, coronal and sagital orientations) of the Hoffman phantom acquired in the reference position are shown in Figure 5 (first row). The transformation parameters derived by co-registering the subsequent MEMPRAGE volumes are given in Table 3. The corresponding PET images reconstructed without MC are shown in Figure 5 (second row). The images obtained after applying the MC in LOR space are shown in Figure 5 (third row), demonstrating substantial improvement. Additionally, images from the volume obtained after applying the MC in the images space are shown in the Figure 5 (fourth rows). The two MC methods produced virtually identical results, demonstrating the quantitative accuracy of the proposed MC in LOR space.
FIGURE 5.
MR-based MC in a Hoffman phantom using MPRAGE-derived motion estimates: MR images in the reference position (top row), uncorrected PET images (second row), data corrected in the LOR space before image reconstruction (third row) and in the image space after reconstructing each individual frame (forth row). Note the substantial improvement in image quality after MC. Images in the transaxial, coronal and sagittal orientations are shown in each case.
TABLE 3.
Hoffman phantom motion estimates.
| Frame # |
Rotations (degrees) | Translations (mm) | ||||
|---|---|---|---|---|---|---|
| x | y | z | x | y | z | |
| 1 | 0 | 0 | 0 | 0 | 0 | 0 |
| 2 | −0.26 | 1.2 | 11.84 | −0.34 | 3.17 | −1.25 |
| 3 | 4.03 | 2 | 10.06 | 2.29 | 0.82 | 7.16 |
| 4 | 10.25 | −4.21 | 2.55 | 5.35 | −4.45 | 18.94 |
| 5 | 4.34 | −3.68 | 1.23 | 9.06 | 2.37 | 8.29 |
Human Volunteer Studies
fMRI derived Motion Estimates
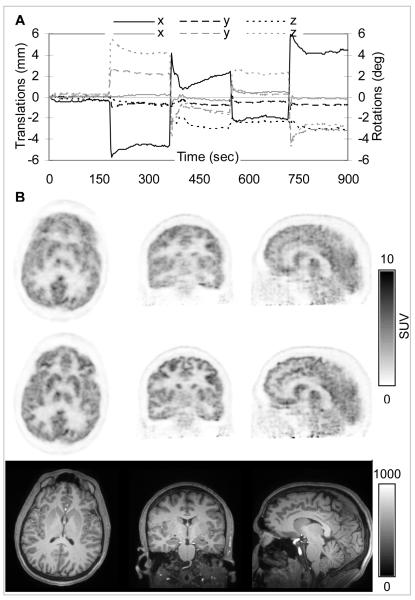
A plot of the translations and rotations obtained every three seconds from the fMRI data is shown in Figure 6A. The amplitude of the motion was less than ±6 mm and ±6 degrees. In addition to the four times when the subject moved deliberately, a slow drift can be observed in the third time interval. The changes observed immediately after the subject moved at some of the other time points (e.g. first and fourth) are probably due to the subject slowly drifting to a more comfortable position.
FIGURE 6.
MR-based MC in a healthy volunteer using fMRI-derived motion estimates: (A) Plot of the motion estimates in the PET reference frame: translations along (black) and rotations about (gray) the three orthogonal axes are shown. (B) PET data reconstructed before (first row) and after motion correction (second row). Note the substantial improvement in the PET image quality after MC. The corresponding MR images are provided as a reference (third row).
The reconstructed PET images before and after MC and the corresponding MR anatomical slices are shown in Figure 6B. An overall blurring of all the brain structures can be observed in the uncorrected data. A reduction in the uptake in gray matter structures can also be observed in these images. Furthermore, artifacts due to data inconsistencies (e.g. attenuation-emission data mismatch) are introduced in the images (see streak artifacts in the sagittal image without MC). After MC, the excellent delineation of specific brain structures can be appreciated (see for example basal ganglia, parietal and cingulate cortex in the transaxial, coronal and sagittal sections, respectively).
CLN-derived Motion Estimates
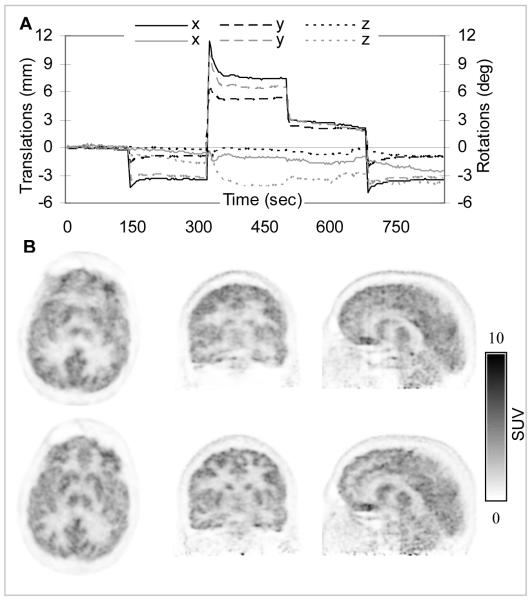
Although the CLN sequence provided motion estimates every 20 ms, 50 of these estimates were averaged and used for correcting the corresponding one-second PET frames. A plot of the translations and rotations that were actually applied to the PET data is shown in Figure 7A. Smoothing the estimates improved the reliability of the motion tracking information. Furthermore, processing 4500 20-ms frames would be extremely computationally intensive and is likely not necessary for accurate PET MC. Slightly larger amplitude movements (e.g. up to 12 mm translations) were recorded in this case. The transformation matrices in the MR reference frames (TMR) were derived from these average values. This matrix was then combined with the TMR→PET matrix to obtain the transformation in the PET reference frame (TPET).
FIGURE 7.
MR-based MC in a healthy volunteer using CLN-derived motion estimates: (A) Plot of the motion estimates in the PET reference frame: translations along (black) and rotations about (gray) the three orthogonal axes are shown. (B) PET data reconstructed before (first row) and after MC (second row). Note the substantial improvement in the PET image quality after MC.
Representative images reconstructed before and after MC are shown in Figure 7B. The substantial improvement in image quality is evident.
Since the subjects moved between the CLN and fMRI acquisitions, the high resolution MEMPRAGE data collected before each scan were used for deriving the transformation between the two reference positions so that the resulting images can be compared. Apparently, the CLN-based correction appears to be slightly less accurate than the fMRI-based one (see Figs. 6B and 7B). This could be due to the larger amplitude of the motion observed in the former case. It was previously observed that the accuracy of the CLN estimates decreases for translations larger than 10 mm or rotations larger than 10 degrees. These aspects will be further investigated in phantom studies.
DISCUSSION
Neurological PET studies take anywhere from minutes to hours and subject head motion is difficult to avoid. It degrades the image quality and it offsets the benefit of using a high-resolution scanner. A potential solution to this problem is offered by the simultaneous acquisition of the MR and PET data in an integrated MR-PET scanner.
To this end, a novel data processing and motion compensation algorithm for PET data at full LOR resolution in frame mode for the BrainPET scanner was proposed in this work. This algorithm was specifically implemented to address the challenges imposed by the axial and transaxial gaps present between the PET detectors blocks. Specifically, it allows the transformed LORs to fill the gaps so that no data are discarded. Combining the corrected data in LOR space before reconstruction has the advantage of reducing the noise in the final images. Furthermore, this method allows the proper handling of the regions that are not inside the PET FOV during the whole scan. Reconstructing the motion corrected data in LOR space leads only to a noise increase in these regions while the average signal is maintained as opposed to a correction applied after image reconstruction that leads to a decrease in the average signal in the same region. Finally, this method can be used for motion correcting data collected during static as well as dynamic PET scans provided that synchronized motion estimates are available.
There are a number of ways of tracking the motion using the MR data. Three different methods were used in this work.
First, an image-based approach was used for deriving the motion estimates by spatially co-registering the simultaneously acquired MR volumes. This approach is similar to the PET-based MC methods that relied only on the emission data for deriving the motion estimates. However, the co-registration of high resolution MPRAGE volumes is likely more accurate than that of noisy PET volumes uncorrected for photon attenuation. Although significantly improved image quality can be obtained, a main limitation of these methods is that they do not account for the intra-frame motion. Furthermore, using an MR scanner just for motion tracking seems a rather expensive method of performing PET MC. Ideally, the motion tracking should be performed in the background of the sequences used for acquiring standard MR data. In the phantom experiments described here, the new data processing and MC algorithm were tested for a wide range of translations and rotations, likely exceeding those normally observed in clinical studies. Very encouraging, based on the phantom data the quantitative properties of the MC images seem to be preserved, but more work is required for a complete characterization.
A second method that was tested in human volunteers consisted of using standard software installed on the Siemens Trio scanner (i.e. for EPI acquisition). In the end, this method is also an image-based method because the motion estimates are derived by co-registering the individual EPI volumes acquired every TR (e.g. every 3 s). This method is particularly attractive because it allows the simultaneous acquisition of fMRI and PET data which is of interest for a number of neurological research applications.
The third method using CLN is the most complex motion tracking method presented in this work. Similar to the fMRI-based method, it has the advantage of not interfering with the standard MR data acquisition. Furthermore, the high temporal resolution motion estimates thus obtained can be used to correct the PET data in very short frames. This could be particularly important for performing MC in the early phases of a dynamic PET study when frames as short as one second are often used to sample the radiotracer input function.
MR-based MC has the potential to improve PET as a quantitative method. First, the nominal spatial resolution of the current state-of-the-art scanners can be achieved. Second, the mismatch between the attenuation and emission volumes can be eliminated, assuming that the former was also derived from the simultaneously acquired MR data (14). Third, better estimates of the radiotracer arterial input function could be obtained using image based approaches from the motion corrected data. Together these methods could increase the reliability and reproducibility of the PET data and this could potentially benefit a number of neurological applications that require precise quantification (e.g. neuroreceptor studies) or that involve uncooperative subjects (e.g. Alzheimer’s disease, movement disorders or pediatric patients).
CONCLUSION
A novel data processing and rigid-body MC algorithm was proposed for the BrainPET scanner. The quantitative accuracy of the method was first demonstrated in phantom experiments using motion estimates derived from co-registered high-resolution MR volumes. Proof-of-principle MR-based PET MC was demonstrated in human volunteers using two different MR methods for tracking the motion. The MR-based MC methods allows us to take advantage of the high temporal resolution of the motion estimates provided by the MR and ultimately, to recover the nominal spatial resolution of the BrainPET scanner.
Acknowledgments
This work was partly supported by NIH grant 1R01CA137254-01A1.
Footnotes
Disclaimer: none.
References
- 1.Catana C, Procissi D, Wu Y, et al. Simultaneous in vivo positron emission tomography and magnetic resonance imaging. Proc Natl Acad Sci USA. 2008 Mar 11;105(10):3705–3710. doi: 10.1073/pnas.0711622105. [DOI] [PMC free article] [PubMed] [Google Scholar]
- 2.Judenhofer MS, Wehrl HF, Newport DF, et al. Simultaneous PET-MRI: a new approach for functional and morphological imaging. Nat Med. 2008 Apr;14(4):459–465. doi: 10.1038/nm1700. [DOI] [PubMed] [Google Scholar]
- 3.Lucas AJ, Hawkes RC, Ansorge RE, et al. Development of a combined microPET((R))-MR system. Technol Cancer Res Treat. 2006 Aug;5(4):337–341. doi: 10.1177/153303460600500405. [DOI] [PubMed] [Google Scholar]
- 4.Raylman RR, Majewski S, Velan SS, et al. Simultaneous acquisition of magnetic resonance spectroscopy (MRS) data and positron emission tomography (PET) images with a prototype MR-compatible, small animal PET imager. J Magn Reson. 2007 Jun;186(2):305–310. doi: 10.1016/j.jmr.2007.03.012. [DOI] [PMC free article] [PubMed] [Google Scholar]
- 5.Schlemmer H-PW, Pichler BJ, Schmand M, et al. Simultaneous MR/PET Imaging of the Human Brain: Feasibility Study. Radiology. 2008 Sep 1;248(3):1028–1035. doi: 10.1148/radiol.2483071927. [DOI] [PubMed] [Google Scholar]
- 6.Woody C, Schlyer D, Vaska P, et al. Preliminary studies of a simultaneous PET/MRI scanner based on the RatCAP small animal tomograph. Nucl Instrum Methods Phys Res Sect A Accel Spectrom Dect Assoc Equip. 2007 Feb;571(172):102–105. [Google Scholar]
- 7.Bergstrom M, Boethius J, Eriksson L, Greitz T, Ribbe T, Widen L. Head fixation device for reproducible position alignment in transmission CT and positron emission tomography. J Comput Assist Tomogr. 1981;5(1):136–141. doi: 10.1097/00004728-198102000-00027. [DOI] [PubMed] [Google Scholar]
- 8.Pilipuf MN, Goble JC, Kassell NF. A noninvasive thermoplastic head immobilization system - technical note. J Neurosurg. 1995 Jun;82(6):1082–1085. doi: 10.3171/jns.1995.82.6.1082. [DOI] [PubMed] [Google Scholar]
- 9.Bloomfield PM, Spinks TJ, Reed J, et al. The design and implementation of a motion correction scheme for neurological PET. Phys Med Biol. 2003 Apr;48(8):959–978. doi: 10.1088/0031-9155/48/8/301. [DOI] [PubMed] [Google Scholar]
- 10.Rahmim A, Bloomfield P, Houle S, et al. Motion compensation in histogram-mode and list-mode EM reconstructions: Beyond the event-driven approach. IEEE Trans Nucl Sci. 2004 Oct;51(5):2588–2596. [Google Scholar]
- 11.Carson RE, Barker WC, Liow J-S, Johnson CA. Design of a motion-compensation OSEM list-mode algorithm for resolution-recovery reconstruction for the HRRT. Nuclear Science Symposium Conference Record, IEEE. 2003;5:3281–3285. [Google Scholar]
- 12.Olesen OV, Jørgensen MR, Paulsen RR, Højgaard L, Roed B, Larsen R. Structured light 3D tracking system for measuring motions in PET brain imaging. SPIE. 2010;Vol. 7625 Proceedings. [Google Scholar]
- 13.Byars LG, Sibomana M, Burbar Z, et al. Variance reduction on randoms from delayed coincidence histograms for the HRRT. Proc IEEE Medical Imaging Conf. 2005 [Google Scholar]
- 14.Catana C, van der Kouwe AJW, Benner T, et al. Towards Implementing an MR-based PET Attenuation Correction Method for Neurological Studies on the MR-PET Brain Prototype. The Journal of 0uclear Medicine. 2010 doi: 10.2967/jnumed.109.069112. in press. [DOI] [PMC free article] [PubMed] [Google Scholar]
- 15.Watson CC. New, faster, image-based scatter correction for 3D PET. IEEE Trans Nucl Sci. 2000 Aug;47(4):1587–1594. [Google Scholar]
- 16.Hong IK, Chung ST, Kim HK, Kim YB, Son YD, Cho ZH. Ultra fast symmetry and SIMD-based projection-backprojection (SSP) algorithm for 3-D PET image reconstruction. IEEE Trans Med Imaging. 2007 Jun;26(6):789–803. doi: 10.1109/tmi.2007.892644. [DOI] [PubMed] [Google Scholar]
- 17.Thesen S, Heid O, Mueller E, Schad LR. Prospective acquisition correction for head motion with image-based tracking for real-time fMRI. Magn Reson Med. 2000 Sep;44(3):457–463. doi: 10.1002/1522-2594(200009)44:3<457::aid-mrm17>3.0.co;2-r. [DOI] [PubMed] [Google Scholar]
- 18.van der Kouwe AJ, Benner T, Dale AM. Real-time rigid body motion correction and shimming using cloverleaf navigators. Magn Reson Med. 2006 Nov;56(5):1019–1032. doi: 10.1002/mrm.21038. [DOI] [PubMed] [Google Scholar]


