

Abstract
A microfabricated device has been developed in which electrospray ionization is performed directly from the corner of a rectangular glass microchip. The device allows highly efficient electrokinetically driven separations to be coupled directly to a mass spectrometer (MS) without the use of external pressure sources or the insertion of capillary spray tips. An electrokinetic-based hydraulic pump is integrated on the chip that directs eluting materials to the monolithically integrated spray tip. A positively charged surface coating, PolyE-323, is used to prevent surface interactions with peptides and proteins and to reverse the electroosmotic flow in the separation channel. The device has been used to perform microchip CE-MS analysis of peptides and proteins with efficiencies over 200 000 theoretical plates (1 000 000 plates/m). The sensitivity and stability of the microfabricated ESI source were found to be comparable to that of commercial pulled fused-silica capillary nanospray sources.
Microfabricated devices have proven to be highly advantageous for rapidly processing materials, manipulating small sample volumes, and integrating complex and diverse sample pretreatment and separation strategies. These miniaturized chemical instruments enable automated manipulation of sample volumes that are orders of magnitude smaller than is feasible using standard robotic or manual operations.1 Relative to conventional liquid chromatography (LC) and capillary electrophoresis (CE), separations and reactions are also performed at much higher speeds. The extremely small sample volumes and narrow analyte bands, however, place stringent requirements on detection methods. Most of the work with microfabricated devices has utilized laser induced fluorescence (LIF) detection because of its high sensitivity and, in the case of transparent microchips, the ability to perform LIF directly through the substrate.2 LIF is, of course, limited to the detection of natively fluorescent compounds and those that can be fluorescently tagged. To obtain analyte mass and structural data, information that is extremely important in research areas such as proteomics, it is essential to couple microchips with mass spectrometry.3–5 Electrospray ionization mass spectrometry (ESI-MS) is the detection method of choice for many conventional liquid-phase separations and since the sensitivity improves as the volumetric flow rate decreases it is particularly attractive for microfluidic separations.6,7
Various methods for coupling ESI with microfabricated devices have been described over the past decade,8–25 and three recent review articles provide a thorough discussion of most of these methods.26–28 The fabrication of polymeric HPLC microchip separation devices with integrated electrospray emitters has been successful to the extent that a commercial device is now available.29,30 Integrating ESI sources on glass microchips, however, has proven to be more challenging. In the earliest reports, electrospray was generated at the terminus of a channel on the planar edge of a chip, but the fluid emanating from the opening had a tendency to spread over the glass surface and form large-diameter droplets.31–33 The droplet spreading is not significantly affected by making the surface hydrophobic and may be driven by an electrowetting process.34 The dead volume associated with these droplets resulted in excessive band broadening.31,32 Moreover, higher electrospray voltages are required with the blunt chip configuration.
To spatially confine the fluid and provide a sharp point from which to induce electrospray, conventional fused-silica nanospray tips, attached to the chips via holes etched or drilled in the substrate, have been used.8,10,14,16,17,23,31,35,36 These chips offered sensitive and stable ESI-MS performance characteristic of fused-silica capillary nanospray emitters, but were more difficult to construct, and the dead volume associated with the capillary–chip junction remained an issue. Liquid junctions have also been used to couple nanospray emitters to microchips.19,23,24 Efficient separations and highly sensitive MS detection have been reported using this approach, but there are still concerns regarding the dead volume within the capillary spray tip and the potential of sample loss in the liquid junction. Recently, Hoffman et al. described a method for fabricating a pulled spray tip directly on the edge of a glass microfluidic device.37 In this two-step method, a small cone was first milled around the channel opening on the edge of the microchip. This cone was then pulled while being heated with a platinum heating coil. The electrospray tips fabricated by this method look very similar to commercial pulled capillary emitters, but the data obtained with the device indicate that the sensitivity levels are not comparable.
Fluid has been delivered from microchips to the electrospray sources described above using simple capillary action from nanospray tips, external pressure or vacuum sources, or electrokinetic transport. External pressure and vacuum sources complicate the use of microfluidic devices and may limit the ability to precisely control fluid flow. The presence of significant pressure-driven flow within a separation channel will also decrease separation efficiency of electrokinetically driven separations. The concept of an integrated electroosmotic pump that allows fluid to be directed through a field-free region and out of the chip was demonstrated several years ago but was not used to integrate separations with ESI because of the large dead volume associated with droplet formation at the blunt edge electrospray source as mentioned above.31,32
In the work reported here, we have been able to eliminate droplet formation by redesigning the microchip. The distal end of the microfluidic separation channel is fabricated so that it is located at a corner of the rectangular microchip, thus providing a sharp two-dimensional feature for an electrospray tip. The electrospray tip is “sharpened” in the third dimension by reducing the microchip total thickness to 300 μm through the use of a thin substrate and cover plate. Thus, the corner of this thin glass chip forms the integrated electrospray tip. The microchip described in this report also incorporates the integrated electrokinetic pressure pump to transport electrophoretically separated components from the separation channel to the electrospray tip.31,32 This design eliminates the need for any fluid or pressure connections to the chip.
To obtain a stable positive electrospray it was necessary to use a relatively acidic, low ionic strength background electrolyte (BGE). Under acidic conditions, the electroosmotic flow (EOF) due to the silanol groups on a native glass surface is relatively weak and unstable.38 Furthermore, many peptides and proteins are positively charged under acidic conditions and have a strong tendency to interact with the negatively charged surface silanol groups. For these reasons, channel surfaces were coated with a polyamine, PolyE-323, that adheres to the glass through ionic interactions with the silanol groups.39 The resulting surface has a positive charge at neutral to acidic conditions, producing a stable anodic EOF while repelling positively charged analytes. Fused-silica capillaries coated with PolyE-323 have been previously used for highly efficient CE-MS separations of peptides and proteins.40 For our microchip separations, all channels with the exception of the side channel pumping component were coated, so that the resulting chip had reversed (anodic) EOF in the separation channel and normal (cathodic) EOF in the side channel. These conditions generated an efficient electroosmotic pump that allowed the fluid from the separation channel to be transported through a short field-free region to the electrospray orifice at the corner of the microchip.
An SU-8 microfluidic CE-MS device recently described by Sikanen et al. utilized a reversed EOF pumping strategy.40 This device took advantage of the change in the surface charge of native SU-8 at different pHs to introduce a sheath liquid flow at the terminal end of a separation channel. Electrophoretic separations were performed at high pH under cathodic EOF conditions, and an acidic sheath liquid was added using anodic EOF in auxiliary side channels. ESI was performed directly off of the SU-8 device. The maximum separation efficiency obtained using a 2-cm-long separation channel was ~120 000 plates/m.
The performance of the new CE-ESI microchip devices reported here was evaluated on the basis of ESI-MS sensitivity, stability, and separation efficiency. Laboratory-prepared mixtures of proteins and peptides were used to demonstrate the separative performance of the devices and the potential applicability to proteomics measurements. Electrospray performance equivalent to pulled capillary nanoelectrospray emitters was demonstrated while maintaining the full separative performance of microchip CE devices. The peptide and protein separations showed little or no band broadening due to surface adsorption.
EXPERIMENTAL SECTION
Microchip Designs
Two different chip designs were used for this work. Initial work was performed using a device, illustrated in Figure 1A, with a 4.7-cm-long separation channel. To obtain more efficient separations, a chip with a 20.5-cm-long serpentine separation channel was used (Figure 1B). Both designs include a side channel that is ~2 cm long connecting to the separation channel within 200 μm of the electrospray tip. The latter design incorporated asymmetrically tapered turns to minimize band broadening.41–43 In addition to improving the maximum efficiency of the separations, the longer channel also served to increase the temporal width of the peaks to offset the relatively slow acquisition rate of our mass spectrometer (~3 summed scans per second maximum). For both chip designs, the isotropically etched channels had a full width of approximately 75 μm and a depth of 10 μm.
Figure 1.

Schematic diagrams of the short-channel (A) and the long-channel (B) CE-ESI-MS chips. The length of the separation channel (measured from the injection cross to the outlet) was 4.7 cm for the short-channel chip and 20.5 cm for the long-channel chip. For both chips, the distance from the intersection of the separation channel and the side channel to the outlet was less than 200 μm and the channels were all 75 μm wide at full width and 10 μm deep. The turns in the serpentine pattern of the long-channel chip were asymmetrically tapered to reduce band broadening. The reservoirs are labeled S (sample), B (buffer), SW (sample waste), and SC (side channel). The direction of electroosmotic fluid flow is indicated by the arrows in (A).
Chip Fabrication
All chips were fabricated using 150-μm-thick Corning 0211 borosilicate glass substrates (Erie Scientific Co., Portsmouth, NH). These substrates were coated with chrome and photoresist by a commercial vendor (Telic Co., Valencia, CA). Channels were etched into the substrates using standard photo-lithographic and wet chemical etching techniques.43 Channel dimensions were measured with a KLA Tencor P15 surface profiler (KLA Tencor Corp., San Jose, CA). Cover plates were made of the same Corning 0211 substrates with access ports drilled using a Microblaster powder blaster (Comco, Inc., Bur-bank, CA). The cover plates and etched substrates were cleaned and then soaked in 6 N HCl for at least 4 h to hydrolyze the surfaces before being dry-bonded at 550ºC in a furnace for a minimum of 2 h. Common laboratory safety guidelines should always be followed, particularly when working with strong acids and bases.
The electrospray “tip” was prepared by cutting the chip with a dicing saw (Dicing Technology, San Jose, CA) such that the end of the separation channel bisected the cut corner. To minimize flow resistance and possible band broadening from longitudinal diffusion and Taylor dispersion in the field-free region, the chip was cut as close to the intersection between the separation channel and the side channel as possible. In all cases, the distance from the intersection to the corner was less than 200 μm. After dicing the chips, they were attached to a piece of 0.9-mm-thick support glass using UV epoxy. The support glass was slightly wider and longer than the chips to protect the chip from damage; however, one corner was removed to maintain free access to the spray corner. Finally, 6-mm-diameter glass cylinders were attached around each access port using a heat-cured optical epoxy (Epoxy Technology, Billerica, MA) to act as fluid reservoirs. Depending on the height of these fluid reservoirs, the volumetric capacity was between 50 and 100 μL.
Surface Modification
All flushing and rinsing of the microchips was accomplished by filling the reservoirs with the proper liquid and pulling a vacuum at the exit orifice using a micropipet tip attached to house vacuum. The void time for flushing water through the short-channel chips with this method was on the order of 1 s, while it was closer to 1 min for the long-channel chips. Coating of the channel walls was done with the polyamine, PolyE-323. The polymer was synthesized following the procedure described by Hardenbourg et al.39 The procedure used to coat the channels was similar to procedures that have been published by several authors.8,39,40 The channels were first flushed with 1 N sodium hydroxide for ~30 min to clean and hydrolyze the surface. The channels were then rinsed for 5 min with Nanopure water before being flushed for ~1 h with a 15% (by mass) solution of PolyE-323 adjusted to pH 7 with 1 M acetic acid. The channels were then flushed with 50 mM ammonium acetate to remove excess polymer. At this point, the chip was filled with the desired running buffer and used without further modification.
Electroosmotic Pump
The electroosmotic pump incorporated in the microchip design is similar to earlier reported designs.32,44 The microfluidic components of the pump consist of a tee intersection where the end of the separation channel, the side channel, and short transport channel leading to the electro-spray tip meet (Figure 1). As described above, all of the channels except the side channel were coated with a polyamine to reverse the surface charge on those channels. When all of the channels were filled with the CE background electrolyte (50% methanol, 0.2% acetic acid), the electroosmotic mobility (μeof) in the polyamine-coated separation channel was ~5 × 10⁻⁸ m2 V−1 s−1 (anodic EOF) based on the measured migration time of injected analyte bands. The electroosmotic mobility in the uncoated side channel was significantly lower in magnitude and in the opposite direction (cathodic EOF). The actual value of the EOF in the side channel was not determined; however, optical imaging of a neutral fluorescent marker (introduced via the side channel reservoir) revealed only a small amount of flow (significantly lower than the flow in the separation channel) under typical operating conditions. When the voltage at the side-channel reservoir was more positive than the voltage at the CE injection cross, the EOF in both the separation channel and the side channel flowed toward the intersection near the ESI corner. The short length of channel between the intersection and the ESI orifice was essentially field-free (due to the relatively large electrical resistance of the air between the microchip and the MS inlet), so there was no EOF in this channel segment. The electroosmotically driven flow entering the tee intersection from the separation and side channels generated a pressure that could easily drive flow through the field-free segment. It was estimated that a pressure of less than 1 mbar would be required to drive liquid through the 150-μm-long field-free channel at a flow rate of 40 nL/min. The separation and side channels had a hydraulic resistance more than 100 times greater than the electrospray channel; thus, the pressure-driven flow in these channels was negligible.
Chip Operation
The chips were operated by the application of electric potentials using platinum wire electrodes inserted into each of the four solvent reservoirs. These electrodes were operated by a laboratory-built power supply capable of independently switching up to five different voltages. The power supplies had a maximum output of ±10 kV, depending on the polarity of the power supply modules used (UltraVolt Inc., Ronkonkoma, NY). Safety procedures should always be followed when working with high-voltage power supplies to minimize the risk of electric shock. The power supply was connected to a personal computer via a SCB-68 breakout box connected to a PCI-6713, 8-channel analog card (all from National Instruments, Austin, TX). A program written in LABVIEW (version 7.1) was used to operate the power supply. Gated injections45 were performed using voltage profiles similar to those listed in Table 1. This injection strategy enabled introduction of small sample plugs into the separation channel, while maintaining a constant flow rate to the electrospray tip. Injections were reproducibly performed for periods as short as 0.1 s.
Table 1.
Typical Voltage Profiles Used To Perform Gated Injections for the CE-ESI-MS Microchipsa
| 4.7-cm-long chip
|
20.5-cm-long chip
|
|||
|---|---|---|---|---|
| run | inject | run | inject | |
| sample | 0 | 0 | −5000 | −5000 |
| buffer | 0 | 600 | −5000 | −4000 |
| sample waste | 1000 | 1000 | −3000 | −3500 |
| side channel | 4000 | 4000 | 4500 | 4500 |
The values listed are in units of volts. The actual values used were adjusted to optimize the performance of the injection and alter the field strength of the separation, but the relative values for the sample, buffer, and sample waste reservoirs were similar to the values listed.
ESI-MS
The chips were mounted on an x-y-z translational stage in front of the atmospheric pressure electrospray source of a Micromass QTof Micro mass spectrometer (Waters Corp., Milford, MA). The chips were positioned such that the spray corner was 5–10 mm from the mass spectrometer inlet orifice. The electrospray plume was illuminated with a 3-mW green diode laser and imaged using a CCD camera mounted above the mass spectrometer source. Data were acquired using Masslynx version 4.0. The LABVIEW program used to control the power supply was also set to trigger data acquisition to begin at the moment the gate was opened for an injection. For most cases, the mass spectrometer was set to acquire over a mass to charge (m/z) range of 300–1000 at a rate of 0.48 s per summed scan with an interscan delay of 0.1 s. The acquisition rate was increased to 0.24 s per summed scan to capture the shortest duration CE-MS peaks. The upper m/z limit was increased to 2000 for protein separations.
Reagents and Materials
HPLC grade methanol and glacial acetic acid were obtained from Fisher Chemical (Fairlawn, NJ). Purified deionized water was obtained from a Barnstead Nanopure Diamond water purifier fitted with a 0.2-μm filter (Barnstead International, Dubuque, IA). All solvents and reagents were filtered prior to use through 0.2-μm syringe filters obtained from Fisher. PolyE-323 was synthesized from 1,2-bis(3-aminopropy-lamino)ethane and epichlorohydrine obtained from Sigma Chemical Co. (St. Louis, MO) using a previously published procedure.39 The peptide analytes neurotensin, bradykinin, methionine-enkephalin, and thymopentin were obtained from Sigma; angiotensin II and leucine-enkephalin were obtained from Fluka Biochimica (Milwaukee, WI). The BSA digest was a massPrep standard obtained from Waters Corp. Horse skeletal myoglobin, horse heart cytochrome c, and bovine pancreas ribonuclease A, were all obtained from Sigma.
RESULTS AND DISCUSSION
Performance Characteristics of the CE-ESI-MS Microchip
We found the CE-ESI-MS chips to be rugged and easy to use. Figure 2 is a frame captured from a video of the laser-illuminated electrospray plume. Without the use of the laser, it was possible to see the Taylor cone exiting the chip, but not the electrospray. The chips were continuously operated for several hours without any visible change in the electrospray plume or the MS signal. Furthermore, because the channel is not tapered at the electro-spray orifice, the chips did not become clogged in the way that pulled capillary tips often do. The chips were easily flushed using vacuum as described above and were stored dry for extended periods of time between uses without any noticeable change in performance. It was also found that a chip could be used many times over the course of several weeks without recoating the separation channel with PolyE-323. If a chip became partially clogged, or if a change in performance was noticed, the chips were easily cleaned by flushing the channels (with acid, base, or detergent) and recoated to fully restore operation.
Figure 2.
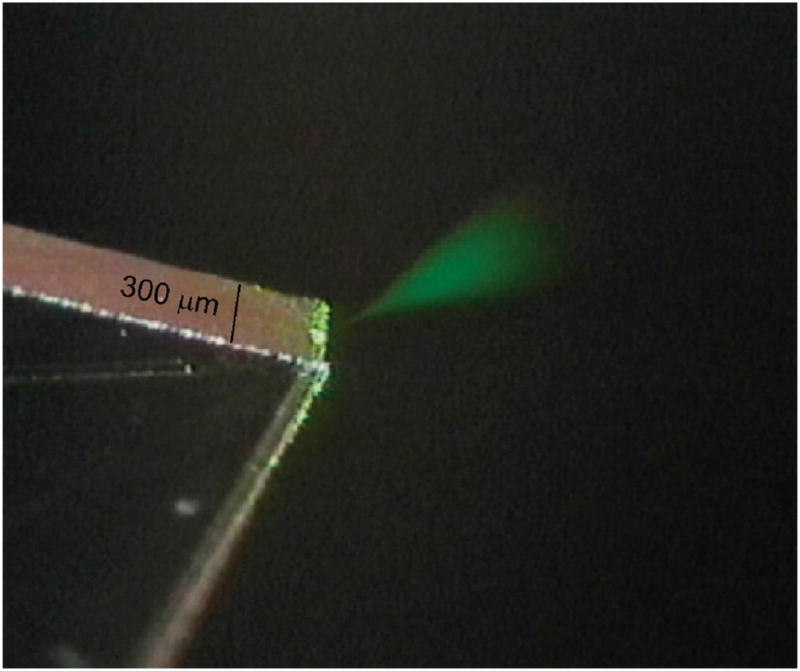
Image of the electrospray plume generated from the corner of a CE-ESI-MS chip acquired with a CCD camera. The plume was illuminated with a 3-mW, diode-pumped, solid-state laser. The liquid being sprayed was 50/50 (v/v) methanol/water with 0.2% acetic acid. The voltages applied to the microchip reservoirs raised the potential at the spray tip to 3.5 kV above that of the mass spectrometer inlet and caused the liquid to be pumped out of the chip at a flow rate of ~40 nL/min.
The sensitivity and stability of the integrated ESI microchips were compared to that of a fused-silica commercial capillary nanospray emitter with an inner diameter of 20 μm, tapered to 5 μm at the tip (PicoTip, New Objective, Woburn, MA). A mixture of 10 μM rhodamine B in 50/50 (v/v) methanol/water containing 0.2% acetic acid was infused through each source at the same flow rate (~40 nL/min). The pulled capillary tip was connected via a low dead volume stainless steel fitting to a 100-μm-i.d. fused-silica transfer capillary that in turn was attached to a syringe pump set to a flow rate of 40 nL/min. The electrospray voltage was applied at the stainless steel fitting, with optimal spray achieved between 1.5 and 2 kV. The microchip source with the 4.7-cm-long separation channel was operated by filling the sample, buffer, and sample waste reservoirs with the 10 μM rhodamine B mixture and applying 0 V at the sample and buffer reservoirs, 1 kV at the sample waste reservoir, and 4 kV at the side-channel reservoir. The side-channel reservoir contained the same mixture of 50% methanol, 0.2% acetic acid, but with no rhodamine B. The flow rate generated by this voltage drop was estimated to be ~40 nL/min (based upon the migration time of a band of rhodamine B and the measured channel dimensions). The exact flow rate exiting the chip was not measured, but was likely just slightly higher than 40 nL/min due to the small amount of flow out of the side channel. The voltage at the spray tip was calculated to be 3.7 kV, given the measured electrical resistance values of the channels.
After the spray sources were aligned and adjusted to obtain the optimum signal for the rhodamine B protonated molecular ion, 5 min of mass spectral data were acquired for each source (Figure 3). The sensitivity can be assessed from the mass spectra obtained by summing the first minute of each acquisition (Figure 3A and B). While the signal for the protonated molecular ion of rhodamine B was quite similar for the two different sources, the insets of figure 3 show that the baseline noise was about twice as high for the capillary emitter. The similarity in the signals also indicates that there was little if any dilution of the sample due to added flow from the sidearm in the microchip. The stability of the electrospray signals is illustrated in Figure 3C and D. The pulled capillary source had a slightly lower relative standard deviation for the total ion count (TIC) than the microchip device (2.4 versus 3.4%). For both sources, the relative standard deviation for the extracted rhodamine B molecular ion signal was slightly lower than that of the TIC (2.1% for the capillary, 3.1% for the microchip). Overall, these results indicate that the electrospray performance of the microchip was comparable to that of the commercial nanospray emitter.
Figure 3.

ESI-MS sensitivity and signal stability comparison between the microchip CE-MS device (A and C) and a pulled capillary nanospray emitter (B and D). The data were acquired while infusing 10 μM rhodamine B in 50/50 (v/v) methanol/water with 0.2% acetic acid through each source at ~40 nL/min. The ESI voltage was 1.8 kV for the capillary tip and 3.7 kV for the microchip. The MS acquisition rate was 0.48 s per summed scan with an interscan delay of 0.1 s over the m/z range of 300–1000. The spectra shown on the left were obtained by summing data acquired over a 1-min period. The insets show the background for a m/z region near the rhodamine B [M + H]+ (443 m/z) peak. The data on the right show the stability of the ESI-MS signals.
Investigation of Band Broadening Caused by the Electro-spray Interface
Band broadening due to the introduction of dead volume is a major concern when performing microchip separations. Significant losses in separative performance can result from small amounts of dead volume in microchip separation devices using nanoliter band volumes. The amount of band broadening introduced by the ESI interface was examined by comparing the temporal width of analyte bands in the separation channel before the side-channel intersection to that measured with the mass spectrometer. The analyte bands were measured before the side-channel intersection of the short-channel CE-ESI-MS microchip using LIF detection as described previously.45 The laser beam (514.5-nm line of an argon ion laser) was focused on a point ~100 μm upstream from the side-channel junction and ~250 μm from the outlet. Since our instrumentation did not allow LIF detection to be performed at the same time as ESI-MS detection, runs were performed sequentially using identical voltage profiles on the microchip. For this experiment, 0.2-s gated injections of a mixture of 20 μM fluorescein and 10 μM rhodamine B in 50/50 (v/v) methanol/water containing 0.2% acetic acid were performed. These concentrations were chosen to give similar MS signal intensity.
Figure 4 shows the electropherograms obtained with each detection method plotted on the same temporal axis. The relatively low intensity of the fluorescein LIF peak was caused by differences in the fluorescence characteristics between the two dyes under the experimental conditions used. The LIF data points were acquired at 100 Hz, and the MS data points were acquired at 2.9 Hz. There were only 2–3 mass spectral data points collected across each eluting peak because of the relatively slow acquisition rate of the mass spectrometer and the short duration CE peaks (less than 1 s full width at base). However, plotting the data on the same axis indicates that the MS peaks were very similar in duration to the LIF peaks, demonstrating that the ESI interface does not cause significant band broadening even for peaks having temporal widths less than 1 s.
Figure 4.

LIF and ESI-MS signals obtained for fluorescein (1) and rhodamine B (2) on the short-channel chip. Both runs used the same injection profile and microchip run voltages. The LIF laser spot (514.5-nm line of an argon ion laser) was focused at a point 100 μm upstream of the junction between the separation channel and the side channel. The sample was 20 μM fluorescein and 10 μM rhodamine B in 50/50 (v/v) methanol-water with 0.2% acetic acid. The LIF data points were acquired at a rate of 100 Hz, while the MS data points were acquired at a rate of 2.9 summed scans per second.
Peptide Separations
To test the separative performance of these CE-MS devices, analyses were initially conducted using the microchip with the short separation channel. Injections of standard peptide mixtures produced symmetrical peaks that were very narrow (~1–2 s full width at base) and fully resolved in less than 30 s (data available as Supporting Information, Figure S-1). Theoretical plate counts were estimated to be 10 000–20 000 for each peptide peak. Higher efficiency separations were obtained with the 20.5-cm-long serpentine separation channel microchip. Figure 5 shows the reconstructed selected ion electropherogram for the separation of six standard peptides and the neutral marker fluorescein. Approximately 2.5 pg of each peptide was injected during the 0.2-s gated injection. The selected ion electropherogram clearly reveals that the peptide peaks were symmetrical, suggesting insignificant interactions between the peptides and the channel walls. The longer duration peaks and slower analysis time characteristic of the longer separation channel allowed for better peak characterization by the mass spectrometer (although faster data acquisition would still be desirable). At the same time, the higher run voltage and larger ratio of column length to injection plug length gave a ~10-fold improvement in separation efficiency compared to the 4.7-cm-long CE-MS chip. The efficiency of the separation increased from ~20 000 theoretical plates for the 4.7-cm chip to over 200 000 theoretical plates for the 20.5-cm-long chip. The separation took ~7 times longer (3 min versus 25 s), but was still fast relative to conventional CE-MS analyses. Faster separations of equal or greater efficiency would be possible if a mass spectrometer with a faster data acquisition rate were used. At ~1 000 000 plates/m, this microchip CE-ESI-MS device operates at about twice the efficiency of the most efficient devices previously reported.17,24,37,44
Figure 5.

Reconstructed selected ion electropherogram for the separation of standard peptides on the long-channel CE-ESI-MS chip. Peaks: fluorescein (1), methionine-enkephalin (2), leucine-enkephalin (3), angiotensin II (4), neurotensin (5), bradykinin (6), and thymopentin (7). Approximately 2.5 pg of each peptide was injected during the 0.2-s gated injection. The separation field strength was 500 V/cm with a BGE of 50/50 (v/v) methanol/water + 1% acetic acid.
To better demonstrate the utility of the CE-MS chip for proteomics research, a tryptic digest of bovine serum albumin (BSA) was separated. Figure 6 shows the total ion electrophero-gram for this separation. The concentration of BSA in this sample was 5 μM, with ~3 fmol of digested protein injected. The efficiency of this separation was similar to that obtained for the standard peptide separation shown in Figure 5 (i.e., ~200 000 theoretical plates). The peak capacity for this separation, calculated as the retention window divided by the median peak width (4σ), was determined to be 43. At least 23 distinct CE peaks were detected. The 37 identified peptide fragments accounted for 58% coverage of the total sequence of BSA. The ions observed and their peptide sequence assignments are available as Supporting Information (Table S-1).
Figure 6.

Total ion electropherogram for the separation of the peptides from a 5 μM tryptic digest of bovine serum albumin performed on the long-channel CE-ESI-MS chip. Approximately 3 fmol of digested protein was injected during the 0.50-s gated injection. The separation field strength and BGE were the same as in Figure 5.
Protein Separations
A major advantage of using the PolyE-323 surface coating in the separation channel is the ability to separate proteins without significant interactions with the channel walls. To demonstrate this ability, a mixture of 3 standard proteins, horse skeletal myoglobin, horse heart cytochrome c, and bovine pancreas ribonuclease A, each at a concentration of 200 μg/mL, was separated and detected using the mass spectrometer. Figure 7 shows the total ion electropherogram for the separation of these proteins. In addition to the proteins, the dissociated heme group from the myoglobin was detected as a separate peak. The separation efficiency of each protein peak was greater than 280 000 theoretical plates. The peak shapes were Gaussian, indicating that the proteins were not interacting significantly with the channel walls. Such efficient separation of intact proteins opens up the possibility of using this type of microchip for top-down proteomics studies in addition to identification of proteolytic peptides from bottom-up proteomic strategies.
Figure 7.

Total ion electropherogram for the separation of three standard proteins on the long-channel CE-ESI-MS chip. The peaks are the heme group of myoglobin (1), ribonuclease A (2), myoglobin (3), and cytochrome c (4). Each protein in the sample was at a concentration of 200 μg/mL. The 0.5-s injection resulted in the injection of ~6 fmol of each protein.
CONCLUSIONS
The devices described in this report demonstrated highly sensitive and stable ESI-MS performance, as well as highly efficient separations of both peptides and proteins. Using the corner of a thin glass microchip as the electrospray source and generating flow out of the chip by the incorporation of an electroosmotic pump makes for a device that is simple to both fabricate and operate. The great potential of microfabricated devices lies in the ability to incorporate many functional elements into a single device. We are currently working on incorporating the technologies described in this report with several of the other separation and biological sample processing functional elements that have been investigated in our laboratory.
Supplementary Material
Acknowledgments
This research was sponsored by the National Heart Lung and Blood Institute proteomics initiative under Grant N01-HV-28182. The authors thank Dr. W. Hampton Henley for synthesis of the PolyE-323 and Waters Corp. for providing the Qtof micro mass spectrometer and supplying the BSA tryptic digest.
Footnotes
SUPPORTING INFORMATION AVAILABLE
Additional information as noted in text. This material is available free of charge via the Internet at http://pubs.acs.org.
References
- 1.Kutter JP, Fintschenko Y. Separation Methods in Microanalytical Systems. CRC Press Taylor and Francis Group; Boca Raton FL: 2006. [Google Scholar]
- 2.Johnson ME, Landers JP. Electrophoresis. 2004;25:3513–3527. doi: 10.1002/elps.200406086. [DOI] [PubMed] [Google Scholar]
- 3.Smyth WF, Brooks P. Electrophoresis. 2004;25:1413–1446. doi: 10.1002/elps.200305850. [DOI] [PubMed] [Google Scholar]
- 4.Postle AD. Lipid Technol. 2006;18:181–185. [Google Scholar]
- 5.Smith RD. BioTechniques. 2006;41:147–148. doi: 10.2144/000112217. [DOI] [PubMed] [Google Scholar]
- 6.Valaskovic GA, Kelleher NL, Little DP, Aaserud DJ, Mclafferty FW. Anal Chem. 1995;67:3802–3805. doi: 10.1021/ac00116a030. [DOI] [PubMed] [Google Scholar]
- 7.Wilm M, Mann M. Anal Chem. 1996;68:1–8. doi: 10.1021/ac9509519. [DOI] [PubMed] [Google Scholar]
- 8.Akashi S, Suzuki K, Arai A, Yamada N, Suzuki E, Hirayama K, Nakamura S, Nishimura Y. Rapid Commun Mass Spectrom. 2006;20:1932–1938. doi: 10.1002/rcm.2541. [DOI] [PubMed] [Google Scholar]
- 9.Bings NH, Wang C, Skinner CD, Colyer CL, Thibault P, Harrison DJ. Anal Chem. 1999;71:3292. doi: 10.1021/ac981419z. [DOI] [PubMed] [Google Scholar]
- 10.Deng Y, Henion J, Li J, Thibault P, Wang C, Harrison DJ. Anal Chem. 2001;73:639–646. doi: 10.1021/ac0009346. [DOI] [PubMed] [Google Scholar]
- 11.Figeys D, Aebersold R. Anal Chem. 1998;70:3721. doi: 10.1021/ac980502j. [DOI] [PubMed] [Google Scholar]
- 12.Figeys D, Gygi SP, McKinnon G, Aebersold R. Anal Chem. 1998;70:3728. doi: 10.1021/ac980320p. [DOI] [PubMed] [Google Scholar]
- 13.Figeys D, Lock C, Taylor L, Aebersold R. Rapid Commun Mass Spectrom. 1998;12:1435. doi: 10.1002/(SICI)1097-0231(19981030)12:20<1435::AID-RCM349>3.0.CO;2-9. [DOI] [PubMed] [Google Scholar]
- 14.Figeys D, Ning Y, Aebersold R. Anal Chem. 1997;69:3153–3160. doi: 10.1021/ac970057c. [DOI] [PubMed] [Google Scholar]
- 15.Henry C. Anal Chem. 1997;69:A359–A361. [Google Scholar]
- 16.Li J, Kelly JF, Chernushevich I, Harrison DJ, Thibault P. Anal Chem. 2000;72:599–609. doi: 10.1021/ac990986z. [DOI] [PubMed] [Google Scholar]
- 17.Li J, Thibault P, Bings NH, Skinner CD, Wang C, Colyer CL, Harrison DJ. Anal Chem. 1999;71:3036–3045. doi: 10.1021/ac981420y. [DOI] [PubMed] [Google Scholar]
- 18.Schultz GA, Corso TN, Prosser SJ, Zhang S. Anal Chem. 2000;72:4058–4063. doi: 10.1021/ac000325y. [DOI] [PubMed] [Google Scholar]
- 19.Tachibana Y, Otsuka K, Terabe S, Arai A, Suzuki K, Nakamura S. J Chromatogr, A. 2004;1025:287–296. doi: 10.1016/j.chroma.2003.10.103. [DOI] [PubMed] [Google Scholar]
- 20.Thorslund S, Lindberg P, Andren PE, Nikolajeff F, Bergquist J. Electrophoresis. 2005;26:4674–4683. doi: 10.1002/elps.200500338. [DOI] [PubMed] [Google Scholar]
- 21.Xiang F, Lin Y, Wen J, Matson DW, Smith RD. Anal Chem. 1999;71:1485. doi: 10.1021/ac981400w. [DOI] [PubMed] [Google Scholar]
- 22.Xu N, Lin Y, Hofstadler SA, Matson D, Call CJ, Smith RD. Anal Chem. 1998;70:3553. doi: 10.1021/ac980233x. [DOI] [PubMed] [Google Scholar]
- 23.Zhang B, Foret F, Karger BL. Anal Chem. 2001;73:2675–2681. doi: 10.1021/ac001432v. [DOI] [PubMed] [Google Scholar]
- 24.Zhang B, Liu H, Karger BL, Foret F. Anal Chem. 1999;71:3258–3268. doi: 10.1021/ac990090u. [DOI] [PubMed] [Google Scholar]
- 25.Kelly RT, Tang K, Irimia D, Toner M, Smith RD. Anal Chem. doi: 10.1021/ac8000786. In press. [DOI] [PMC free article] [PubMed] [Google Scholar]
- 26.Foret F, Kusy P. Electrophoresis. 2006;27:4877–4887. doi: 10.1002/elps.200600547. [DOI] [PubMed] [Google Scholar]
- 27.Koster S, Verpoorte E. Lab Chip. 2007;7:1394–1412. doi: 10.1039/b709706a. [DOI] [PubMed] [Google Scholar]
- 28.Lazar IM, Grym J, Foret F. Mass Spectrom Rev. 2006;25:573–594. doi: 10.1002/mas.20081. [DOI] [PubMed] [Google Scholar]
- 29.Yin HF, Killeen K. J Sep Sci. 2007;30:1427–1434. doi: 10.1002/jssc.200600454. [DOI] [PubMed] [Google Scholar]
- 30.Yin NF, Killeen K, Brennen R, Sobek D, Werlich M, van de Goor TV. Anal Chem. 2005;77:527–533. doi: 10.1021/ac049068d. [DOI] [PubMed] [Google Scholar]
- 31.Lazar IM, Ramsey RS, Jacobson SC, Foote RS, Ramsey JM. J Chromatogr, A. 2000;892:195–201. doi: 10.1016/s0021-9673(00)00335-6. [DOI] [PubMed] [Google Scholar]
- 32.Ramsey RS, Ramsey JM. Anal Chem. 1997;69:1174–1178. doi: 10.1021/ac971475k. [DOI] [PubMed] [Google Scholar]
- 33.Xue Q, Foret F, Dunayevskiy YM, Zavracky PM, McGruer NE, Karger BL. Anal Chem. 1997;69:426–430. doi: 10.1021/ac9607119. [DOI] [PubMed] [Google Scholar]
- 34.Mugele F, Baret JC. J Phys, Condens Mater. 2005;17:R705–R774. [Google Scholar]
- 35.Lazar IM, Ramsey RS, Ramsey JM. Anal Chem. 2001;73:1733–1739. doi: 10.1021/ac001420+. [DOI] [PubMed] [Google Scholar]
- 36.Lazar IM, Ramsey RS, Sundberg S, Ramsey JM. Anal Chem. 1999;71:3627–3631. doi: 10.1021/ac990373m. [DOI] [PubMed] [Google Scholar]
- 37.Hoffmann P, Hausig U, Schulze P, Belder D. Angew Chem, Int Ed. 2007;46:4913–4916. doi: 10.1002/anie.200605152. [DOI] [PubMed] [Google Scholar]
- 38.Lukacs KD, Jorgenson JW. J High Resolut Chromatogr Chromatogr Commun. 1985;8:407–411. [Google Scholar]
- 39.Hardenbourg E, Zuberovic A, Ullsten S, Soderberg L, Heldin E, Markides KE. J Chromatogr A. 2003;1003:217–221. doi: 10.1016/s0021-9673(03)00739-8. [DOI] [PubMed] [Google Scholar]
- 40.Ullsten S, Zuberovic A, Wetterhall M, Hardenbourg E, Markides KE, Bergquist J. Electrophoresis. 2004;25:2090–2099. doi: 10.1002/elps.200305787. [DOI] [PubMed] [Google Scholar]
- 41.Griffiths SK, Nilson RH. Anal Chem. 2001;73:272–278. doi: 10.1021/ac000936q. [DOI] [PubMed] [Google Scholar]
- 42.Molho JI, Herr AE, Mosier BP, Santiago JG, Kenny TW, Brennen RA, Gordon GB, Mohammadi B. Anal Chem. 2001;73:1350–1360. [Google Scholar]
- 43.Ramsey JD, Jacobson SC, Culbertson CT, Ramsey JM. Anal Chem. 2003;75:3758–3764. doi: 10.1021/ac0264574. [DOI] [PubMed] [Google Scholar]
- 44.Sikanen T, Tuomikoski S, Ketola RA, Kostiainen R, Franssila S, Kotiaho T. Anal Chem. 2007;79:9135–9144. doi: 10.1021/ac071531+. [DOI] [PubMed] [Google Scholar]
- 45.Jacobson SC, Koutny LB, Hergenroder R, Moore AW, Ramsey JM. Anal Chem. 1994;66:3472–3476. [Google Scholar]
Associated Data
This section collects any data citations, data availability statements, or supplementary materials included in this article.