

Abstract
BACKGROUND & AIMS
We developed and validated a model to estimate the risks for mutations in the mismatch repair (MMR) genes MLH1, MSH2, and MSH6 based on personal and family history of cancer.
METHODS
Data were analyzed from 4539 probands tested for mutations in MLH1, MSH2, and MSH6. A multivariable polytomous logistic regression model (PREMM1,2,6) was developed to predict the overall risk of MMR gene mutations and the risk of mutation in each of the 3 genes. The model’s discriminative ability was validated in 1827 population-based CRC cases.
RESULTS
Twelve percent of the original cohort carried pathogenic mutations (204 in MLH1, 250 in MSH2, and 71 in MSH6). The PREMM1,2,6 model incorporated the following factors from the probands and first- and second-degree relatives (odds ratio; 95% confidence intervals [CI]): male sex (1.9; 1.5–2.4), a CRC (4.3; 3.3–5.6), multiple CRCs (13.7; 8.5–22), endometrial cancer (6.1; 4.6–8.2), and extracolonic cancers (3.3; 2.4–4.6). The areas under the receiver operating characteristic curves were 0.86 (95% CI: 0.82–0.91) for MLH1 mutation carriers, 0.87 (95% CI: 0.83–0.92) for MSH2, and 0.81 (95% CI: 0.69– 0.93) for MSH6; in validation, they were 0.88 for the overall cohort (95% CI: 0.86–0.90) and the population-based cases (95% CI: 0.83–0.92).
CONCLUSIONS
We developed the PREMM1,2,6 model that incorporates information on cancer history from probands and their relatives to estimate an individual’s risk for mutations in the MMR genes MLH1, MSH2, and MSH6. This web-based decision making tool can be used to assess risk for hereditary CRC and guide clinical management.
Keywords: Lynch Syndrome, gene-specific risk estimates, prediction model, Colon Cancer Family Registry
Individuals with Lynch Syndrome inherit a deleterious mismatch repair (MMR) gene mutation and have a near 80% lifetime risk of developing colorectal cancer (CRC) and 40%–60% lifetime risk of developing endometrial cancer.1–5 Screening, surveillance and prophylactic surgeries reduce these risks, with colonoscopy in mutation carriers preventing over 60% of CRCs and cancer-related deaths.6,7 Prophylactic hysterectomy with bilateral salpingo-oophorectomy is an effective strategy for preventing endometrial and ovarian cancer in women with Lynch Syndrome, while further research is needed to determine the efficacy of screening methods for these cancers on morbidity and mortality in comparison with prophylactic surgery.8 Clinical genetic testing can identify the individuals most likely to benefit from risk-reducing interventions and spare unaffected persons and their relatives the associated risks and burdens.
The decision to pursue cancer susceptibility genetic testing is multifaceted and inappropriate for everyone as it is sometimes complicated by social, ethical, legal, or insurance issues. Testing can also lead to results of uncertain clinical significance and requires the involvement of healthcare professionals knowledgeable about the interpretation and limitations of genetic testing. For these reasons, pretest evaluations are recommended for anyone considering genetic testing for Lynch Syndrome.
One important component of pretest counseling is an assessment of risk that an individual carries a deleterious MMR mutation. Clinical criteria to identify patients at risk for Lynch Syndrome, such as the Amsterdam Criteria and Bethesda Guidelines have been widely accepted and used.9–12 However, these criteria are cumbersome and impractical to routinely use in clinical practice, particularly in assessing unaffected persons. Prediction models have been developed to estimate an individual’s pretest gene mutation probability based on clinical attributes associated with an inherited CRC predisposition. We previously developed a web-based clinical model, PREMM1,2 (Prediction of MLH1 and MSH2), which calculates the overall probability of an individual carrying a MLH1 or MSH2 gene mutation based on specific personal and family cancer history.13 The model was validated and compared with other models in a large population-based European cohort of CRC patients.14,15
Our aim was to develop and validate a new model that incorporates MSH6 gene mutation prediction and use genotype-phenotype data from a large cohort of MLH1, MSH2, and MSH6 mutation carriers to generate specific, individualized predictions for each gene based on personal and family history characteristics. We report results on the validation of the model’s discriminatory ability in an external, independent sample and assess the impact of population-based ascertainment of CRC cases on prediction of MMR mutation status.
METHODS
Patients
We analyzed a previously unreported study cohort of 4893 consecutive probands unknown to be related who submitted blood samples for full gene sequencing of MLH1, MSH2, and MSH6 to Myriad Genetic Laboratories, Inc., Salt Lake City, Utah after 2005. Testing was ordered by healthcare professionals for individuals with personal or family history suggestive of Lynch Syndrome. Data were obtained from the test order form completed by healthcare professionals ordering clinical genetic testing. Data included the patient’s age, sex, and details about personal and family history of cancer. 4539 probands were included for analysis after excluding 354 probands who did not report age of cancer diagnosis. When both paternal and maternal sides of the family were reported to have been affected, family history was reviewed to assess the lineage most likely affected (FK and SS).
For each proband, family history included: 1. first-degree relatives (FDR) or second-degree relatives (SDR) of the proband, 2. affected side of the family, 3. affected with Lynch Syndrome cancers of the stomach, ovaries, urinary tract, small intestine, pancreas, bile ducts, brain, sebaceous glands, or colonic adenomas, 4. ages of diagnosis. 8745 relatives met these criteria and were included in the analysis.
The study was investigator-initiated and data collection and modeling occurred independently, as previously reported.13,16 Clinical data collection and molecular analyses occurred at Myriad Genetic Laboratories, Inc. and an anonymized dataset of probands who had undergone genetic testing was provided to Dana-Farber/Harvard Cancer Center investigators for further analyses. Statistical analyses were conducted by clinical researchers (FK, JB, RM, SS) and an independent statistician (ES), none of whom are affiliated with Myriad Genetic Laboratories. The study was reviewed and approved by the Dana-Farber/Harvard Cancer Center Institutional Review Board. A waiver of consent for study participants was obtained because the analyses were performed on deidentified data and did not require patient contact.
Laboratory Methods
Mutation analysis was done using methods previously described and was uniform for all patients in the development cohort.13 Full gene sequencing of MLH1, MSH2, and MSH6 was performed on the eligible 4,539 unrelated probands that submitted blood samples to Myriad Genetics after 2005. Southern blot analysis was used to detect large genomic alterations in MLH1 and MSH2 genes. Individuals with deleterious or “suspected deleterious” mutations were defined as mutation-positive. Mutations leading to truncating or unstable proteins were considered deleterious and included frameshift, nonsense, splice site mutations, large deletions and rearrangements. “Suspected deleterious” mutations were genetic variants for which evidence indicated a likelihood the mutation was deleterious. Examples include splice site mutations that occur at conserved locations of splice acceptors and donors. Missense mutations and noncoding intervening sequence mutations were defined as deleterious based on data from linkage analysis of high-risk families, functional assays, biochemical evidence, and/or demonstration of abnormal mRNA transcript processing. Mutation-negative probands were individuals with missense mutations within intronic regions whose clinical significance is not yet established, those with polymorphisms and unclassified variants.
Statistical Methods
Variables considered for the analyses were as previously defined in the PREMM1,2 model (supplementary material, appendix A).13 Univariate analyses were used to compare personal and family cancer history, cancer types and ages at diagnosis by gene mutation for probands and relatives. To test for differences among carriers by type of gene, one-way Analysis of Variance (ANOVA) was used. A two-sided p-value of <0.05 was statistically significant. Polytomous logistic regression analysis was used to further assess the associations of clinical features with mutation status by gene, with comparisons reported as odds ratios (OR) with 95% confidence intervals (95% CI). Interaction terms were added to test for gender or age-specific effects. Age was truncated at the lower and upper one percentile for ages of CRC and endometrial cancer diagnoses.17 The modeling process was validated by bootstrap resampling where 200 random samples were drawn with replacement. Predictive models were developed in each bootstrap sample and evaluated in the entire cohort. For further validation, the model was fit on the earliest two-thirds of the cohort as the training part (N=3026), and validated on the remaining most recent independent one-third of the cohort (N=1513). The final prediction rule was based on logistic regression coefficients estimated from the full cohort (N=4539). Discrimination between probands with each gene mutation and those without mutations was quantified by the area under the receiver operating characteristic curve (AUC). Three areas under the ROC curve were generated for carriers of each gene mutation against noncarriers. The model providing gene-specific risk estimates is called PREMM1,2,6 (prediction of mismatch repair gene mutations in MLH1, MSH2, and MSH6). We graphically compared the reclassification accuracy of the PREMM1,2,6 model to the previous PREMM1,2 version (supplementary material, figure 1).18 A Pearson’s correlation coefficient (r) was calculated to measure overall concordance between the predicted probabilities of either model.
For external validation of the PREMM1,2,6’s discriminative performance, 1827 subjects recruited for the CCFR were analyzed. Study subjects enrolled through one of six registry centers: University of Hawaii, Fred Hutchinson Cancer Research Center, Mayo Clinic, University of Southern California Consortium, Cancer Care Ontario, and University of Melbourne. Families were ascertained through population-based cancer registries (population-based, n=1214) and high-risk clinics (clinic-based, n=613). Some centers recruited all CRC cases whereas others oversampled cases with a family history or early age of diagnosis. Molecular tumor testing, including microsatellite instability (MSI) and immunohistochemistry (IHC), was conducted on all population-based cases and MMR mutation analysis was conducted on those with CRC tumors displaying high and low levels of MSI or loss of normal expression on IHC; MMR testing was done on all clinic-based cases. Standardized procedures were used to collect the proband’s demographic data, personal and family cancer history, molecular tumor testing and mutation analysis results. Detailed information about the CCFR can be found at http://epi.grants.cancer.gov/CFR/ and is reviewed by Newcomb.19 Participants provided informed consent for inclusion in the CCFR through each registry center.
Statistical analysis used SAS statistical software (version 9.1; SAS Institute, Inc.) for data management and univariate analysis, SPSS (version 16, SPSS, Inc. Chicago, IL) and R software (version 2.8.0, R Foundation for Statistical Computing, Vienna, Austria) for multivariable analysis, validation, and comparison of PREMM1,2 and PREMM1,2,6 through reclassification analysis.
RESULTS
Univariate Analysis
Pathogenic mutations were found in 525 of 4539 of subjects (12%), with 204 MLH1, 250 MSH2, and 71 MSH6 gene mutations detected. The majority of individuals undergoing genetic testing were women (73%, Table 1). However, the frequency of mutations detected was highest among men: 190/1214 (16%) of men carried a gene mutation compared to 335/3325 (10%) of women. Six percent of mutation carriers (31/525) were unaffected by CRC or other Lynch Syndrome-associated cancers compared to 896/4014 (22%) of noncarriers.
Table 1.
Clinical History of Probands According to Mutation Status, by Gene
| Characteristics | Total | No Mutation | MLH1 | MSH2 | MSH6 | ||||||
|---|---|---|---|---|---|---|---|---|---|---|---|
| N | N | (%) | N | (%) | N | (%) | N | (%) | p- value* |
||
| Total | 4539 | (100) | 4014 | (88) | 204 | (4) | 250 | (6) | 71 | (2) | NA |
| Male | 1214 | (27) | 1024 | (26) | 88 | (43) | 86 | (34) | 16 | (23) | <0.001 |
| Personal History: | |||||||||||
| CRC | |||||||||||
| 0 | 2013 | (44) | 1859 | (46) | 45 | (22) | 78 | (31) | 31 | (44) | <0.001 |
| 1 | 2357 | (52) | 2045 | (51) | 135 | (66) | 142 | (57) | 35 | (49) | |
| ≥2 | 169 | (4) | 110 | (3) | 24 | (12) | 30 | (12) | 5 | (7) | |
| Adenoma | 701 | (15) | 642 | (16) | 21 | (10) | 31 | (12) | 7 | (10) | 0.04 |
| Endometrial Cancer | 615 | (14) | 473 | (16) | 36 | (31) | 74 | (45) | 32 | (58) | <0.001 |
| (among females) | |||||||||||
| Other LS cancers | 441 | (10) | 361 | (9.0) | 19 | (9) | 53 | (21) | 8 | (11) | <0.001 |
| Multiple LS cancers | 521 | (11) | 380 | (9) | 40 | (20) | 83 | (33) | 18 | (25) | <0.001 |
| No LS cancers | |||||||||||
| (unaffected) | 927 | (20) | 896 | (22) | 12 | (6) | 15 | (6) | 4 | (6) | <0.001 |
| FDR with history of: | |||||||||||
| CRC, # of relatives | |||||||||||
| 0 | 2599 | (57) | 2415 | (60) | 67 | (33) | 75 | (30) | 42 | (59) | <0.001 |
| 1 | 1490 | (33) | 1274 | (32) | 77 | (38) | 114 | (46) | 25 | (35) | |
| ≥2 | 450 | (10) | 325 | (8) | 60 | (29) | 61 | (24) | 4 | (6) | |
| Endometrial Cancer | |||||||||||
| 0 | 4082 | (90) | 3667 | (91) | 167 | (82) | 197 | (79) | 51 | (72) | <0.001 |
| 1 | 406 | (9) | 315 | (8) | 34 | (17) | 44 | (17) | 13 | (18) | |
| ≥2 | 51 | (1) | 32 | (1) | 3 | (2) | 9 | (4) | 7 | (10) | |
| Other LS cancers | |||||||||||
| 0 | 3878 | (85) | 3447 | (86) | 177 | (87) | 201 | (81) | 53 | (75) | 0.01 |
| 1 | 604 | (13) | 519 | (13) | 24 | (12) | 43 | (17) | 18 | (25) | |
| ≥2 | 57 | (1) | 48 | (1) | 3 | (1) | 6 | (2) | 0 | (0) | |
| SDR with history of: | |||||||||||
| CRC, # of relatives | |||||||||||
| 0 | 3105 | (68) | 2721 | (68) | 124 | (61) | 155 | (62) | 48 | (67) | 0.01 |
| 1 | 1045 | (23) | 922 | (23) | 50 | (25) | 57 | (23) | 16 | (23) | |
| ≥2 | 446 | (10) | 371 | (9) | 30 | (15) | 38 | (15) | 7 | (10) | |
| Endometrial Cancer | |||||||||||
| 0 | 4230 | (93) | 3748 | (93) | 191 | (93) | 228 | (91) | 63 | (89) | 0.31 |
| 1 | 273 | (6) | 235 | (6) | 12 | (6) | 18 | (7) | 8 | (11) | |
| ≥2 | 36 | (1) | 31 | (1) | 1 | (1) | 4 | (2) | 0 | (0) | |
CRC=colorectal cancer, LS= Lynch Syndrome, FDR=first-degree relative, SDR=second-degree relative;
ANOVA test for comparison of 4 groups
Personal or family history of CRC was more prevalent among carriers of MLH1 and MSH2 gene mutations, 159/204 (78%) and 172/250 (69%). The prevalence of CRC was similar between MSH6 mutation carriers and noncarriers (40/71 (56%) and 2155/4014 (54%), respectively). Endometrial cancer was most prevalent among MSH6 carriers (32/55, 58%) compared to MLH1 (36/116, 31%) and MSH2 (74/164, 45%) carriers. Eighty of 525 mutation carriers (15%) reported extracolonic, nonendometrial cancers associated with Lynch Syndrome. The prevalence of such neoplasms was higher among MSH2 carriers (53/250, 21%,) than MLH1 and MSH6 carriers (19/204 (9%), and 8/71, (11%), respectively).
MSH6 mutation carriers and their relatives were older at CRC and endometrial cancer diagnosis than MLH1 and MSH2 mutation carriers (Table 2). The age at diagnosis for extracolonic nonendometrial cancers was similar among probands.
Table 2.
Youngest Mean Age of Diagnosis for Probands and their Relatives, by Mutation Status
| Characteristics | No Mutation | MLH1 | MSH2 | MSH6 | |
|---|---|---|---|---|---|
| Mean SD | Mean SD | Mean SD | Mean SD | p-value* | |
| N | 4014 | 204 | 250 | 71 | |
| Proband | |||||
| CRC | 47.0 ±12.2 | 41.0 ±10.5 | 43.3 ±11.7 | 45.8 ±10.0 | <0.001 |
| Endometrial Cancer | 50.3 ±13.2 | 47.3 ±7.1 | 46.1 ±7.3 | 50.5 ±7.6 | 0.03 |
| Other LS Cancer | 50.8 ±13.9 | 47.4 ±12.6 | 48.9 ±11.7 | 46.8 ±10.6 | 0.5 |
| Relatives | |||||
| CRC | 57.3 ±14.2 | 45.0 ±9.2 | 46.9 ±11.8 | 58.8 ±12.4 | <0.001 |
| Endometrial Cancer | 50.5 ±14.7 | 48.9 ±10.4 | 47.1 ±9.3 | 54.6 ±9.4 | 0.09 |
| Other LS Cancer | 56.1 ±15.7 | 51.5 ±14.8 | 50.2 ±16.7 | 53.3 ±17.3 | 0.005 |
CRC=colorectal cancer, LS=Lynch Syndrome, SD=standard deviation
ANOVA test for comparison of 4 groups
Among the 1827 subjects recruited through the CCFR, 1214 were population-based cases (66%). Pathogenic mutations were detected in 280/1827 (15%) subjects undergoing genetic testing; 82 of the mutation carriers were among the 1214 (6.8%) population-based cases. Of the 280 carriers, 111 had MLH1 gene mutations, 140 had MSH2 gene mutations, and 29 had MSH6 gene mutations. Uptake of genetic testing was higher among women compared to men (956 versus 871) with a near equal frequency of mutations detected (133 female carriers versus 147 male carriers). Similar to the development cohort, seven percent of mutation carriers (20/280) were unaffected by CRC or other Lynch Syndrome-associated cancers. A summary table on the mutation status of subjects in this cohort stratified by type of ascertainment (clinic versus population-based) is provided in the supplemental data section, Table 1.
Multivariable analysis
In the multivariable analysis (Table 3), men were two times more likely to have a gene mutation than women. Gender was therefore included as a predictor of mutation status in the model. The presence of adenomas had no association with mutation status in the multivariable analysis (OR 1.1, p=0.39 for any mutation; results not shown) and was excluded from the model. Strong predictors of MLH1 and MSH2 gene mutations included a history of CRC in probands (OR 5.1 and 4.5 for MLH1 and MSH2 respectively) and their relatives (OR 3.3 for MLH1 and MSH2). Personal and family histories of CRC and age of CRC were not as robust predictors of MSH6 gene mutations (OR 2.1, 1.2, and 1.1 respectively). However, personal history of two or more CRC diagnoses was a strong predictor of mutation carrier status for all three genes: OR 17, 14, and 5.4 for MLH1, MSH2, and MSH6 mutations, respectively. Probands with endometrial cancer had an OR of 7.2 for having a MSH2 and MSH6 gene mutation compared to 4.0 for an MLH1 gene mutation, and having other cancers associated with Lynch Syndrome was highly predictive of MSH2 gene mutations (OR 4.9). However, a proband’s age at time of endometrial cancer diagnosis was not predictive of any MMR gene mutations. A family history of endometrial cancer was similarly predictive of each gene mutation: OR 3.1 for MSH6, 2.8 for MSH2 and 2.6 for MLH1. Having relatives with extracolonic, nonendometrial cancers was weakly predictive of a gene mutation.
Table 3.
Multivariable analysis for presence of any gene mutation (logistic regression) and by affected gene (polytomous logistic regression)
| Predictors | Any mutation (n=525) OR [95% CI] |
MLH1 (n=204) OR [95% CI] |
MSH2 (n=250) OR [95% CI] |
MSH6 (n=71) OR [95% CI] |
|---|---|---|---|---|
| Personal History | ||||
| Unaffected | 1.0 | 1.0 | 1.0 | 1.0 |
| Male | 1.9 [1.5–2.4] | 2.0 [1.4–2.8] | 1.9 [1.4–2.7] | 1.7 [0.9–3.2] |
| 1 CRC | 4.3 [3.3–5.6] | 5.1 [3.4–7.7] | 4.5 [3.2–6.5] | 2.1 [1.2–3.7] |
| > 2 CRC | 13.7 [8.5–22] | 17.0 [8.9–31.0] | 14.0 [8.1–26.0] | 5.4 [1.9–15.0] |
| Endometrial Cancer | 6.1 [4.6–8.2] | 4.0 [2.5–6.4] | 7.2 [4.9–11.0] | 7.2 [4.0–13.0] |
| Other LS Cancer | 3.3 [2.4–4.6] | 2.3 [1.4–4.0] | 4.9 [3.3–7.3] | 1.5 [0.7–3.2] |
| Family History | ||||
| CRC | ||||
| No family history of CRC | 1.0 | 1.0 | 1.0 | 1.0 |
| Presence of CRC in FDRs/SDRs* | 2.9 [2.6–3.4] | 3.3 [2.8–4.0] | 3.3 [2.7–3.9] | 1.2 [0.9–1.8] |
| Endometrial cancer | ||||
| No family history of endometrial cancer | 1.0 | 1.0 | 1.0 | 1.0 |
| Presence of endometrial cancer in FDRs/SDRs* | 2.9 [2.3–3.7] | 2.6 [1.8–3.6] | 2.8 [2.1–3.8] | 3.1 [2.1–4.7] |
| Other LS cancers | ||||
| No family history of other LS cancers | 1.0 | 1.0 | 1.0 | 1.0 |
| Presence of other LS cancers | 1.4 [1.1–1.8] | 1.1 [0.7–1.7] | 1.4 [1.0–2.0] | 1.7 [1.0–2.9] |
| Age at diagnosis | ||||
| CRC [decade younger] | 1.7 [1.6 – 1.8] | 1.8 [1.6–2.0] | 1.6 [1.5–1.8] | 1.1 [1.0–1.3] |
| Endometrial cancer [decade younger] | 1.1 [0.9 – 1.2] | 1.0 [0.8–1.3] | 1.2 [1.0–1.5] | 0.9 [0.9–1.1] |
CRC=colorectal cancer, LS=Lynch Syndrome, FDRs=first-degree relatives, SDRs=second-degree relatives, ROC=receiver operator characteristic
Family history was coded as 1*(#FDRs) + 0.5*(#SDRs). For CRC and endometrial cancer, #FDR coded as 0,1,2 for 0, 1, or at least 2 affected FDRs respectively, and #SDR coded as 0,1,2 for 0, 1, or at least 2 affected SDRs respectively. Family history could have values of 0 (for no affected relatives) to 3 (for 2 or more affected FDRs and SDRs). For other LS cancers, #FDR coded as 0, 1 for 0, or at least 1 affected FDR, and #SDR coded as 0,1 for 0, at least 1 affected SDR. Family history could have values of 0 (for no affected relatives) to 1.5 (for 1 or more affected FDRs and SDRs).
The prediction model had good discriminatory capacity for detecting any gene mutation, with an AUC of 0.837 (95% CI: 0.827–0.857). The model had a slightly lower AUC of 0.834 at internal validation with bootstrap correction and a slightly higher AUC of 0.858 at independent validation. The multivariable model discriminated well for each specific gene, with an AUC of 0.86 (95% CI, 0.82–0.91) for MLH1, 0.87 (95% CI, 0.83–0.92) for MSH2, and 0.81 (95% CI, 0.69–0.93) for MSH6, all at independent validation (Table 4).
Table 4.
Discriminative Performance of PREMM1,2,6 in Development and Validation Cohorts
| Discrimination | Any mutation | MLH1 | MSH2 | MSH6 |
|---|---|---|---|---|
| Development cohort | ||||
| Apparent* | 0.84 [0.83–0.86] | 0.87 [0.84–0.90] | 0.86 [0.84–0.89] | 0.77 [0.71–0.83] |
| Bootstrap corrected§ | 0.83 [0.81–0.85] | 0.86 [0.84–0.89] | 0.85 [0.82–0.88] | 0.75 [0.69–0.81] |
| Validated in most recent 1/3¶ | 0.86 [0.83–0.89] | 0.86 [0.82–0.91] | 0.87 [0.83–0.92] | 0.81 [0.69–0.93] |
| External Validation Cohort** | ||||
| Total | 0.88 [0.86–0.90] | 0.91 [0.88–0.94] | 0.90 [0.88–0.93] | 0.77 [0.68–0.86] |
| Clinic-based | 0.81 [0.77–0.84] | 0.84 [0.80–0.89] | 0.82 [0.77–0.86] | 0.78 [0.68–0.88] |
| Population-based | 0.88 [0.83–0.92] | 0.90 [0.83–0.96] | 0.92 [0.86–0.97] | 0.69 [0.53–0.84] |
Performance evaluated on the data provided by Myriad Genetics Laboratories, Inc. to derive the final model (N=4539)
Estimated by internal validation (200 bootstraps)
Estimated by applying the model from the first 2/3 as training part (N=3026) to the remaining most recent independent 1/3 validation part (N=1513)
Performance evaluated on the data provided by the Colon Cancer Family Registry (CCFR)
The PREMM1,2,6 model performed equally well in the CCFR dataset used for external validation with an overall AUC of 0.88 (95% CI, 0.86–0.90) with the same discriminative ability to predict each individual gene mutation as the development cohort (Table 4, Figure 1). When assessing the impact of population-based ascertainment on prediction of MMR gene mutation carriage, the PREMM1,2,6 model’s performance was equally robust in population-based CRC cases as in the development cohort, maintaining an AUC of 0.88 (95%CI 0.83–0.92). Sensitivity and specificity of the model depended on cutoff values used for the predicted risk of mutation. For a cutoff of 5%, many patients would be considered for testing, with a sensitivity of 90% but specificity of 54%. An improvement of sensitivity and specificity was noted in the model’s performance in the external validation cohort at 94% and 56% respectively. Specificity was higher at 67% among cases that were population-based with preserved sensitivity at 90%. At a high cutoff such as 40%, specificity improved to 97% but 65% of mutation carriers would be missed (sensitivity of 35%). Additional comparisons on the performance of PREMM1,2,6 based on variable cutoff values for predicted risk based on development and validation cohort are shown in Table 2 (supplementary data).
Figure 1. Sensitivity and Specificity Receiver Characteristic Curves for Development and Validation Cohorts.
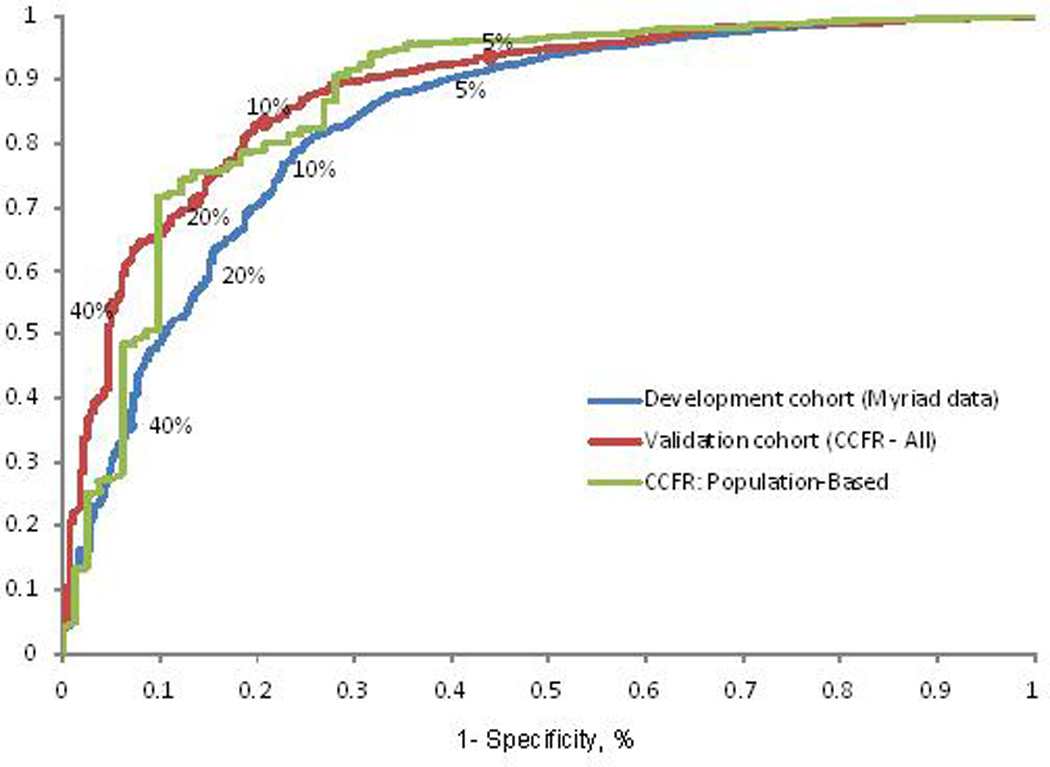
Receiver operating characteristic curves illustrating sensitivity and specificity of the PREMM1,2,6 model at different cutoffs for predicted probabilities
Predictions from the updated model were strongly correlated with those from the original PREMM1,2 model (r 0.94, supplementary material, figure 1). A comparison of overall MMR gene mutation carrier probability estimates along with gene-specific estimates derived by PREMM1,2,6 is illustrated for various pedigrees (Figures 2a–c). The equations pertaining to the PREMM1,2,6 model’s prediction of any MMR gene mutation and each individual gene mutation are presented in Figure 2 (supplementary data). The PREMM1,2,6 model is available for use by healthcare providers at www.dfci.org/premm.
Figure 2. Gene-Specific Estimates Provided by the PREMM1,2,6 Model.
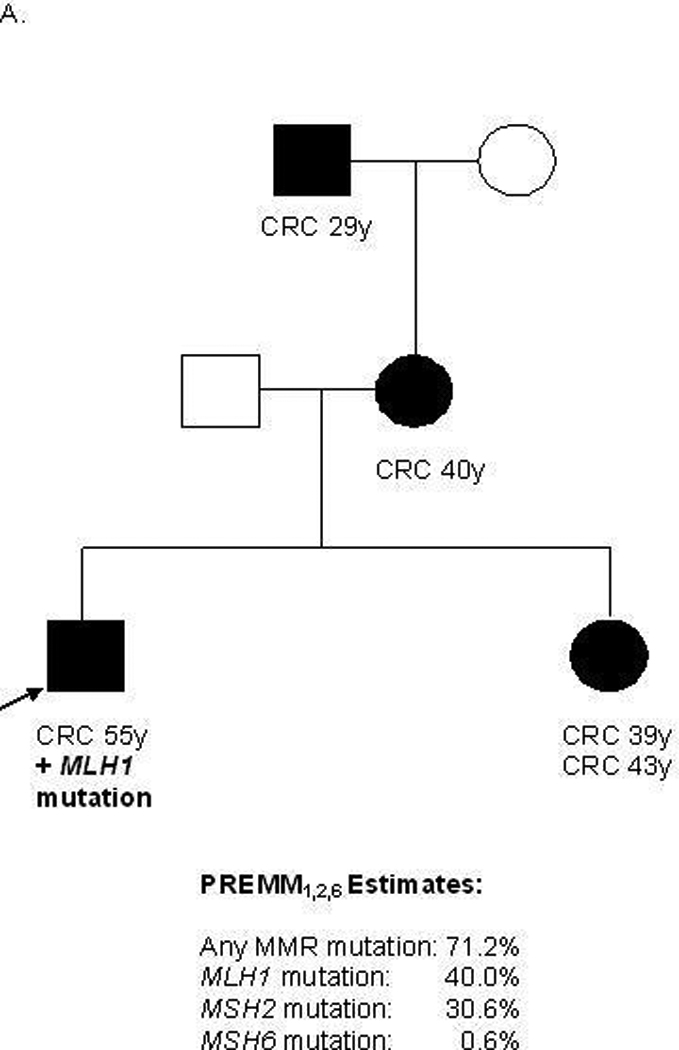

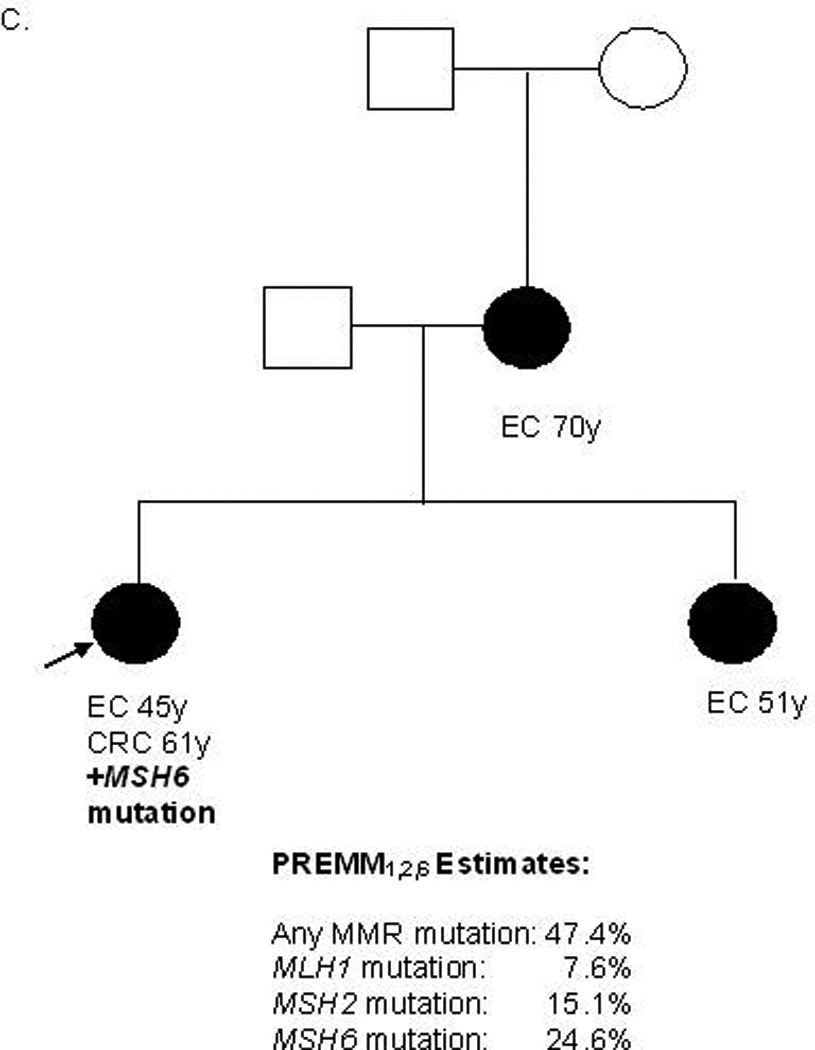
CRC=colorectal cancer, EC=endometrial cancer, y=years, MMR=mismatch repair, black box=affected male, black circle=affected female, white box=unaffected male, white circle=unaffected female, arrow=proband
DISCUSSION
We have developed and validated a clinical model to predict mismatch repair gene mutations in the MLH1, MSH2, and MSH6 genes: the PREMM1,2,6 model. This model can estimate the probability of carrying an MMR gene mutation, as well as provide such risk estimates for each particular MMR gene based on an individual patient’s personal and family cancer history phenotype and performs equally well among patients with CRC recruited through population-based cancer registries.
The PREMM1,2,6 model is derived from genotype and phenotypic data from the largest series of unrelated mutation carriers to date and makes it possible to determine the relative importance of predictors for each specific gene. The model discriminated well for each gene, with areas under the ROC curve over 0.8. The discriminatory capacity for predicting a mutation in the MSH6 gene was lowest, which may be explained by the later onset of CRC among probands and their relatives, similar to other studies of MSH6 mutation carriers5,20,21 The model performed equally well among population-based CRC cases ascertained through the CCFR, providing sound external validation of its discriminative ability to predict MMR gene mutation carriers and the individual likelihood of finding a mutation in each of the three genes.
We found some differences in this larger cohort of patients used to develop PREMM1,2,6 compared to that analyzed for the previously developed PREMM1,2 model. First, we observed sex-specific differences in the frequency of mutations detected: 190/1214 (16%) for men and 335/3325 (10%) for women (OR:1.6; 95% CI: 1.3–1.9). Men were two times more likely to have a MMR gene mutation than women. Based on an autosomal dominant mode of inheritance, one would not expect a deviation of mutation carriage based on gender. We suspect this may be due in part to selection bias where men presenting for genetic testing may have had a higher pretest probability of having Lynch Syndrome than women. Another plausible explanation may be related to sex-linked modifier genes and/or underlying environmental factors which may contribute to the gender-related differences also seen for CRC in the general population. Similar gender-specific penetrance effects in Lynch Syndrome have been described and deserve further study.22–24 A second variation of the current model from PREMM1,2 is that the presence of colonic adenomas in the proband was no longer a relevant predictor of mutation status. We suspect this effect is related to the reporting of polyps, which may not be as consistent as that for known cancer diagnoses.
A number of prediction models have recently been developed to identify individuals at risk for Lynch Syndrome, in addition to PREMM.22,25 These models have differed in the methodology used to predict carrier status as well as the patient populations from which they were derived and validated. Two other algorithms that have been developed are MMRpro25 and MMRpredict22: a comparison of these models to the PREMM models is provided in Table 5. A limitation of MMRpro is that it does not include information on Lynch Syndrome related cancers other than CRC or endometrial cancer. In the current study, such cancers were highly predictive of MSH2 gene mutations. Genotype-phenotype differences have been previously described based on the altered gene type, which support the recommendation for collecting all types of Lynch Syndrome-associated tumors when assessing a family history and incorporating these neoplasms into current clinical prediction models. This is particularly important in designing a gene-specific prediction model. While MMRpro can provide gene-specific risk estimates, the accuracy with which this can be done has not been reported. The MMRpredict model can only be used in patients affected with CRC and does not offer gene-specific estimates but does, along with MMRpro, include tumor analysis data. Nevertheless, recent studies validating the performance of these prediction models have shown them to all outperform the existing clinical criteria (Amsterdam II and revised Bethesda criteria) in predicting MMR gene mutation carriers.26–28 Further studies and continued use of these prediction models may ultimately lead to them replacing the Amsterdam and revised Bethesda guidelines as prescreening tools for Lynch Syndrome.
Table 5.
Comparison of Prediction Models for Identifying Mismatch Repair Gene Mutation Carriers
| Characteristic | Barnetson, et al.21 (MMRpredict) |
Chen, et al.24 (MMRpro) |
Balmaña, et al.13 (PREMM1,2) |
Kastrinos, et al. (PREMM1,2,6) |
|---|---|---|---|---|
| Ascertainment | ||||
| Derivation | Population-based restricted to age <50 years at CRC diagnosis | Population- and Clinic-based | Clinic-based | Clinic-based |
| Validation | Population-based | Clinic-based | Clinic-based | Population- and Clinic-based |
| Genotype detection | ||||
| MLH1 | 19 exons | Variable, not specified | 19 exons | 19 exons |
| MSH2 | 16 exons | 16 exons | 16 exons | |
| MSH6 | 10 exons | Not performed | 10 exons | |
| Deletion testing* | Yes | Yes** | Yes | |
| Total germline-tested individuals: | ||||
| Derivation cohort | 870 | N/A | 898 | 4538 |
| Validation cohort | 155 | 144 | 1016 | 1827 |
| Total families tested | Not specified | 226 | 1914 | 4538 |
| Related individuals tested | Yes | Yes | No | No |
| Total mutations | 38 | 121 | 285 | 525 |
| MLH1 | 15 | 51 | 112 | 204 |
| MSH2 | 16 | 63 | 173 | 250 |
| MSH6 | 7 | 7 | N/A | 71 |
| Molecular testing included | Yes | Yes | No | No |
| Gene-specific estimates given | No | Yes§ | No | Yes |
N/A= not available
Deletion testing for MLH1 and MSH2 genes
N=1016
Estimates provided without evidence for model’s performance
Our study has potential limitations. For the identification of high-risk individuals we relied on the patients’ self-report of personal and family history of CRC, extracolonic cancers, and polyps. Although the information was provided by healthcare providers who filled out the data-collection form, there may have been some inaccuracies. However, we used similar methodology in developing the first version, PREMM1,2, which performed well in an external European population.14 In addition, the external validation of the PREMM1,2,6 model among cases provided by the CCFR lends credence to the model’s discriminative performance as proband information is obtained through detailed, systematic methods to assure reliable data collection. While the development cohort represents patients at heightened risk based on cancer history, the external validation cohort allowed for study on the impact of population-based ascertainment on prediction. We did not note a difference in the model’s discriminatory ability based on population-based recruitment. We did not have data on MSI and IHC testing in the development cohort, but the CCFR validation cohort provides such data. Molecular tumor testing was conducted for all population-based cases and genetic testing was performed when tumors displayed microsatellite instability. In contrast, genetic testing was performed on all clinic-based cases regardless of MSI/IHC results. The excellent performance in the validation cohort indicates that the model performs well regardless of MSI/IHC status. Further studies are underway to assess the value of combinations of model predictions and tumor test results in refining predictions.29
How can prediction models help patients and clinicians? There is a clear demand for easy risk assessment tools as evidenced by the fact that the current PREMM1,2 website has over 1000 users per month. In contrast to breast cancer, awareness of hereditary CRC and genetic counseling referral and predictive testing is still extremely low. Part of this is due to the myriad of diagnostic criteria which are cumbersome to use and do not provide quantitative estimates for the individual patient. While tumor analyses with MSI and IHC is recommended to screen for Lynch Syndrome, the pool of at-risk individuals is far greater than those affected with cancer and includes unaffected individuals in whom close monitoring and aggressive intervention may have benefit. Therefore the PREMM1,2,6 model may be used as an initial screening tool in practice by healthcare providers to determine who needs further genetic assessment. Based on data from this study and a prior population-based cohort, we have shown that a score of >5% may be a reasonable threshold over which referral for further genetic risk assessment should be recommended.14 Once referral for genetic evaluation is made, the specialist can use the PREMM1,2,6 model to obtain gene-specific risk estimates which may be most useful in cases where molecular tumor analyses are unavailable or inconclusive. The gene-specific estimates provided by PREMM1,2,6 can be used with conclusive tumor data to further support the decision to pursue DNA mutation analysis on the single, specific gene. Additionally, in cases where a gene mutation in MLH1, MSH2, or MSH6 is not detected by clinical genetic testing, a high overall PREMM1,2,6 score (≥20%) may warrant consideration for PMS2, MYH, or TACSTD1 testing, in the appropriate clinical scenario. These individuals will merit further study as new gene discoveries related to familial CRC are reported.
In conclusion, the PREMM1,2,6 model provides gene-specific risk estimates for the probability of a mutation in either the MLH1, MSH2 or MSH6 genes and should now be used in place of PREMM1,2. The PREMM1,2,6 model can help individualize cancer risk assessment and help decide for whom germline DNA sequencing is most appropriate. Estimating pretest gene mutation probability is an important initial step in assessing Lynch Syndrome, as the decision to undergo germline testing is complex. The PREMM1,2,6 model can help providers not only identify those patients at-risk but quantify the individual’s gene-specific risk. This information can influence the genetic testing strategy on an individual basis and facilitate the communication process between healthcare provider and patient, allowing for a tailored, personal, and possibly more cost-effective approach in managing genetic evaluation and cancer surveillance.
Supplementary Material
ACKNOWLEDGMENTS
We would like to acknowledge the following Colon Cancer Family Registries that provided data for the analysis: Australasian Colorectal Cancer Family Registry (U01 CA097735), the University of Southern California (USC) Familial Colorectal Neoplasia Collaborative Group (U01 CA074799), Mayo Clinic Cooperative Family Registry for Colon Cancer Studies (U01 CA074800), Ontario Registry for Studies of Familial Colorectal Cancer (U01 CA074783), Seattle Colorectal Cancer Family Registry (U01 CA074794), and University of Hawaii Colorectal Cancer Family Registry (U01 CA074806).
This work was supported by the National Cancer Institute, National Institutes of Health under RFA # CA-95-011 and through cooperative agreements with members of the Colon Cancer Family Registry and P.I.s. The content of this manuscript does not necessarily reflect the views or policies of the National Cancer Institute or any of the collaborating centers in the CFRs, nor does mention of trade names, commercial products, or organizations imply endorsement by the US Government or the CFR.
Grant Support: The study was supported by the National Cancer Institute (R01CA132829, Syngal and K24 CA113433, Syngal); Recruitment, data collection, and genetic testing for the Colon Cancer Family Registry work were supported by the National Cancer Institute, National Institutes of Health (CA095011) and through cooperative agreements with the members of the Colon Cancer Family Registry and principal investigators.
Footnotes
Publisher's Disclaimer: This is a PDF file of an unedited manuscript that has been accepted for publication. As a service to our customers we are providing this early version of the manuscript. The manuscript will undergo copyediting, typesetting, and review of the resulting proof before it is published in its final citable form. Please note that during the production process errors may be discovered which could affect the content, and all legal disclaimers that apply to the journal pertain.
Disclosures: Drs. Kastrinos, Steyerberg, Balmana, Mercado, Gallinger, Siegmund, Jenkins, Lindor, and Thibodeau have nothing to disclose; Ms. Holter has nothing to disclose; Ms. Burbidge and Dr. Wenstrup report employment and stock or other ownership interests in Myriad Genetics laboratories; Dr Church is a member of the Speaker’s Bureau of Myriad Genetics; Dr. Syngal reports a consultant/advisory relationship with Interquest Inc. and Archimedes, Inc.
Author role in manuscript: (1) conception and design of the study: Kastrinos, Steyerberg, Balmaña, Syngal, (2) generation, collection, assembly of data: Burbidge, Wenstrup, Holter, Gallinger, Siegmund, Church, Jenkins, Lindor, Thibodeau, (3) data analysis and interpretation: Kastrinos, Steyerberg, Balmaña, Mercado, Jenkins, Syngal, (4) drafting or revision of manuscript: Kastrinos, Steyerberg, Balmaña, Mercado, Syngal, (5) approval of final version of the manuscript: Kastrinos, Steyerberg, Balmaña, Burbidge, Mercado, Holter, Gallinger, Siegmund, Church, Jenkins, Lindor, Thibodeau, Wenstrup, Syngal
REFERENCES
- 1.Lynch HT, de la Chapelle A. Hereditary colorectal cancer. N Engl J Med. 2003;348:919–922. doi: 10.1056/NEJMra012242. [DOI] [PubMed] [Google Scholar]
- 2.Grady WM. Genetic testing for high-risk colon cancer patients. Gastroenterology. 2003;124:1574–1594. doi: 10.1016/s0016-5085(03)00376-7. [DOI] [PubMed] [Google Scholar]
- 3.Chung DC, Rustgi AK. The hereditary nonpolyposis colorectal cancer syndrome: genetic and clinical implications. Ann Intern Med. 2003;138:560–570. doi: 10.7326/0003-4819-138-7-200304010-00012. [DOI] [PubMed] [Google Scholar]
- 4.Stoffel EM, Mukherjee B, Raymond VM, et al. Calculation of risk of colorectal and endometrial cancer among patients with Lynch syndrome. Gastroenterology. 2009;137:1621–1627. doi: 10.1053/j.gastro.2009.07.039. [DOI] [PMC free article] [PubMed] [Google Scholar]
- 5.Baglietto L, Lindor NM, Dowty JG, et al. Risks of Lynch Syndrome Cancers for MSH6 Mutation Carriers. J Natl Cancer Inst. 2009;102:193–201. doi: 10.1093/jnci/djp473. [DOI] [PMC free article] [PubMed] [Google Scholar]
- 6.Jarvinen HJ, Aarnio M, Mustonen H, et al. Controlled 15-year trial on screening for colorectal cancer in families with hereditary nonpolyposis colorectal cancer. Gastroenterology. 2000;118:829–834. doi: 10.1016/s0016-5085(00)70168-5. [DOI] [PubMed] [Google Scholar]
- 7.de Jong AE, Hendiks YM, Kleibeuker JH, et al. Decrease in mortality in Lynch syndrome families because of surveillance. Gastroenterology. 2006;130:665–671. doi: 10.1053/j.gastro.2005.11.032. [DOI] [PubMed] [Google Scholar]
- 8.Schmeler KM, Lynch HT, Chen LM, et al. Prophylactic surgery to reduce the risk of gynecologic cancers in the Lynch syndrome. N Eng J Med. 2006;354:261–296. doi: 10.1056/NEJMoa052627. [DOI] [PubMed] [Google Scholar]
- 9.Vasen HFA, Mecklin JP, Meera Khan P, et al. The international collaborative group on HNPCC. Dis Colon Rectum. 1991;34:424–425. doi: 10.1007/BF02053699. [DOI] [PubMed] [Google Scholar]
- 10.Vasen HFA, Watson P, Mecklin JP, et al. New criteria for HNPCC proposed by the ICG-HNPCC. Gastroenterology. 1999;116:1453–1456. doi: 10.1016/s0016-5085(99)70510-x. [DOI] [PubMed] [Google Scholar]
- 11.Rodriquez-Bigas MA, Boland CR, Hamilton SR, et al. An NCI workshop on HNPCC: meeting highlights and Bethesda guidelines. J Natl Cancer Inst. 1997;89:1758–1762. doi: 10.1093/jnci/89.23.1758. [DOI] [PubMed] [Google Scholar]
- 12.Umar A, Boland CR, Terdiman JP, et al. Revised Bethesda Guidelines for hereditary Nonpolyposis colorectal cancer (Lynch Syndrome) and microsatellite instability. J Natl Cancer Inst. 2004;96:261–268. doi: 10.1093/jnci/djh034. [DOI] [PMC free article] [PubMed] [Google Scholar]
- 13.Balmaña J, Stockwell DH, Steyerberg EW, et al. Prediction of MLH1 and MSH2 Mutations in Lynch Syndrome. JAMA. 2006;296:1469–1478. doi: 10.1001/jama.296.12.1469. [DOI] [PubMed] [Google Scholar]
- 14.Balaguer F, Balmaña J, Castellví-Bel S, et al. Validation and extension of the PREMM1,2 model in a population-based cohort of colorectal cancer patients. Gastroenterology. 2008;134:39–46. doi: 10.1053/j.gastro.2007.10.042. [DOI] [PMC free article] [PubMed] [Google Scholar]
- 15.Balmaña J, Balaguer F, Castellví-Bel S, et al. Comparison of predictive models, clinical criteria and molecular tumour screening for the identification of patients with Lynch syndrome in a population-based cohort of colorectal cancer patients. J Med Genet. 2008;45:557–563. doi: 10.1136/jmg.2008.059311. [DOI] [PubMed] [Google Scholar]
- 16.Steyerberg EW, Balmaña J, Stockwell DH, et al. Data reduction for prediction: a case study on robust coding of age and family history for the risk of having a genetic mutation. Stat Med. 2007;26:5545–5556. doi: 10.1002/sim.3119. [DOI] [PubMed] [Google Scholar]
- 17.Steyerberg EW. Clinical prediction models: a practical approach to development, validation, and updating. New York, NY: Springer Science+Business Media; 2009. [Google Scholar]
- 18.McGeechan K, Macaskill P, Irwig L, et al. Assessing new biomarkers and predictive models for use in clinical practice: a clinician's guide. Arch Intern Med. 2008;168:2304–2310. doi: 10.1001/archinte.168.21.2304. [DOI] [PubMed] [Google Scholar]
- 19.Newcomb PA, Baron J, Cotterchio M, et al. Colon Cancer Family Registry: an international resource for studies of the genetic epidemiology of colon cancer. Cancer Epidemiol Biomarkers Prev. 2007;16:2331–2343. doi: 10.1158/1055-9965.EPI-07-0648. [DOI] [PubMed] [Google Scholar]
- 20.Wijnen J, De Leeuw W, Vasen H, et al. Familial endometrial cancer in female carriers of MSH6 germline mutations. Nat Genet. 1999;23:142–144. doi: 10.1038/13773. [DOI] [PubMed] [Google Scholar]
- 21.Plaschke J, Engel C, Kruger S, et al. German HNPCC-Consortium. Lower incidence of colorectal cancer and later age of disease onset in 27 families with pathogenic MSH6 germline mutations compared to families with MLH1 or MSH2 mutations. J Clin Oncol. 2004;22:4486–4494. doi: 10.1200/JCO.2004.02.033. [DOI] [PubMed] [Google Scholar]
- 22.Barnetson RA, Tenesa A, Farrington SM, et al. Identification and survival of carriers of mutations in DNA mismatch repair genes in colon cancers. N Engl J Med. 2006;354:2751–2763. doi: 10.1056/NEJMoa053493. [DOI] [PubMed] [Google Scholar]
- 23.Goecke T, Schulmann K, Engel C, et al. Genotype-phenotype comparison of German MLH1 and MSH2 mutation carriers clinically affected with Lynch Syndrome: a report by the German HNPCC Consortium. J Clin Oncol. 2006;24:4285–4292. doi: 10.1200/JCO.2005.03.7333. [DOI] [PubMed] [Google Scholar]
- 24.Kastrinos F, Stoffel E, Balmaña J, et al. Phenotype Comparison of MLH1 and MSH2 Mutation Carriers in a Cohort of 1914 Individuals Undergoing Clinical Genetic Testing in the United States. Cancer Epidemiol Biomarkers Prev. 2008;17:2044–2051. doi: 10.1158/1055-9965.EPI-08-0301. [DOI] [PubMed] [Google Scholar]
- 25.Chen S, Wang W, Lee S, et al. Prediction of germline mutations and cancer risk in the Lynch syndrome. JAMA. 2006;296:1479–1487. doi: 10.1001/jama.296.12.1479. [DOI] [PMC free article] [PubMed] [Google Scholar]
- 26.Green RC, Parfrey PS, Woods MO, et al. Prediction of Lynch Syndrome in Consecutive Patients with Colorectal Cancer. J Natl Cancer Inst. 2009;101:331–340. doi: 10.1093/jnci/djn499. [DOI] [PubMed] [Google Scholar]
- 27.Pouchet CJ, Wong N, Chong G, et al. A comparison of models used to predict MLH1, MSH2 and MSH6 mutation carriers. Ann Oncol. 2009;20:681–688. doi: 10.1093/annonc/mdn686. [DOI] [PubMed] [Google Scholar]
- 28.Monzon JG, Cremin C, Armstrong L, et al. Validation of predictive models for germline mutations in DNA mismatch repair genes in colorectal cancer. Int J Cancer. 2010;126:930–939. doi: 10.1002/ijc.24808. [DOI] [PubMed] [Google Scholar]
- 29.Kastrinos F, Steyerberg EW, Balmaña J, et al. Comparison of the clinical prediction model PREMM1,2,6 with colorectal cancer molecular tumor testing for Lynch Syndrome in the Colon Cancer Family Registry. Gastroenterology. 2010;138 Supplement 1:149–150. [Google Scholar]
Associated Data
This section collects any data citations, data availability statements, or supplementary materials included in this article.