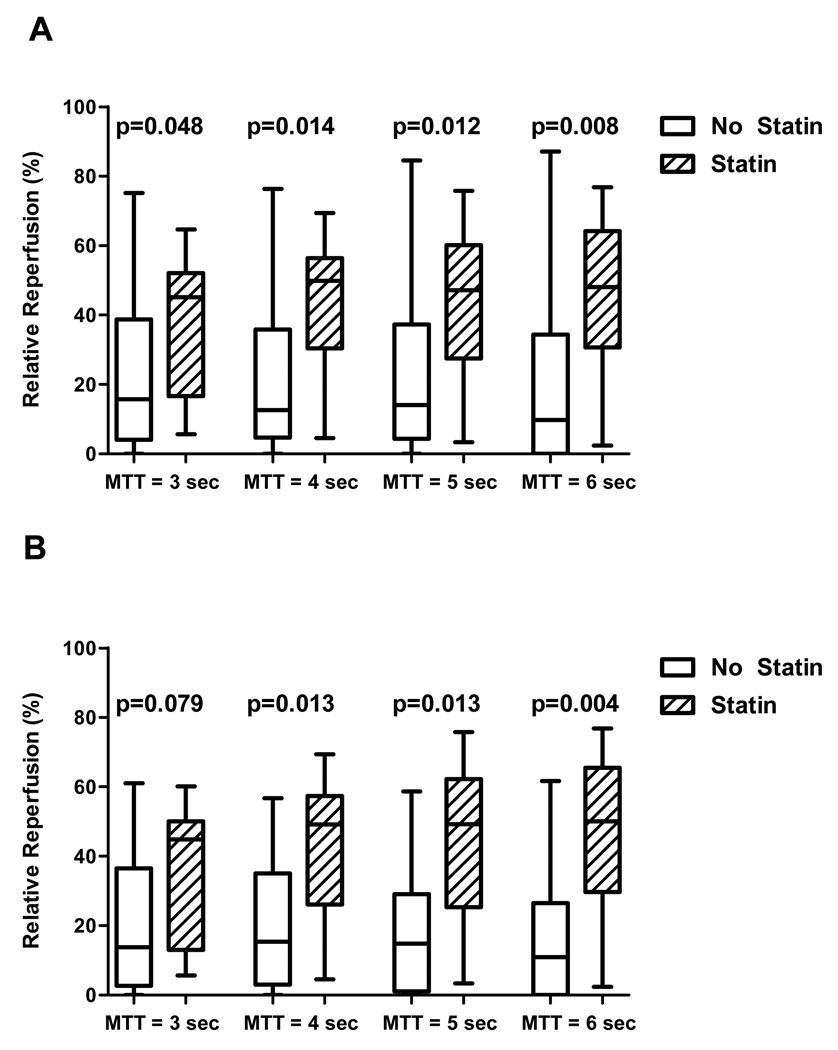
Figure 3. Statin use and relative reperfusion.
(A) Entire sample, n=31: Boxplots (median, IQR) for relative reperfusion at each MTT threshold are shown for all 31patients. For each MTT threshold, there was significantly greater reperfusion in the statin group compared to the untreated group. (B) tPA-treated patients only, n=23: Boxplots for relative reperfusion at each MTT threshold are shown for tPA-treated patients only. For each MTT threshold except MTT=3 seconds, there was significantly greater reperfusion in the statin group compared to the untreated group.

