Abstract
The IntFOLD server is a novel independent server that integrates several cutting edge methods for the prediction of structure and function from sequence. Our guiding principles behind the server development were as follows: (i) to provide a simple unified resource that makes our prediction software accessible to all and (ii) to produce integrated output for predictions that can be easily interpreted. The output for predictions is presented as a simple table that summarizes all results graphically via plots and annotated 3D models. The raw machine readable data files for each set of predictions are also provided for developers, which comply with the Critical Assessment of Methods for Protein Structure Prediction (CASP) data standards. The server comprises an integrated suite of five novel methods: nFOLD4, for tertiary structure prediction; ModFOLD 3.0, for model quality assessment; DISOclust 2.0, for disorder prediction; DomFOLD 2.0 for domain prediction; and FunFOLD 1.0, for ligand binding site prediction. Predictions from the IntFOLD server were found to be competitive in several categories in the recent CASP9 experiment. The IntFOLD server is available at the following web site: http://www.reading.ac.uk/bioinf/IntFOLD/.
INTRODUCTION
In this post-genomic era, the gap between sequences and proteins with known structures or functions is continuing to widen at a seemingly exponential rate. At the time of writing, there are <66 000 protein structures in the PDB, but ∼13 million protein sequences in the non-redundant databases. Thus, bioinformatics tools, such as those integrated by the IntFOLD server, are being developed in order to help close the gaps in our knowledge between sequence and structure (1), while also helping us to infer function from structure using binding site residue prediction tools.
The IntFOLD server is a fully integrated pipeline, combining each of our cutting edge tools for the prediction of structure and function from a single sequence and is intended for use by both expert and non-expert biologists alike. A user-friendly interface is provided for query sequence submission, which allows non-expert users to predict a variety of protein structural features including: tertiary structure, intrinsic disorder, domain boundaries, ligand binding site residues as well as providing an analysis of the quality of the 3D models generated. Optionally, users with more expertise may upload a single 3D model or a set of models to be included in the prediction pipeline for quality assessment.
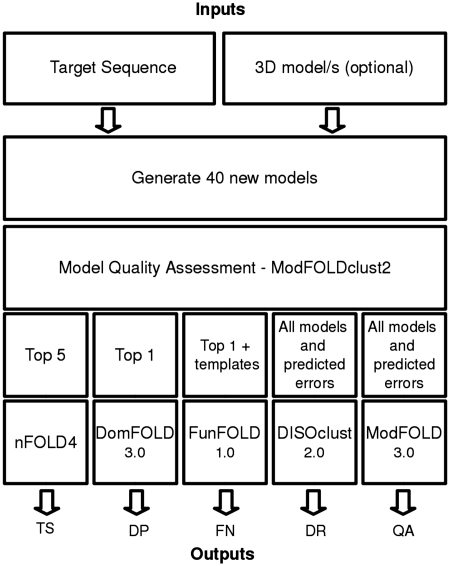
The methods within the IntFOLD pipeline are interdependent, with output from one algorithm becoming the input for another (Figure 1). The IntFOLD server provides a detailed help page, which includes information on the required input and output from the server, example results pages and a guide for interpreting results. The integration of these methods into a single annotation pipeline increases computational efficiency, the efficiency of server management and reduces the time required for researchers, to submit predictions and collate and analyze their results.
Figure 1.
Diagram of the software stack implemented for the IntFOLD server. This figure highlights the interdependency of the IntFOLD algorithms, with ModFOLDclust2 acting as the key algorithm in the IntFOLD pipeline. A query protein sequence is first submitted, with ∼40 new models generated. Secondly, the models are fed into the ModFOLDclust2 (7) model quality assessment algorithm, which ranks the models by model quality. The models are then used along with a combination of local error and template information to produce all the resulting output for 3D structure prediction (TS), domain prediction (DP), binding site residue prediction function prediction (FN), disorder prediction (DR) and model quality assessment (QA).
The IntFOLD server has been operational since late January 2010 and the outputs have been extensively tested by researchers both within the UK and internationally, and most intensively, during the prediction season for the Ninth Community Wide Experiment on the Critical Assessment of Methods for Protein Structure Prediction (CASP9), which ran from April to August 2010. Each of the sever methods were tested on the 129 protein targets comprising the CASP9 data set and were additionally run on >400 targets of special interest to researchers at the University of Reading and Imperial (2). Following the CASP9 experiment, the IntFOLD server predictions were rigorosly validated by independent assessors using numerous performance benchmarks.
Although other freely available servers exist (3–6) that generate results using related individual methods, the IntFOLD server is unique in providing an integrated underlying methodology for our latest competitive methods, unified graphical output and a single point for submission. Furthermore, the server provides expert users with machine readable results in the standard CASP formats.
IMPLEMENTATION
This section gives a brief overview of the algorithms integrated by the IntFOLD server. Underpinning all methods in the server is the ModFOLDclust2 model quality assessment tool (7), which is used to rank all models in terms of their global quality as well as providing estimates of local quality as distances in Ångströms. The various outputs from ModFOLDclust2 are used in all subsequent levels of the software stack (Figure 1).
Tertiary structure prediction using nFOLD4
The IntFOLD server implements version 4 of the nFOLD method (8) to produce tertiary structure (TS) predictions. The nFOLD4 algorithm, combines alignment output from in-house versions of several profile-based fold recognition methods namely SP3 (9), SPARKS (9), HHsearch (10) and COMA (11), generating up to 40 alternative 3D models from bespoke 40% and 70% non-redundant template libraries. The full atom models are subsequently ranked using the ModFOLDclust2 (7) model quality assessment method and per residue quality prediction scores (distances in Å) are added to the B-factor columns in the resulting PDB files. The nFOLD4 method (IntFOLD-TS) was benchmarked for CASP9 and was identified by assessors as one of the better performing new independent servers (http://predictioncenter.org/casp9/groups_analysis.cgi). The method also received the highest number of votes from CASP9 participants as the server they considered to be ‘innovative, having potential to improve the field, or otherwise interesting’.
Disorder prediction using DISOclust 2.0
In order to produce predictions of intrinsic disorder, the IntFOLD server implements version 2.0 of the DISOclust (12) method. DISOclust version 2.0 depends on the ModFOLDclust2 QMODE2 output in order to identify the regions of high variability occurring in 3D models generated for the nFOLD4 stack (Figure 1). In CASP9, DISOclust version 2.0 (IntFOLD-DR) was one of the top eight methods, which were statistically inseparable according to area under curve (AUC) scores (http://www.predictioncenter.org/casp9/doc/presentations/CASP9_DR.pdf). The previous iteration of the method also was one of the top three methods tested at CASP8 (13).
Domain prediction using DomFOLD
For the prediction of domain boundaries, the IntFOLD server implements version 2.0 of the DomFOLD method. The method utilizes the PDP method (14) in order to identify structural domains in the top model obtained from the nFOLD4 method. The output from PDP is then parsed to produce CASP formatted output. Previous iterations of the DomFOLD method competed in CASP7 and CASP8; however, the category of domain prediction (DP) has since been removed by the CASP organizers.
Function prediction using FunFOLD 1.0
In order to produce ligand binding site residue predictions, the FunFOLD method is implemented by the IntFOLD server. The FunFOLD algorithm works by performing model-to-template superpositions, of the top ranked nFOLD4 3D model and related templates with bound ligands, in order to identify putative contacting residues. A novel agglomerative hierarchical clustering algorithm is used for identifying putative ligands and a voting system is used for residue selection. A prototype version of the FunFOLD server method was developed during the CASP9 prediction season (IntFOLD-FN), which relied on querying an external database (15) to identify biologically relevant ligands. However, this version was found to be unreliable during the prediction season, often dropping the external connection. We have since updated the server, which is now independent of external databases and has been retested on the CASP9 set. The latest version of the server is now similar in performance to our manual group predictions, which were found to be competitive with the top methods tested, according to both Matthews correlation coeffient (MCC) (16) and binding-site distance test (BDT) (17) scores (http://predictioncenter.org/casp9/doc/presentations/CASP9_FN.pdf).
Model quality assessment using ModFOLD 3.0
Version 3.0 of the ModFOLD 3D model quality assessment method is integrated into the IntFOLD pipeline (IntFOLD-QA). This new version of ModFOLD (18) is capable of carrying out either single-model mode or multiple-model mode clustering. Each submitted model is compared against the models generated by nFOLD4 (and every other provided model) using the ModFOLDclust2 method (7). The previous version of ModFOLD was assessed in the CASP8 (19) experiment and the performance of the latest version in CASP9 indicated that it remains one of the leading model quality assessment methods (http://predictioncenter.org/casp9/doc/presentations/CASP9_QA.pdf).
INPUTS AND OUTPUTS
The IntFOLD server provides a simple interface for job submission; the only required input is a protein sequence in single letter code. However, users may opt to additionally provide the following: alternative 3D models of their protein target, a name for their protein sequence and their email address. Upon sequence submission to the server, a unique URL for the output is generated, which the user may bookmark. Alternatively, if a user provides their email address, they will be sent a reminder for the link once their job has been completed.
Figure 1 shows a diagram of software stack implemented for the IntFOLD server, which highlights the independency of the underlying algorithms. Model generation followed by quality assessment using ModFOLDclust2 (7) is the first key stage for all methods. Approximately, 40 alternative 3D models are generated for each input sequence, which are then used as inputs to ModFOLDclust2 (7) and ranked according to predicted model quality. Following the nFOLD4 branch of the software stack, the top five models are subsequently annotated with per-residue accuracy scores and outputted in CASP TS format. The DomFOLD 3.0 branch of the stack uses the top nFOLD4 model to predict domain boundaries and outputs results in CASP DP format. The FunFOLD 1.0 branch then utilizes the top nFOLD4 model and the list of identified templates used for model generation, which contain biologically relevant ligands, in order to produce ligand binding site residue predictions in CASP FN format. The DISOclust 2.0 algorithm utilizes all the generated models plus the per-residue errors calculated by ModFOLDclust2 (7), in order to generate disorder predictions in CASP DR format. Finally, the ModFOLD 3.0 algorithm takes as its input all the models produced by nFOLD4, plus the errors calculated by ModFOLDclust2, to produce model quality predictions in CASP QA (QMODE2) format (See http://predictioncenter.org/casp9/index.cgi?page=format for a description of CASP data formats).
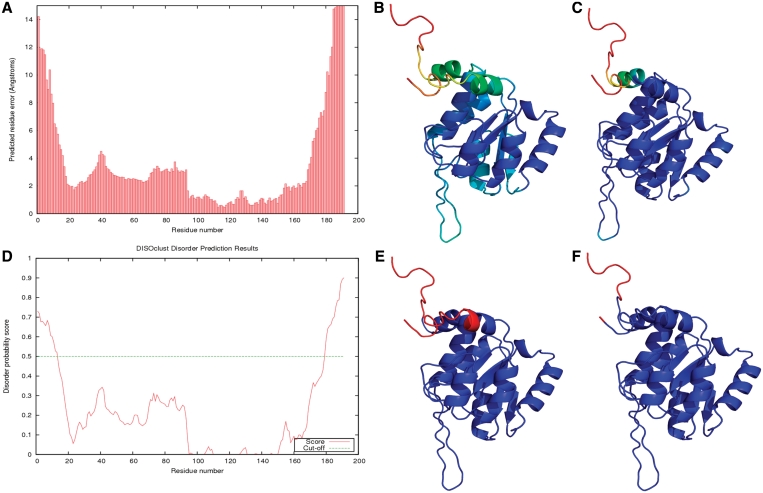
The results for each submission to the IntFOLD server are then parsed and formatted into a single table that summarizes all prediction data graphically through thumbnail images of plots and annotated 3D models, such as those seen in Figures 3 and 4. The top of the results page contains links to each prediction category. This is followed by the model quality assessment results for the top five models, with a plot of the predicted per-residue error for each model (Figure 3A) and a thumbnail images of each model colored by predicted residue error (blue indicating high confidence and red indicating low confidence in the residue) (Figure 3B). The predicted per-residue error plots can be downloaded as a PostScript files. In addition, each model image links to an interactive results page, using the Jmol plug-in (http://www.jmol.org/) to visualize the models in 3D. Links to download the PDB files, with the per-residue errors in the B-factor column, are also provided.
Figure 3.
IntFOLD results for CASP9 target T0635 (PDBID 3n1u). The results for ModFOLD 3.0 (A), nFOLD4 (B), DISOclust 2.0 (D and E) are shown, along with the observed per-residue error (C) and the observed disordered residues (F). (A) The predicted per-residue error in Ångströms. (B) The predicted per-residue error mapped onto the top nFOLD4 model, colored from red to blue (bad to good). (C) The observed per-residue error mapped onto the top nFOLD4 model, again colored from red to blue (bad to good). (D) The disorder prediction plot from DISOclust 2.0. (E) The DISOclust 2.0 results for the top nFOLD4 model, with the residues predicted as disordered highlighted in red. (F) The top nFOLD4 model with the observed disordered residues and residues not present in the experimental structure colored red.
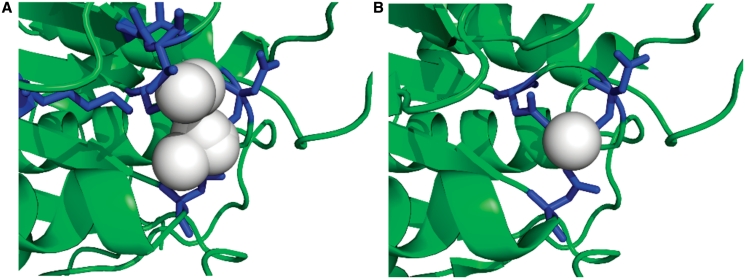
Figure 4.
Predicted and observed binding site residues and ligands, for CASP9 target T0635 (PDBID 3n1u). (A) The FunFOLD 1.0 results with the top model magnified to zoom in on the binding site, the binding site residues are colored blue (25,27,69,70,95,118) and the predicted ligand cluster, with frequencies of putative ligands, colored in white (CL-2, CA-3, SO4-2, PO4-1, MG-5, CO-1). (B) The observed binding site for the native hydrolase (PDBID 3n1u and CASP9 target T0635), with the binding site residues colored blue (25, 27, 118) and the observed ligand (CA) colored white. The binding site prediction has an MCC score (16) of 0.7012 and BDT score (17) of 0.5744.
A disorder profile plot (Figure 3D) is then shown in the table, highlighting the per-residue probabilities of intrinsic disorder for the submitted sequence. The disorder profile plot may also be downloaded as a PostScript file. The next result in the table is a graphic illustrating the domain boundary prediction based on the top model, with each domain highlighted in a different color. The domain prediction image also links to an interactive results page, containing the Jmol plug-in displaying a 3D animation of the model and a link to download the PDB file, which includes domain definitions in the B-factor column.
A graphic displaying the predicted binding site residues in the top 3D model is shown next (Figure 4A). The image again links to an interactive results page, incorporating the Jmol plug-in, with an interactive 3D animation of the model showing the predicted ligands and binding site residues and a link to download the PDB file, which contains all clusters of identified ligands used for the binding site prediction. Finally, the full model quality results are shown for all models.
CASE STUDY—CASP9 TARGET T0635
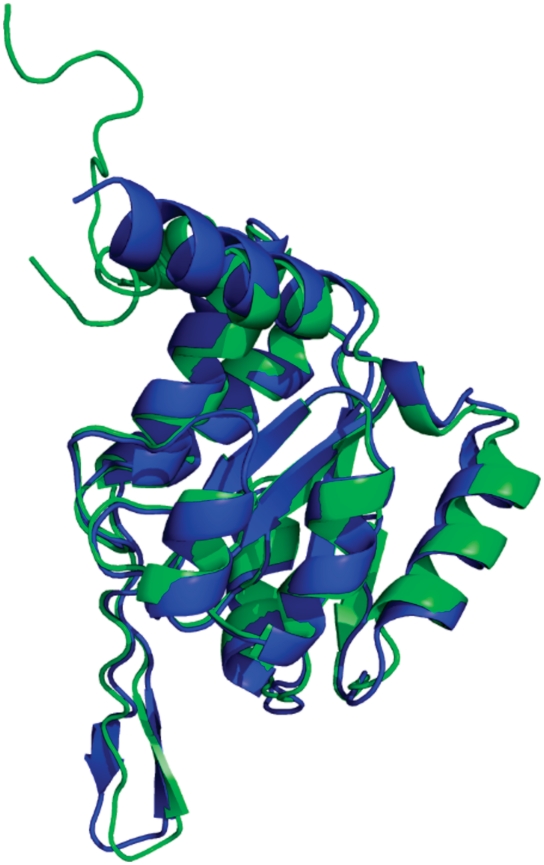
The Legionella pneumophila putative hydrolase, HAD superfamily, subfamily III A (PDBID 3n1u and CASP9 target T0635) provides an example showing the output for each algorithm (Figures 2–4). The top nFOLD4 model (green) superposed onto the experimental protein structure (blue) can be seen in Figure 2. The model-to-template superposition has a TMscore = 0.906 (20), which tells us that the model is a close representation of the native structure.
Figure 2.
Model-to-structure superposition of the top nFOLD4 model (green) and the native hydrolase structure (CASP target T0635, PDBID 3n1u) (blue), with a TMscore (20) = 0.9062 and GDT_TS (21) = 95.81.
Figure 3A shows a plot of the predicted per-residue error results from ModFOLD 3.0. The top nFOLD4 model has reasonably high predicted global model quality score of 0.621, but the termini of the model have comparatively large local errors. The predicted per-residue error for the top model from nFOLD4, colored from red to blue (bad to good) is shown in Figure 3B, while Figure 3C shows the observed per-residue scores for the model.
In Figure 3D, a plot of the predicted per-residue disorder probability score, predicted by DISOclust 2.0, is shown with the cut-off from order to disorder at a disordered probability score of 0.5 highlighted with a green dashed line. The predicted disordered regions (red) are mapped on to the top 3D model from nFOLD4 in Figure 3E, while Figure 3F shows the model with the official disorder definition and residues that were not present in the experimental structure indicated.
The binding site residue prediction from FunFOLD 1.0 is shown in Figure 4A, with the binding site residues highlighted in blue and the predicted ligand cluster in white. The FunFOLD 1.0 method correctly predicted all of the binding site residues, which were in the official CASP9 binding site definition (25,27,118), but also over predicted three residues (69,70,95). The binding site residue prediction has an MCC score = 0.7012 and BDT score = 0.5744, with the protein predicted to bind to a metal—the centroid ligand being calcium. The observed binding site residues and bound calcium ligand for the native structure are shown in Figure 4B.
CONCLUSIONS
The IntFOLD server provides an accessible and unified interface to our leading methods for the prediction of protein structure and function. The algorithms underlying the IntFOLD server have been independently tested in the recent CASP9 competition and were found to be competitive in several categories. The server provides a clean web interface that integrates a complex set of quantitative prediction data, producing a graphical summary of results that may be easily interpreted by non-experts users.
FUNDING
Funding for open access charge: RCUK Academic Fellowship (to L.J.M.); University of Reading Faculty Studentship (to D.B.R.); University of Reading Faculty Studentship, MRC Harwell and the Diamond Light Source Ltd. (to. M.T.B.).
Conflict of interest statement. None declared.
REFERENCES
- 1.Schwede T, Sali A, Honig B, Levitt M, Berman HM, Jones D, Brenner SE, Burley SK, Das R, Dokholyan NV, et al. Outcome of a workshop on applications of protein models in biomedical research. Structure. 2009;17:151–159. doi: 10.1016/j.str.2008.12.014. [DOI] [PMC free article] [PubMed] [Google Scholar]
- 2.Bindschedler LV, McGuffin LJ, Spanu PD, Cramer R. Proteogenomics and in silico structural and functional annotation of the barley powdery mildew Blumeria graminis. f. sp. hordei. Methods. 2011 doi: 10.1016/j.ymeth.2011.03.006. in press. [DOI] [PubMed] [Google Scholar]
- 3.Bau D, Martin AJ, Mooney C, Vullo A, Walsh I, Pollastri G. Distill: a suite of web servers for the prediction of one-, two- and three-dimensional structural features of proteins. BMC Bioinformatics. 2006;7:402. doi: 10.1186/1471-2105-7-402. [DOI] [PMC free article] [PubMed] [Google Scholar]
- 4.Bryson K, McGuffin LJ, Marsden RL, Ward JJ, Sodhi JS, Jones DT. Protein structure prediction servers at University College London. Nucleic Acids Res. 2005;33:W36–W38. doi: 10.1093/nar/gki410. [DOI] [PMC free article] [PubMed] [Google Scholar]
- 5.Rost B, Yachdav G, Liu J. The PredictProtein server. Nucleic Acids Res. 2004;32:W321–W326. doi: 10.1093/nar/gkh377. [DOI] [PMC free article] [PubMed] [Google Scholar]
- 6.Roy A, Kucukural A, Zhang Y. I-TASSER: a unified platform for automated protein structure and function prediction. Nat. Protocols. 2010;5:725–738. doi: 10.1038/nprot.2010.5. [DOI] [PMC free article] [PubMed] [Google Scholar]
- 7.McGuffin LJ, Roche DB. Rapid model quality assessment for protein structure predictions using the comparison of multiple models without structural alignments. Bioinformatics. 2010;26:182–188. doi: 10.1093/bioinformatics/btp629. [DOI] [PubMed] [Google Scholar]
- 8.Jones DT, Bryson K, Coleman A, McGuffin LJ, Sadowski MI, Sodhi JS, Ward JJ. Prediction of novel and analogous folds using fragment assembly and fold recognition. Proteins. 2005;61(Suppl. 7):143–151. doi: 10.1002/prot.20731. [DOI] [PubMed] [Google Scholar]
- 9.Zhou H, Zhou Y. SPARKS 2 and SP3 servers in CASP6. Proteins. 2005;61(Suppl. 7):152–156. doi: 10.1002/prot.20732. [DOI] [PubMed] [Google Scholar]
- 10.Soding J. Protein homology detection by HMM-HMM comparison. Bioinformatics. 2005;21:951–960. doi: 10.1093/bioinformatics/bti125. [DOI] [PubMed] [Google Scholar]
- 11.Margelevicius M, Venclovas C. Detection of distant evolutionary relationships between protein families using theory of sequence profile-profile comparison. BMC Bioinformatics. 2010;11:89. doi: 10.1186/1471-2105-11-89. [DOI] [PMC free article] [PubMed] [Google Scholar]
- 12.McGuffin LJ. Intrinsic disorder prediction from the analysis of multiple protein fold recognition models. Bioinformatics. 2008;24:1798–1804. doi: 10.1093/bioinformatics/btn326. [DOI] [PubMed] [Google Scholar]
- 13.Noivirt-Brik O, Prilusky J, Sussman JL. Assessment of disorder predictions in CASP8. Proteins. 2009;77(Suppl. 9):210–216. doi: 10.1002/prot.22586. [DOI] [PubMed] [Google Scholar]
- 14.Alexandrov N, Shindyalov I. PDP: protein domain parser. Bioinformatics. 2003;19:429–430. doi: 10.1093/bioinformatics/btg006. [DOI] [PubMed] [Google Scholar]
- 15.Lopez G, Valencia A, Tress M. FireDB–a database of functionally important residues from proteins of known structure. Nucleic Acids Res. 2007;35:D219–D223. doi: 10.1093/nar/gkl897. [DOI] [PMC free article] [PubMed] [Google Scholar]
- 16.Matthews BW. Comparison of the predicted and observed secondary structure of T4 phage lysozyme. Biochim. Biophys. Acta. 1975;405:442–451. doi: 10.1016/0005-2795(75)90109-9. [DOI] [PubMed] [Google Scholar]
- 17.Roche DB, Tetchner SJ, McGuffin LJ. The binding site distance test score: a robust method for the assessment of predicted protein binding sites. Bioinformatics. 2010;26:2920–2921. doi: 10.1093/bioinformatics/btq543. [DOI] [PubMed] [Google Scholar]
- 18.McGuffin LJ. The ModFOLD server for the quality assessment of protein structural models. Bioinformatics. 2008;24:586–587. doi: 10.1093/bioinformatics/btn014. [DOI] [PubMed] [Google Scholar]
- 19.Cozzetto D, Kryshtafovych A, Tramontano A. Evaluation of CASP8 model quality predictions. Proteins. 2009;77(Suppl. 9):157–166. doi: 10.1002/prot.22534. [DOI] [PubMed] [Google Scholar]
- 20.Zhang Y, Skolnick J. TM-align: a protein structure alignment algorithm based on the TM-score. Nucleic Acids Res. 2005;33:2302–2309. doi: 10.1093/nar/gki524. [DOI] [PMC free article] [PubMed] [Google Scholar]
- 21.Zemla A. LGA: a method for finding 3D similarities in protein structures. Nucleic Acids Res. 2003;31:3370–3374. doi: 10.1093/nar/gkg571. [DOI] [PMC free article] [PubMed] [Google Scholar]


