Abstract
The University of Minnesota Pathway Prediction System (UM-PPS, http://umbbd.msi.umn.edu/predict/) is a rule-based system that predicts microbial catabolism of organic compounds. Currently, its knowledge base contains 250 biotransformation rules and five types of metabolic logic entities. The original UM-PPS predicted up to two prediction levels at a time. Users had to choose a predicted product to continue the prediction. This approach provided a limited view of prediction results and heavily relied on manual intervention. The new UM-PPS produces a multi-level prediction within an acceptable time frame, and allows users to view prediction alternatives much more easily as a directed acyclic graph.
INTRODUCTION
As anthropogenic chemicals increasingly enter the environment, it is becoming imperative to understand their fate in soil and water. The environmental fate of chemicals is largely predicated on their biodegradation by microbes. Conducting biodegradation studies for all new chemicals would be prohibitively expensive. In this context, scientists and nonscientists are increasingly relying on computational tools that predict biodegradation. Well-curated information on microbial biodegradation is the basis for developing knowledge-based systems for in silico predictions of metabolic pathways and accumulating end products.
The University of Minnesota Biocatalysis/Biodegradation Database (UM-BBD, http://umbbd.msi.umn.edu/) is a manually curated database containing information on over 1350 microbial catabolic reactions and about 200 biodegradation pathways (1). The University of Minnesota Pathway Prediction System (UM-PPS, http://umbbd.msi.umn.edu/predict/) predicts biodegradation pathways using 250 biotransformation rules based on data in the UM-BBD and the scientific literature. Since its public release in 2002, the UM-PPS has served as an important web-based biodegradation prediction tool. We have reported content, methods and the initial development of the UM-PPS in previous papers (2,3).
Five types of metabolic logic entities are used in the UM-PPS: ‘absolute aerobic likelihood’ ranks rules according to their aerobic likelihood on a 5-point scale: Very Likely, Likely, Neutral, Unlikely and Very Unlikely; ‘immediate feature’ gives highest priority to certain rules that guide users to the most likely pathways; ‘relative reasoning’ gives certain rules priority over others to prune false positive biotransformations; ‘super rules’ combine selected contiguous rules that constitute a small known pathway; and ‘variable aerobic likelihood’ gives more accurate likelihood for rules triggered by compounds with certain chemical structures (1,3).
When a user enters a compound in the UM-PPS, its organic functional groups are recognized and may trigger one or more biotransformation rules. At its start in 2002, only the products of the first reactions were displayed. This did not usually show complete metabolism of the compound and a user had to choose from the products to continue the prediction. This process required the user to have extensive knowledge of biodegradation and make educated choices as to the best pathway to pursue.
In 2007, a UM-PPS user asked that we display predictions as a metabolic tree. It was not possible to do this rapidly enough for interactive use at that time, but in 2008, with an update of our server, we were able to show two prediction levels in a timely manner (1). In 2009, we started to develop a multi-level prediction system and, simultaneously, work on increasing prediction speed. This system was made public in August 2010. It allows users to visualize all plausible products and pathways in a directed acyclic graph (DAG) within an acceptable time frame.
There are several systems similar to the UM-PPS. METEOR predicts mammalian detoxification metabolism (4); CATALOGIC is a platform for models targeting environmental fate of chemicals (5); and PathPred predicts enzyme-catalyzed metabolic pathways based on chemical similarity (6). Among these systems, the UM-PPS is the only rule-based system that is freely accessible. It handles up to 10 000 queries per year, and its use is increasing.
UM-PPS UPDATES
The UM-PPS knowledge base is continually modified and updated. In January 2011, there were 250 total biotransformation rules with ‘absolute aerobic likelihood’, 21 of them using the ‘immediate feature’, 122 with ‘relative reasoning’ entries, 22 being ‘super rules’ and 27 with ‘variable aerobic likelihood’. Besides additions, much time and effort are spent on updating existing biotransformation rules and metabolic logic entities to improve their accuracy.
UM-PPS HARDWARE AND SOFTWARE
Since 2007, the UM-BBD and UM-PPS have been hosted at a high-performance UNIX server in the Minnesota Supercomputing Institute (http://www.msi.umn.edu/). The knowledge base is stored in a MySQL 5.0 relational database. The UM-PPS is mainly coded in the Java language and uses ChemAxon Reactor (http://www.chemaxon.com/) as its virtual reaction engine and GraphViz (http://www.graphviz.org/) as its visualization engine. We are currently using ChemAxon 5.4.1 and GraphViz 2.27.
PREDICTION AND VISUALIZATION METHODS
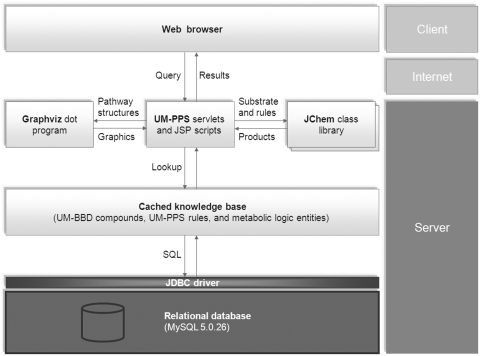
A pipeline system is used to produce a multi-level prediction and to visualize the prediction results. First, the system produces a multi-level prediction based on a recursive method; next, the system formats the pathway prediction results and feeds them into a visualization engine; finally, the system displays pathway graphics in a HTML map on a web browser. The UM-PPS JavaServer Pages and servlets control the prediction processes, as shown in Figure 1.
Figure 1.
UM-PPS pipeline system infrastructure (see text).
Multi-level prediction
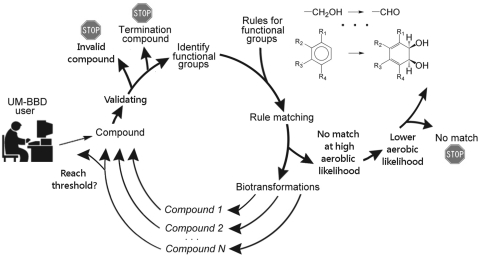
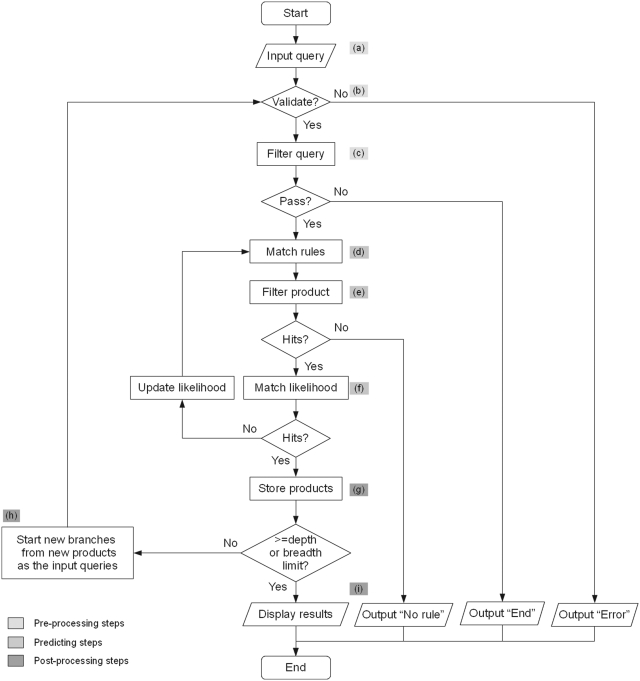
To construct such a prediction, the UM-PPS automatically predicts consecutive metabolic transformations until one of several endpoints is reached. Figure 2 illustrates the system flow and Figure 3 explains this recursive method in more detail.
Figure 2.
UM-PPS pipeline system flow (see text).
Figure 3.
Flowchart showing UM-PPS multi-level prediction. (a) ‘Input query’ takes a query compound and converts it into a SMILES string. (b) ‘Compound validation’ checks the correctness of the string format and chemical structure. (c) ‘Query filter’ runs further checks on valid compounds, removing very low molecular weight compounds, predefined termination compounds and some types of compounds that should not be predicted by the current version of UM-PPS (3). (d) ‘Rule match’ identifies functional groups in a query compound that match rule targets. If there is a successful match, a virtual transformation will be applied to the target functional group. (e) ‘Product filter’ removes transformed products with fewer carbon atoms than a chosen cutoff value (default = 3). (f) ‘Likelihood match’ selects transformed products beyond a chosen aerobic likelihood value (either ‘aerobic’ or ‘all’). If ‘aerobic’ is chosen and there are no products, the UM-PPS will change to ‘all’ and retry the prediction. If there are still no products, the prediction process will stop and a ‘No rule’ message will be returned. At the end of a level, (g) ‘Product storage’ merges products from all prediction branches and removes duplicates. If the total number of products at a level does not reach the chosen breadth cutoff value and the current level does not reach the chosen depth cutoff value, (h) ‘Level iteration’ starts a new prediction branch for each transformed product and moves the prediction process into the next level. If either of these two cutoff values is reached, the UM-PPS will complete the prediction, and (i) ‘Results display’ displays all products and pathways in a DAG.
The above method produces a multi-level prediction by testing query compounds against rules, validating product qualifications and displaying all qualified products in one or more plausible pathway branches. This procedure includes several steps in three categories: pre-processing (Figure 3a–c), predicting (Figure 3d–f) and post-processing (Figure 3g–i).
Pathway representation
Pathway-like structures are not easily interpreted by using basic web languages, such as HTML and CSS. Those structures can be rendered quickly as graphs using GraphViz software (7). The UM-PPS translates all elements of prediction results to the GraphViz dot language and feeds them into the GraphViz dot program. Predicted products and biotransformation rules are converted to nodes and edges, respectively. A node contains information on its chemical structure, including a SMILES string (8) and a two-dimensional (2D) molecule graphic generated by the ChemAxon MarvinView tool (9). A node may contain data source information if a product can be found in the UM-BBD or a subset of the KEGG PATHWAY Database (10). A node may have multiple inputs if a product constitutes an intermediate found more than once in a predicted pathway, and may have multiple outputs if it triggers more than one biotransformation rule.
An edge represents a biotransformation rule, containing information on its data source and biotransformation likelihood. Five edge colors (green, yellow-green, yellow, orange and red) represent the five aerobic likelihood values for the rule (Very Likely, Likely, Neutral, Unlikely and Very Unlikely), respectively (3). An edge has one head pointing to the substrate of the biotransformation and may have two tails pointing to two co-products if that edge represents a biotransformation rule for a reaction that cleaves a single compound into two compounds.
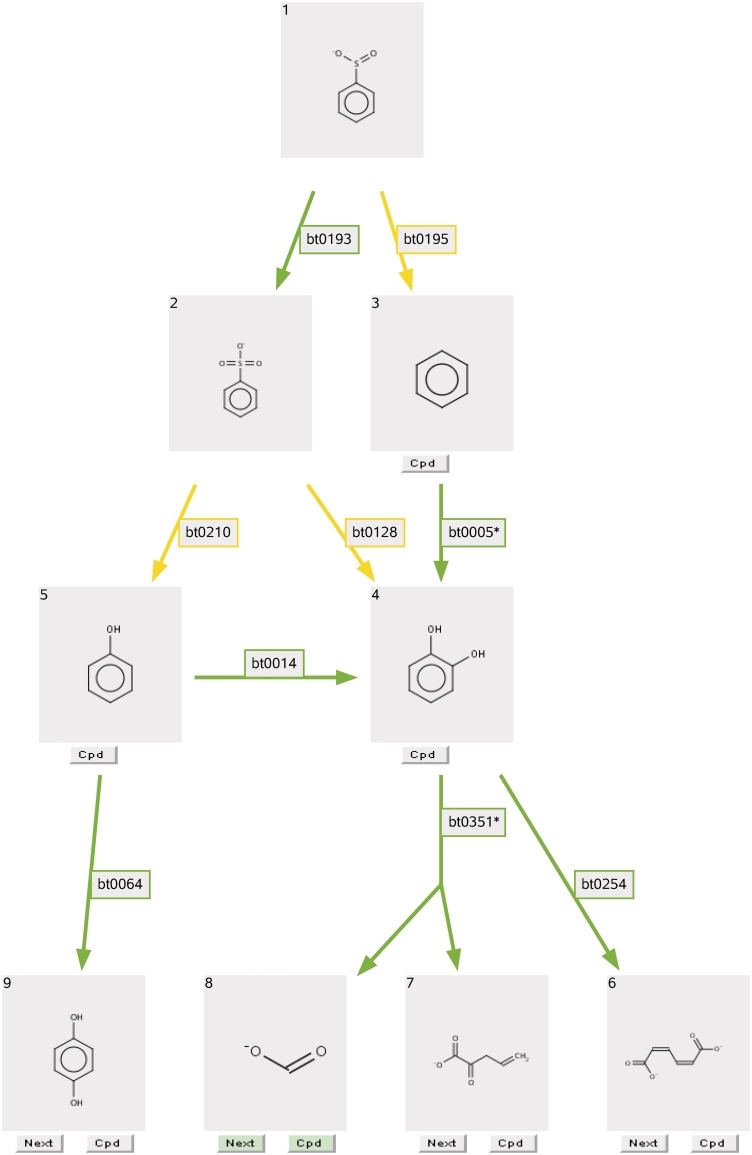
The pathway structure is constructed through a recursive prediction method that starts from the initial query compound to further prediction levels according to whether the breadth or depth reaches chosen cutoff values. Default values are 10 compounds on a row (breadth) and six levels (depth), as described below. When the prediction is complete, the GraphViz dot program will apply an automatic layout algorithm and render the graphical pathway. An example pathway is shown in Figure 4.
Figure 4.
Three-level prediction results for benzene sulfinate (see text).
UM-PPS USAGE
Because the UM-PPS, by default, runs in aerobic mode, only Very Likely, Likely and Neutral transformations appear on the predicted graphical pathway. The system predicts up to six levels in the first step, displays products containing more than three carbon atoms and stops at any level where there are more than 10 products. These default options are changeable throughout the prediction process.
To demonstrate and explain the implemented features, we analyze a predicted pathway for benzene sulfinate (C1=CC=C(C=C1)S(=O)[O–]), a compound not found in the UM-BBD, changing the default settings to show three prediction levels and all products containing at least one carbon atom.
As can be seen in Figure 4, there were a total of nine products, nine biotransformations and seven pathway branches presented in a DAG. A product is shown in a gray box, a biotransformation rule is shown as a colored arrow and a pathway branch is constructed from contiguous compounds and rules. Each compound is labeled with an ID number on its upper-left corner.
A common intermediate, catechol (compound 4 in Figure 4) had three incoming biotransformations from three parent compounds: benzene sulfonic acid (compound 2 in Figure 4) and benzene (compound 3 in Figure 4) were shown at an upper level, and phenol (compound 5 in Figure 4) was shown at the same level. Catechol also had two outgoing biotransformations pointing to three child products at a lower level. One of them was a cleavage biotransformation indicated by a two-tailed arrow, showing catechol being transformed to 2-oxopent-4-enoate (compound 7 in Figure 4) and formate (compound 8 in Figure 4).
The predicted pathway graphic is embedded in an HTML map. From the pathway prediction results page, users can view the UM-BBD compound page by clicking on a gray Cpd (compound) button, if one is present under a compound box (compounds 3–7 and 9 in Figure 4); view the KEGG database for metabolism of common compounds by clicking on a green Cpd button (compound 8 in Figure 4); and view the UM-PPS biotransformation rule page by clicking on the edge labels. Users can continue the prediction by clicking on a ‘Next’ button on the terminal compound of one pathway branch (compounds 6–9 in Figure 4). All other branches will be pruned in the next screen. We developed an online tutorial page to guide new users (http://umbbd.msi.umn.edu/predict/aboutPPS.html).
Performance
A multi-level prediction predicting many products at a time can be computationally intensive and thus requires the user to wait longer than desired for the prediction. We used a multi-thread computing method that decreased the prediction run time by 50% (1). We also used thread balancing and database caching to decrease the run time by an additional 30%. When tested using 1332 unique compounds entered by 2009 users, median run time decreased from 34 to 12 s.
Accessibility
Since early 2010, a new mirror website has been hosted by ETH Zürich (http://umbbd.ethz.ch/). The previous UM-PPS version, which does one- or two-level predictions, is presently available at that site (http://umbbd.ethz.ch/predict/).
System evaluation
The new UM-PPS version has been under development since August 2009. Before it was made available to the public in August 2010, we conducted a beta test using 12 volunteer UM-BBD users from different countries and research areas. The objective of the beta test was to explore the new system’s functionality, accessibility and stability. All items tested were rated by users on a 5-point Likert scale measurement ranging from ‘very much disagree’ (1 point) to ‘very much agree’ (5 points).
Seven beta testers completed the user survey. They agreed that the system is easy to use (4.5), the prediction layouts are easy to understand (4.5), the speed of a prediction is fast enough (4.4) and the system was responsive every time they tried it (4.0). Overall, beta testers agreed that their experience using the system was satisfying (4.3).
The lowest rated survey item was the print function (3.6). Some users complained that they had difficulties printing a large pathway graphic. To improve this function, we added a zoom feature, and the ability to produce .pdf output, that permit easier viewing and printing of prediction results.
CONCLUSIONS
The need for expert prediction of biodegradation pathways has driven the improvement of the UM-PPS visualization to depict multiple levels of prediction. Users can now view prediction alternatives much more easily. The system fully supports existing metabolic logic entities, and it can produce a multi-level prediction within an acceptable time frame. Beta testing users were satisfied by its functionality, accessibility and stability.
FUNDING
U.S. National Science Foundation (NSF0543416 to L.E. and L.W.); Minnesota Supercomputing Institute. Funding for open access charge: University of Minnesota.
Conflict of interest statement. None declared.
ACKNOWLEDGEMENTS
We thank Michael Turnbull for creating many rules and metabolic logic entities for the PPS, Dr George Karypis for providing insightful suggestions on improving the computing performance, Dr Kathrin Fenner and Mr Peter Bircher for considerable time and effort in building the mirror site and all UM-PPS beta testers for taking part in the survey.
REFERENCES
- 1.Gao J, Ellis LBM, Wackett LP. The University of Minnesota Biocatalysis/Biodegradation Database: improving public access. Nucleic Acids Res. 2009;38:D488–D491. doi: 10.1093/nar/gkp771. [DOI] [PMC free article] [PubMed] [Google Scholar]
- 2.Fenner K, Gao J, Kramer S, Ellis LBM, Wackett LP. Data-driven extraction of relative reasoning rules to limit combinatorial explosion in biodegradation pathway prediction. Bioinformatics. 2008;24:2079–2085. doi: 10.1093/bioinformatics/btn378. [DOI] [PubMed] [Google Scholar]
- 3.Ellis LBM, Gao J, Fenner K, Wackett LP. The University of Minnesota pathway prediction system: predicting metabolic logic. Nucleic Acids Res. 2008;36:W427–W432. doi: 10.1093/nar/gkn315. [DOI] [PMC free article] [PubMed] [Google Scholar]
- 4.Marchant CA, Briggs KA, Long A. In silico tools for sharing data and knowledge on toxicity and metabolism: derek for windows, meteor, and vitic. Toxicol. Mech. Methods. 2008;18:177–187. doi: 10.1080/15376510701857320. [DOI] [PubMed] [Google Scholar]
- 5.Dimitrov S, Nedelcheva D, Dimitrova N, Mekenyan O. Development of a biodegradation model for the prediction of metabolites in soil. Sci. Total Environ. 2010;408:3811–3816. doi: 10.1016/j.scitotenv.2010.02.008. [DOI] [PubMed] [Google Scholar]
- 6.Moriya Y, Shigemizu D, Hattori M, Tokimatsu T, Kotera M, Goto S, Kanehisa M. PathPred: an enzyme-catalyzed metabolic pathway prediction server. Nucleic Acids Res. 2010;38:W138–W143. doi: 10.1093/nar/gkq318. [DOI] [PMC free article] [PubMed] [Google Scholar]
- 7.Ellson J, Gansner E, Koutsofios L, North SC, Woodhull G. Graphviz – open source graph drawing tools. In: Mutzel P, Junger M, Leipert S, editors. Lecture Notes in Computer Science. Vol. 2265. Berlin, Germany: Springer; 2002. pp. 483–484. [Google Scholar]
- 8.Weininger D. SMILES: a chemical language for information systems. 1. Introduction to methodology and encoding rules. J. Chem. Inf. Comput. Sci. 1988;28:31–36. [Google Scholar]
- 9.Csizmadia F. JChem: Java applets and modules supporting chemical database handling from web browsers. J. Chem. Inf. Comput. Sci. 2000;40:323–324. doi: 10.1021/ci9902696. [DOI] [PubMed] [Google Scholar]
- 10.Kanehisa M, Goto S, Furumichi M, Tanabe M, Hirakawa M. KEGG for representation and analysis of molecular networks involving diseases and drugs. Nucleic Acids Res. 2010;38:D355–D360. doi: 10.1093/nar/gkp896. [DOI] [PMC free article] [PubMed] [Google Scholar]


