Abstract
RNA mutational analysis at the secondary-structure level can be useful to a wide-range of biological applications. It can be used to predict an optimal site for performing a nucleotide mutation at the single molecular level, as well as to analyze basic phenomena at the systems level. For the former, as more sequence modification experiments are performed that include site-directed mutagenesis to find and explore functional motifs in RNAs, a pre-processing step that helps guide in planning the experiment becomes vital. For the latter, mutations are generally accepted as a central mechanism by which evolution occurs, and mutational analysis relating to structure should gain a better understanding of system functionality and evolution. In the past several years, the program RNAmute that is structure based and relies on RNA secondary-structure prediction has been developed for assisting in RNA mutational analysis. It has been extended from single-point mutations to treat multiple-point mutations efficiently by initially calculating all suboptimal solutions, after which only the mutations that stabilize the suboptimal solutions and destabilize the optimal one are considered as candidates for being deleterious. The RNAmute web server for mutational analysis is available at http://www.cs.bgu.ac.il/~xrnamute/XRNAmute.
INTRODUCTION
The RNA molecule, once perceived as a passive carrier of genetic material from DNA, has long been shown to possess an active role that is reminiscent to proteins. Moreover, in the past several years, new discoveries have demonstrated the peculiar possibilities of an RNA molecule to control fundamental processes in living cells [reviews of some of these recent discoveries can be found in (1–3)]. Although the functional role of RNAs are often related to their 3D structure, the RNA secondary structure is experimentally accessible and in a variety of systems contains a significant amount of information to shed light on the relationship between structure and function. In general, RNA folding is thought to be hierarchical in nature (4,5), where a stable secondary structure forms first and subsequently there is a refinement to the tertiary fold. Thus, RNA secondary-structure prediction as performed in energy minimization software packages (6,7) is also important for tertiary structure prediction, let alone by itself. For example, in the recently discovered genetic control elements called riboswitches (2,3), a mechanism for bacterial gene regulation by RNAs was already observed by examining the secondary structure even before any knowledge about tertiary structure became available. On the prediction side, mutational analysis using the program implemented in our RNAmute webserver was performed on a TPP-riboswitch, and experimental results were able to verify the predictions of a deleterious and a compensatory mutation on that riboswitch (8). This type of prediction, knowing that it could be verified, may offer prospects for rational design in the future.
In general, the purpose of the RNAmute webserver is as follows. For a given biological system that involves RNA, for example, an RNA virus or a segment of an mRNA of interest or any other type of an RNA sub-sequence in the length order of 100–150 nt, there are most probably some RNA secondary-structure motifs-like unique stem–loops (9,10) that are believed to possess some kind of a functional role. Oftentimes, there is a motivation to find a mutation that may alter this functional role. A logical step toward this goal is to predict which mutations may exhibit a fold that is significantly different in its secondary structure than that of the wild-type. In principle, when no other knowledge is available on the behavior of mutations in that system and a multiple alignment is not at hand to use an approach that analyzes substitutions (11), or to perform comparative modeling (12) or to generate covariance models (13), the best that can be done and could be very useful is to predict the folding of the wild-type sequence and several mutants by energy minimization using software such as Zuker’s mfold (6) or Vienna’s RNAfold (7). For performing this type of mutational analysis in a systematic way, a basic approach that can be traced back to preliminary ideas in (14–16) and later was developed into the RNAmute program (17,18) is to order mutations in various tables according to their distance from the wild-type predicted structure. That way, the mutations with the largest distances can be singled out from the rest for further examination. Other approaches that use the same energy parameter rules (19) were also developed, notably RDMAS (20) and RNAmutants (21,22), and are reviewed in (23).
In practice, the most straight-forward application for performing mutational analysis using RNAmute is to guide biochemical experiments that directly involve the insertion of mutations, such as site-directed mutagenesis. Despite the limitations of the approach that are mentioned in the continuation, it provides a useful lead that can be checked for verification. In addition, the growing importance of SNP detection based on high-throughput sequencing may also present a need for coarse-grained mutational analysis, such as in investigating the structural behavior of synonymous SNPs. As a consequence, we have now developed the RNAmute webserver that can easily be used by practitioners with no prior knowledge and basically performs mutational analyzes based on energy minimization predictions in a user-friendly way.
THE RNAMUTE METHOD
The RNAmute program uses folding predictions by energy minimization in an efficient way to analyze neighboring mutants (e.g. single-point, two-point, three-point and more) relative to a given wild-type RNA sequence. It employs routines from the Vienna RNA package (24), including the folding prediction of suboptimal solutions. For convenience with the problem, the Vienna way of calculating the suboptimals (25) was chosen for the core of RNAmute (18), although the final output of RNAmute can be checked by either mfold (6) with its original way of calculating suboptimal solutions (26) or the Vienna RNA secondary-structure server (7) for verifying the results. This final verification step is recommended after the user has been able to find some interesting mutations by examining the output of RNAmute interactively. It should be clarified that the desired number of mutations is made in the RNA sequence, not the secondary structure, allowing the researcher to see the effects of point mutations on the overall structure of the RNA.
The way RNAmute operates is as follows. After the user supplies an input sequence and the number of mutations to be analyzed, the initial step of RNAmute is to calculate all suboptimal solutions of the input sequence using Vienna’s RNAsubopt. Next, an appropriate filtering step is applied to reduce the number of suboptimal solutions, after which only the mutations that stabilize the suboptimal solutions and destabilize the optimal one are considered. In the final step, the mutations reached from the previous step are sorted according to their distance from the wild-type predicted structure, starting from mutations that are with zero distance from the wild-type (mutations that fold into the same structure as that of the wild-type) and ending with mutations that are with large distances from the wild-type. The latter, most probably some conformational rearranging mutations, are examined by comparing between the folding prediction of the wild-type and the folding prediction of the mutants. The information for comparison is available to the user in output screens reached by single-clicks, and this visualization processing continues until the user collects all the desired candidates for deleterious mutations based on the output at hand. More features are available for the user to control which mutations are to be analyzed using the parameter values, for example the user can choose to discard the mutations that change amino acid after translation. For more details on the method employed by RNAmute, the reader is referred to (18).
RNAMUTE WEBSERVER
Input
The RNAmute webserver (http://www.cs.bgu.ac.il/~xrnamute/XRNAmute) runs on a Unix cluster with four types of computation nodes, including: IBM x3550 M3 servers with 2 Quad Core Xeon E5620 2.40 GHz SMT processors with 12M L3 cache and 24G RAM − max ppn = 16, Intel SMP server with 2 Quad Core E5335 2.00GHz processors with 4M L2 cache and 4G RAM − max ppn = 8, Intel SMP servers with 2 Dual Core Xeon 5140 2.33 GHz processors with 4M L2 cache and 4G RAM − max ppn = 4 and Pentium4 2.40 GHz processors with 512M RAM − max ppn = 1. The types of nodes are chosen by the cluster scheduler depending on free slots.
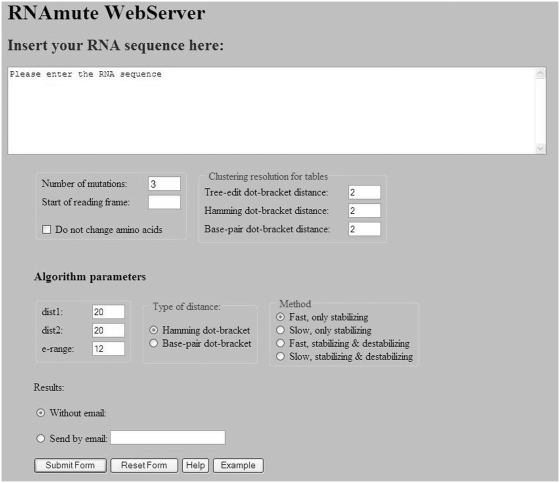
The input screen of the RNAmute webserver is shown in Figure 1 (containing default parameter values). Initially, the user provides an RNA sequence of up to 200 nt. In addition, the number of mutations should be inserted (a value of 1 corresponds to single-point mutations, a value of 2 corresponds to double-point mutations, and a value of m corresponds to m-point mutations). Next, the user can choose to select ‘Do not change amino acids’, in which case the start of reading frame should also be supplied in order for the constraint that considers the genetic code to be effective. On the right, the clustering resolution for each of the three tables should be chosen. This controls how the grouping of the mutations will appear in each table, but the exact values are less critical because they can also be updated at a later stage for a convenient examination of the corresponding tables. After selecting the above options, the algorithm parameters should be inserted. The parameters are dist1, dist2, e-range, type of distance, type of method. They are all described in detail in the Tutorial Page that is accessible by pressing ‘Help’ at the bottom of the screen, and in the methodology paper for the efficient version of RNAmute (18). In brief, their description is as follows. The user can choose between two different types of distance for filtering the suboptimal solutions: Hamming distance, or base pair distance. Hamming distance calculates the number of mismatches between the two dot-brackets being compared, whereas the base pair distance is given by the number of base pairs that have to be opened or closed to transform one structure into the other. The base pair distance has been widely used for comparing between two RNA secondary structures, and is a fine choice for being selected by the user, although there are certain situations when the Hamming distance can slightly be preferred in perhaps some special instances. For example, suppose we are comparing the following two dot-brackets:
Figure 1.
The input screen of the RNAmute webserver including default parameters. The method employed as default is the fastest available. The number of mutations is set to 3.
((((.....))))
.((((....))))
The base pair distance between these two dot-brackets is 8, whereas the Hamming distance is 2, faithfully reflecting a slight change to the overall structure if this is indeed desired. In performing mutational analysis by filtering and categorization, it was noticed that both these distance types give very similar results, and therefore picking either one is legitimate. Once the distance type is specified, numerical values should be inserted for dist1, dist2 and e-range. The two parameters dist1 and dist2 are used for filtering the suboptimal solutions that are close to the optimal and close to each other, respectively. It is recommended that their values will be ∼25% of the sequence length, and this value should be lowered if more solutions are desired. The parameter e-range is the one used in the RNAsubopt routine from the Vienna RNA package (7,24). In general, a larger e-range value will provide better results but also take a longer time to compute. Our suggestion is that e-values between 8 and 15 will be used for a sequence length of ∼100 bases. It is advisable to use lower values first and if the running time is too short, one can always increase the e-range and try another run. For the method type, we provide four different complexity modes for our algorithm: ‘Fast, only stabilizing’, ‘Slow, only stabilizing’, ‘Fast, stabilizing and destabilizing’ and ‘Slow, stabilizing and destabilizing’. We suggest using initially one of the two ‘Fast’ options that are available. The first option is the fastest and can be used for the initial trial calculation, providing a sufficient number of solutions to begin with, whereas the third option is slower but provides more solutions compared to the first, offering a refinement. Obviously, the ‘Slow’ options will consider more mutations relative to the ‘Fast’ options and they will run even slower. By default, ‘Fast, only stabilizing’ is selected. Finally, the user specifies whether the results should arrive by email, in which case the email address should be specified. Otherwise, the results will be available in an interactive job mode. When submitting the job interactively, in some cases the results may take several minutes to compute, and patience is advised while following the instructions on the screen.
Output
The results are guaranteed to be kept for at least one week after they are generated in the web link that is provided to the user. In addition to keeping the web link for later use, the user has an option to download the essence of the results as a static file containing textual information.
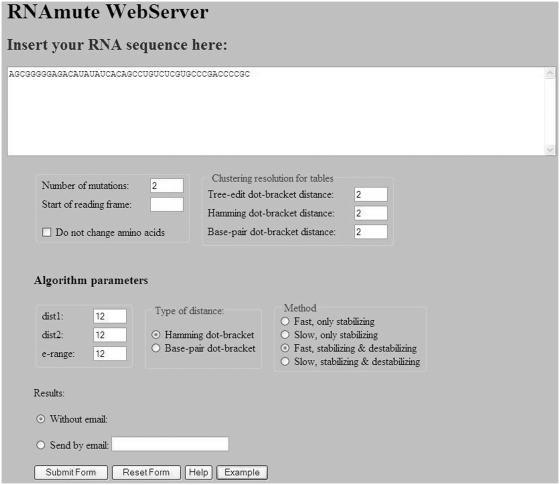
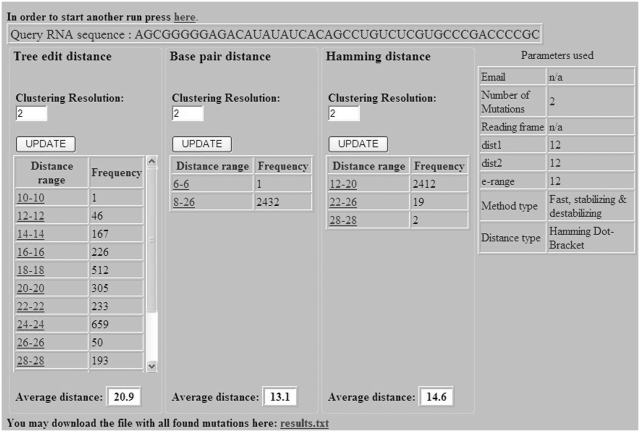
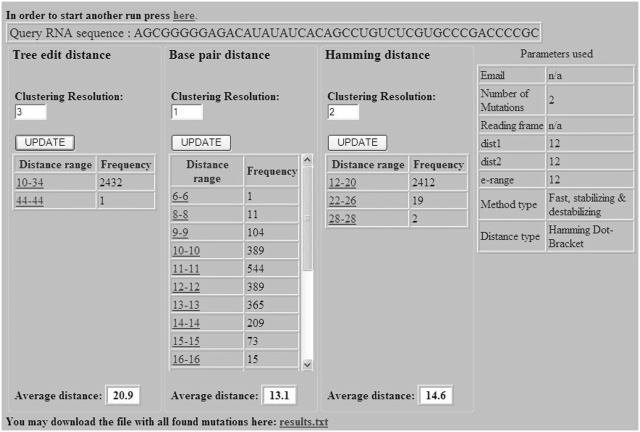
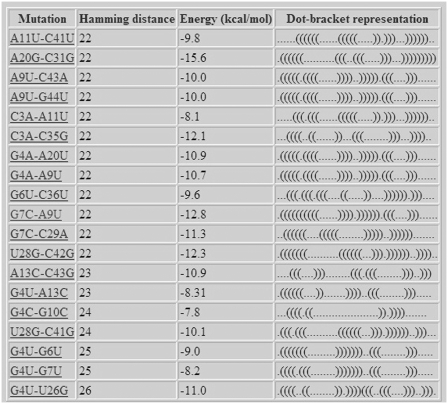
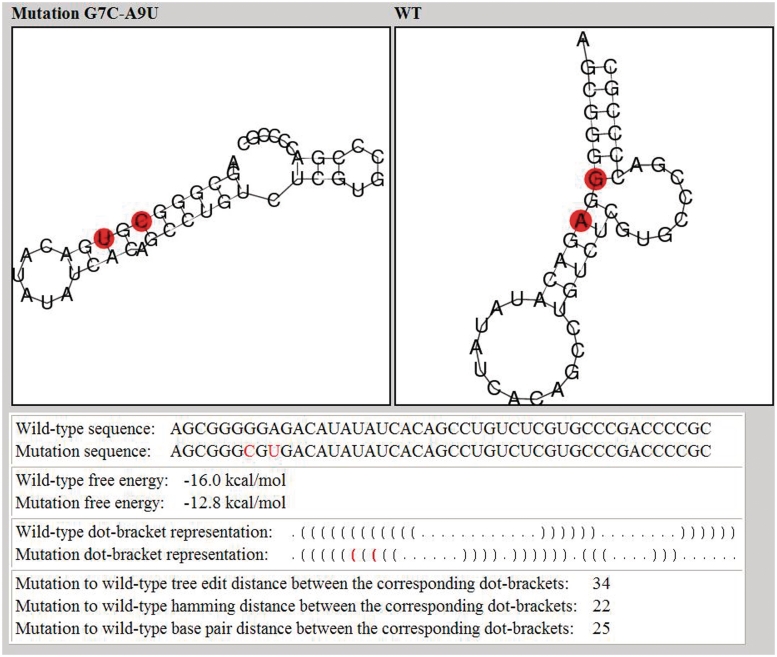
After the example parameters in the input screen of Figure 2 are inserted and the form is submitted, the preliminary results screen appearing in Figure 3 is obtained. The query RNA sequence appears at the top, and below it are three tables for ordering mutations using tree-edit distance, base pair distance and Hamming distance. It should be noted that the more expensive tree-edit distance was not considered during the stage of filtering suboptimal solutions (the choice was between base pair distance and Hamming distance), but it is being used together with the other two for sorting mutations according to their distance from the wild-type predicted structure. Each row in the tables contains some distance range and the number of mutations that are within this distance range. Clustering resolution, which is a technical feature that is used to control the amount of resolution in each table being displayed for convenience to the user, can be updated for each table separately using the ‘UPDATE’ button. Figure 4 illustrates how the changes in the tables of Figure 3 occurred as a consequence of fine tuning the clustering resolution parameter. When the clustering resolution was manually changed and updated to a value of 1 in the base pair distance table, all the mutations in the ‘8–26’ group have been re-distributed to subgroups where there is a difference of only 1 between the upper value in the distance range of a particular group and the lower value in the distance range of the next group, exclusive of the group ‘6–6’ that contains only one mutation. Next, the user can click on each distance range table entry to obtain the list of mutations belonging to that group. Figure 5 displays the mutation group list screen as a result of clicking on the ‘22–26 Hamming distance range’ entry in the Hamming distance table of Figure 4. In the mutations table appearing in Figure 5, each row in the table contains the mutation name, corresponding distance from the wild-type, mean free energy of the mutant predicted fold in units of kcal/mol, and the dot-bracket representation of the mutant predicted fold. Finally, by pressing on each mutation name, a corresponding new page appears with detailed structure and energy information for the mutation. Figure 6 shows the output screen that corresponds to mutation G7C-A9U available in Figure 5. It contains secondary-structure drawings of the wild-type and mutation that facilitates examination of the structural change. The sequences of the wild-type and mutant predicted structures, with the mutated bases in the mutated sequence and structure painted in red, appear below the secondary-structure drawings. Detailed information about the free-energies, dot-bracket representations and the various distances of the mutant predicted structure from the wild-type predicted structure are given at the bottom of the page. This way the user can scan several rearranging mutations by clicking on promising candidates that are available in Figure 5, until a desired mutation for a specific task is reached.
Figure 2.
The input screen of the RNAmute webserver with the example parameters inserted. In the example, the number of mutations is set to 2 and a more time consuming method is employed relative to the default one.
Figure 3.
The preliminary results screen of the RNAmute webserver, ordering mutations in tables according to their distances from the wild-type predicted structure.
Figure 4.
The preliminary results screen of the RNAmute webserver after fine tuning the clustering resolution parameter in some of the tables.
Figure 5.
Mutation group list screen as a result of running RNAmute for the case of two-point mutations for the example sequence.
Figure 6.
Output screen of a rearranging mutation is the example sequence as a result of running RNAmute for the case of two-point mutation and single clicking in the mutation group list screen shown in Figure 5 on the highlighted mutation G7C-A9U. The secondary-structure drawings for the wild-type and the mutants are plotted.
CONCLUSIONS
Recent discoveries of functional RNA secondary-structure motifs in a variety of non-coding RNAs and others, such as viruses, have boosted the interest in analyzing the effect of mutations on structure. They brought to an increasing number of site-directed mutagenesis experiments that affect these motifs. Whether the purpose is to study the structural properties of these functional motifs or to perform ‘smart’ modifications for rational design purposes, there is a clear motivation to develop a computational framework for the mutational analysis of RNA secondary structures. When no RNA alignments are available, only a single RNA sequence, one relies at present on thermodynamic parameters as the main framework (as was done in the development of RNAmute, RDMAS and RNAmutants, see (23) for their descriptions and comparison). Toward this end, RNA secondary-structure predictions by energy minimization are performed on RNA wild-type and mutant sequences. Thus, sequences that have been shown to fold correctly by experimental structure determination techniques to their energy minimization predicted structure are the best to work with as inputs to these programs in order to achieve reliable results. Though exceptional cases exist, in general the upper range estimate for the sequence length that these programs are useful for is ∼150 nt; therefore, the RNAmute webserver supports sequences of up to 200 nt long. For example, RNA functional motifs of up to 150 nt that form stable stem–loop structures and are taken from UTRs or ORFs of viruses may constitute favorable candidates for their analysis with the RNAmute webserver although this is by no means inclusive. The goal of the methodology behind the webserver is to process a large number of mutations efficiently. The analysis of multiple point mutations without any efficient strategy is highly expensive since the running time is O(nm) for a sequence of length n with m-point mutations. The RNAmute method that is now implemented in a webserver was developed to meet this challenge. By calculating in the initial stage all suboptimal solutions, after which only the mutations that stabilize the suboptimal solutions and destabilize the optimal one are considered as candidates for being deleterious, the method employed reduces the running time from several hours to several minutes as was described in (18). Thus, the methodology behind the webserver enables its practical use for the analysis of multiple-point mutations.
The RNAmute webserver was developed with the goal of making the efficient method for the mutational analysis of RNA secondary structures available for the entire biological community. The webserver is user-friendly and accessible to practitioners, both in terms of ease of use and simplification of the output. We believe that it will serve experimental groups for improving their capability to perform RNA mutational analysis.
FUNDING
The Lynne and William Frankel Center for Computer Sciences, Ben-Gurion University; United States–Israel Binational Science Foundation (2003291). Funding for open access charge: The Lynne and William Frankel Center for Computer Sciences, Ben-Gurion University.
Conflict of interest statement. None declared.
ACKNOWLEDGEMENTS
We thank the following dedicated project students who participated in the development of the webserver: Hila Apel, Ido Ben-Aharon, Elad Ben-David, Amit Dor, Asaf Eli and Moran Jacquel. We also thank the help of Alexander Piavka.
REFERENCES
- 1.Westhof E, Filipowicz W. From RNAi to epigenomes: how RNA rules the world. ChemBioChem. 2005;6:441–443. doi: 10.1002/cbic.200400418. [DOI] [PubMed] [Google Scholar]
- 2.Mandal M, Breaker RR. Gene regulation by riboswitches. Nat. Rev. Mol. Cell Biol. 2004;5:451–463. doi: 10.1038/nrm1403. [DOI] [PubMed] [Google Scholar]
- 3.Nudler E, Mironov AS. The riboswitch control of bacterial metabolism. Trends Biochem. Sci. 2004;29:11–17. doi: 10.1016/j.tibs.2003.11.004. [DOI] [PubMed] [Google Scholar]
- 4.Brion P, Westhof E. Hierarchy and dynamics of RNA folding. Annu. Rev. Biophys. Biomol. Struct. 1997;26:113–137. doi: 10.1146/annurev.biophys.26.1.113. [DOI] [PubMed] [Google Scholar]
- 5.Tinoco I, Bustamante C. How RNA folds. J. Mol. Biol. 1999;293:271–281. doi: 10.1006/jmbi.1999.3001. [DOI] [PubMed] [Google Scholar]
- 6.Zuker M. Mfold web server for nucleic acid folding and hybridization prediction. Nucleic Acids Res. 2003;31:3406–3415. doi: 10.1093/nar/gkg595. [DOI] [PMC free article] [PubMed] [Google Scholar]
- 7.Hofacker IL. Vienna RNA secondary structure server. Nucleic Acids Res. 2003;31:3429–3431. doi: 10.1093/nar/gkg599. [DOI] [PMC free article] [PubMed] [Google Scholar]
- 8.Barash D, Gabdank I. Energy minimization methods applied to riboswitches: a perspective and challenges. RNA Biol. 2010;7:90–97. doi: 10.4161/rna.7.1.10657. [DOI] [PubMed] [Google Scholar]
- 9.You S, Stump DD, Branch AD, Rice CM. A cis-acting replication element in the sequence encoding the NS5B RNA-dependent RNA polymerase is required for hepatitis C virus RNA replication. J. Virol. 2004;78:1352–1366. doi: 10.1128/JVI.78.3.1352-1366.2004. [DOI] [PMC free article] [PubMed] [Google Scholar]
- 10.Tang S, Collier AJ, Elliott RM. Alterations to both the primary and predicted secondary structure of stem-loop IIIc of the Hepatitis C Virus 1b 5′ untranslated region (5′ UTR) lead to mutants severely defective in translation which cannot be complemented in trans by the wild-type 5′ UTR sequence. J. Virol. 1999;73:2359–2364. doi: 10.1128/jvi.73.3.2359-2364.1999. [DOI] [PMC free article] [PubMed] [Google Scholar]
- 11.Walewski JL, Gutierrez JA, Branch-Elliman W, Stump DD, Keller TR, Rodriguez A, Benson G, Branch AD. Mutation Master: profiles of substitutions in Hepatitis C Virus RNA of the core, alternate reading frame and NS2 coding regions. RNA. 2002;8:557–571. doi: 10.1017/s1355838202029023. [DOI] [PMC free article] [PubMed] [Google Scholar]
- 12.Cannone JJ, Subramanian S, Schnare MN, Collett JR, D’ Souza LM, Du Y, Feng B, Lin N, Madabusi LV, Müller KM, et al. The Comparative RNA Web (CRW) site: an online database of comparative sequence and structure information for ribosomal, intron, and other RNAs. BMC Bioinformatics. 2002;3:2. doi: 10.1186/1471-2105-3-2. [DOI] [PMC free article] [PubMed] [Google Scholar]
- 13.Eddy SR, Durbin R. RNA sequence analysis using covariance models. Nucleic Acids Res. 1994;22:2079–2088. doi: 10.1093/nar/22.11.2079. [DOI] [PMC free article] [PubMed] [Google Scholar]
- 14.Shapiro BA. An algorithm for comparing multiple RNA secondary structures. Comput. Appl. Biosci. 1988;4:387–393. doi: 10.1093/bioinformatics/4.3.387. [DOI] [PubMed] [Google Scholar]
- 15.Le SY, Nussinov R, Maizel JV. Tree graphs of RNA secondary structures and their comparisons. Comput. Biomed. Res. 1989;22:461–473. doi: 10.1016/0010-4809(89)90039-6. [DOI] [PubMed] [Google Scholar]
- 16.Barash D. Deleterious mutation prediction in the secondary structure of RNAs. Nucleic Acid Res. 2003;31:6578–6584. doi: 10.1093/nar/gkg872. [DOI] [PMC free article] [PubMed] [Google Scholar]
- 17.Churkin A, Barash D. RNAmute: RNA secondary structure mutation analysis tool. BMC Bioinformatics. 2006;7:221. doi: 10.1186/1471-2105-7-221. [DOI] [PMC free article] [PubMed] [Google Scholar]
- 18.Churkin A, Barash D. An efficient method for the prediction of deleterious multiple-point mutations in the secondary structure of RNAs using suboptimal folding solutions. BMC Bioinformatics. 2008;9:222. doi: 10.1186/1471-2105-9-222. [DOI] [PMC free article] [PubMed] [Google Scholar]
- 19.Mathews DH, Sabina J, Zuker M, Turner H. Expanded sequence dependence of thermodynamic parameters improves prediction of RNA secondary structure. J. Mol. Biol. 1999;288:911–940. doi: 10.1006/jmbi.1999.2700. [DOI] [PubMed] [Google Scholar]
- 20.Shu W, Bo X, Liu R, Zhao D, Zheng Z, Wang S. RDMAS: a web server for RNA deleterious mutation analysis. BMC Bioinformatics. 2006;7:404. doi: 10.1186/1471-2105-7-404. [DOI] [PMC free article] [PubMed] [Google Scholar]
- 21.Waldispühl J, Devadas S, Berger B, Clote P. Efficient algorithms for probing the RNA mutation landscape. PLoS Comput. Biol. 2008;4:e1000124. doi: 10.1371/journal.pcbi.1000124. [DOI] [PMC free article] [PubMed] [Google Scholar]
- 22.Waldispühl J, Devadas S, Berger B, Clote P. RNAmutants: a web server to explore the mutational landscape of RNA secondary structures. Nucleic Acids Res. 2009;37:W281–W286. doi: 10.1093/nar/gkp477. [DOI] [PMC free article] [PubMed] [Google Scholar]
- 23.Barash D, Churkin A. Mutational analysis in RNAs: comparing programs for RNA deleterious mutation prediction. Brief. Bioinformatics. 2010;12:104–114. doi: 10.1093/bib/bbq059. [DOI] [PubMed] [Google Scholar]
- 24.Hofacker IL, Fontana W, Stadler PF, Bonhoeffer LS, Tacker M, Schuster P. Fast folding and comparison of RNA secondary structures. Monatsh. Chem. 1994;125:167–188. [Google Scholar]
- 25.Wuchty S, Fontana W, Hofacker IL, Schuster P. Complete suboptimal folding of RNA and the stability of secondary structures. Biopolymers. 1999;49:145–165. doi: 10.1002/(SICI)1097-0282(199902)49:2<145::AID-BIP4>3.0.CO;2-G. [DOI] [PubMed] [Google Scholar]
- 26.Zuker M. On finding all suboptimal folding of an RNA molecule. Science. 1989;244:48–52. doi: 10.1126/science.2468181. [DOI] [PubMed] [Google Scholar]


