


Abstract
We describe PredUs, an interactive web server for the prediction of protein–protein interfaces. Potential interfacial residues for a query protein are identified by ‘mapping’ contacts from known interfaces of the query protein’s structural neighbors to surface residues of the query. We calculate a score for each residue to be interfacial with a support vector machine. Results can be visualized in a molecular viewer and a number of interactive features allow users to tailor a prediction to a particular hypothesis. The PredUs server is available at: http://wiki.c2b2.columbia.edu/honiglab_public/index.php/Software:PredUs.
INTRODUCTION
Prediction of the potential locations at which proteins interact with other proteins is essential to understanding their function and has been successfully exploited in many applications, including identification of an approximate binding mode in protein–protein docking, as a guide in site-directed mutagenesis and in the identification of pharmacological targets. Approaches to interface prediction typically depend on the recognition of differences in the properties of amino acids (e.g. residue hydrophobicity and sequence conservation) in surface patches that interact with other molecules, as compared to other surface residues (1–6).
‘Template-based’ prediction, in which an interface for a given query protein is inferred based on some similarity to another protein or set of proteins with known interfaces has been less extensively used. This is especially true of remote similarities which may be due to the lack of data about conservation of the location of binding sites in remote neighbors. Recently, we reported a comprehensive analysis of the degree to which the location of a protein interface is conserved in sets of proteins that share varying degrees of similarities (7). Our results showed that while, in general, interface conservation is most significant among close neighbors, it is still significant even for remote structural neighbors. Based on this observation, we implemented a template-based protein interface prediction method and tested it on a docking benchmark and a set of CAPRI targets. Our method offered the best combination of prediction precision and recall among all methods tested, including PINUP (8), cons-PPISP (9) and ProMate (10), which were suggested to be the top three standalone protein interface prediction programs in a recent comparative study of six interface prediction methods (4).
Here we describe PredUs, an interactive web server using this template-based protein interface prediction method. Given a query protein structure as input, we ‘map’ interaction sites of structural neighbors involved in a complex to residues on the surface of the query. Based on the mapped contacting frequencies, we calculate a score for residues to be interfacial. In the version of our method implemented on the server we use a support vector machine (SVM) to calculate the score, which shows superior performance compared to the original score based on logistic regression (7) on the same benchmarks.
PredUs ALGORITHMS
Given a protein structure, we first find its structural neighbors using the structural alignment program Ska (11). We use a PSD [protein structure distance, a measure of structural similarity (12)] cutoff of 0.6, which allows detection of both close and remote relationships. Structures that are involved in a PQS [Protein Quaternary Structures, (13)] or PDB [Protein Data Bank, (14)] complex are kept and ranked by structural alignment score, (15), which reflects a combination of structural similarity and alignment length.
An interface from a structural neighbor is ‘mapped’ to the query by placing any interacting partners of the structural neighbor in the coordinate system of the query, using the transformation that relates the structural neighbor to the query. If a heavy atom of a query residue is within 5.0 Å of an interacting partner after the transformation, we increment a counter associated with this residue with the sequence identity between the query and the structural neighbor. This is repeated for each structural neighbor ordered according to its structural alignment score. To avoid over counting of highly similar interfaces, we cluster PQS/PDB chains using cd-hit (16) at 40% sequence identity cutoff. If two structural neighbors belong to a single cluster and their interacting partners also belong to a single cluster, only the structural neighbor with the higher structural alignment score will be considered. We sum the weighted contact frequencies at each residue of the query after interfaces of all structural neighbors have been mapped [see reference (7) for details].
In the current version of the PredUs server, we use a SVM to predict whether or not a surface residue is in an interface. The SVM is implemented with the package libsvm 3.0 (17) using radial basis function as the kernel. For each surface residue, we define a patch that includes the residue and its 14 spatially nearest surface residues. The contacting frequencies (freq) and solvent accessible surface areas (ASA) of the residues in the surface patch and the maximum contacting frequency of residues of the entire protein constitute a feature profile of length 31, i.e. [freqmax, freq0, freq1,…, freq14, ASA0, ASA1,…, ASA14]. These profiles are used as the input to the SVM and are mapped to vectors of a high-dimensional space using the kernel function. The SVM attempts to construct a hyperplane in that space that separates the vectors associated with interfacial residues from those that are non-interfacial. The interfacial score reflects the distance above (positive score) or below (negative score) this hyperplane. The higher the score the more likely a given residue is to be in an interface. By default, PredUs predicts all residues with positive score to be interfacial, but this cutoff is adjustable by the user.
PredUs FEATURES
Input to the PredUs web server can be a protein structure file in PDB format, or a PDB code. PredUs will check the validity of the input structure, and once confirmed, submit it for prediction. Users can submit multiple structures, and provide a job title or email address to facilitate retrieval of results.
As a unique feature, PredUs allows users to specify the structure of the binding partner. Once users provide another structure file or PDB code as ‘Partner Structure’, PredUs will predict the interface specifically used in the binding of the provided partner by only mapping the interfaces between structural neighbors of the query protein and structural neighbors of the partner.
A typical prediction takes a few minutes and almost all complete in no more than 30 min. The output consists of a list of residues and their associated score to be in an interface for each submitted structure which can be downloaded in text format. Individual predictions can be visualized in the molecular viewer AstexViewer (18) by following the ‘View Structure’ link. Surface residues are rendered in different colors according to their predicted interfacial score (Figure 1).
Figure 1.

PredUs prediction output. The left of the figure shows the submission details and prediction results. All residues with interfacial score higher than zero are shown with scores in parentheses following residue number (in the PDB structure file) and residue name. On the right is the submitted structure with its molecular surface rendered in colors according to residue interfacial score. Residues of score higher than zero are shown from light red to red as the score increases.
Another unique feature of PredUs is that users can tailor a prediction to a particular hypothesis following the ‘Interactive prediction’ link. Figure 2 shows structure-based sequence alignments between the query protein (on the top) and its structural neighbors on which the prediction is based. Below the alignment are tools that allow users to filter structural neighbors based on functional information including GO terms (19), or SCOP (20), PFAM (21) and InterPro (22) categories. It is well known that proteins can interact with different partners at distinct regions of their surfaces and these different interfaces can be associated with different functions (23). By default, however, PredUs will map all interfaces of structural neighbors of a query protein without regard to sequence or functional relationships. Hence default predictions are indications of all possible places where the query may interact with other proteins and may initially be overly broad. Restricting the set of structural neighbors via filters to include only close sequence neighbors, for example, or remote homologs that are associated with a specific function should in many cases produce a more accurate prediction.
Figure 2.

PredUs interactive prediction. The figure shows the structure-based sequence alignments of a query protein and its structural neighbors. Predicted interfacial residues in the query sequence are colored in red and the actual interfacial residues in the structural neighbors are indicated in purple. Functional terms populated in the set of structural neighbors are shown below the alignments. These can be used as functional filters to generate function-specific predictions by clicking the ‘Calculate Again’ button. Gaps are shown as dashes. For brevity, insertions of more than one residue with respect to the query are shown as dots.
On this page, users can also reorder the set of structural neighbors using different ranking operators shown above the alignments. Structural neighbors can be ranked based on four scores: structural alignment score, the default; PSD; RMSD (root mean square deviation, based on aligned residues) and SID (sequence identity). With the different operators, users can compare predicted interfacial residues to real interfacial residues in structural neighbors ranked by different similarity measurements.
The query protein can be further analyzed in our protein function annotation server MarkUs (24) provided by the link ‘MarkUs Annotation’. Interfaces predicted by PredUs can be examined in MarkUs and comparatively studied with other functional properties like ligand binding sites, enzymatic active sites and other residue and surface features, across a wide range of sequence and structural similarities.
PredUs BENCHMARKS
We used protein docking benchmark dataset of 188 chains in training and testing PredUs. As an independent test, we also used a set of CAPRI targets that contains 56 chains in both bound and unbound forms. Please see reference (7) for a detailed description of the datasets.
To assess the predictions, we calculated a variety of quantities:
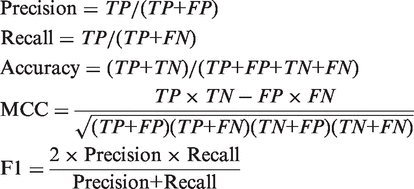 |
Here TP, FP, TN, FN are true positive, false positive, true negative, false-negative predictions; MCC is the Matthews correlation coefficient. We also drew the receiver operating characteristic (ROC) curve and calculated the area under the curve (AUC).
We used 10-fold cross validation to test PredUs on the protein docking benchmark dataset. We tested the prediction performance of the SVM in terms of AUC value using different surface patch sizes ranging from 3 to 25 and found that the best performance was achieved with a 15-residue patch. No structural and functional filters were applied in benchmarking. All quantities except AUC were calculated using an interfacial score cutoff of zero (in principle, a score higher than zero means the residue is more likely to be in an interface). These are also default settings in the PredUs server.
As shown in Table 1, PredUs can achieve a high prediction precision and recall at the same time and achieves superior performance compared to our original study (7) as a result of the use of the SVM classifier. In the current version of PredUs, we achieve a precision and recall of 50 and 58%, compared to 44 and 46% using the original scoring scheme. Here and in the following test of CAPRI targets, we only compare with the original algorithm, which had been shown to offer the best combination of precision and recall among other methods we tested, including PINUP, cons-PPISP and ProMate (7).
Table 1.
PredUs prediction performance averages on the docking benchmark dataset (DKBM3) and CAPRI bound/unbound targets
| Dataset | Precision (%) | Recall (%) | Accuracy (%) | AUC | MCC | F1 |
|---|---|---|---|---|---|---|
| 10-fold cross-validation | ||||||
| DKBM3 | 50.3 | 57.5 | 72.6 | 0.739 | 0.345 | 0.530 |
| Independent test | ||||||
| CAPRI bound | 43.0 | 53.0 | 72.1 | 0.713 | 0.290 | 0.474 |
| CAPRI unbound | 43.3 | 53.6 | 73.2 | 0.729 | 0.304 | 0.479 |
Quantities in each column are defined in the description of the PredUs benchmarks in the main text.
The SVM classifier trained on the whole docking benchmark set was applied to the CAPRI test sets. The results are summarized in Table 1 and the performance was again improved [prediction precision and recall are 43/43% and 53/54% versus 42/40% and 42/45% in the original prediction for bound/unbound targets, respectively (7)].
DISCUSSION
PredUs predicts protein interfaces by mapping binding sites from structural neighbors. In contrast to methods based on residue properties, such as hydrophobicity and conservation, an advantage of this type of direct mapping is that it allows the identification of interfacial residues that are less distinctive in terms of such properties. This can be seen from the much higher recalls of the PredUs server than other protein interface prediction methods [Table 1 and reference (7)]. This type of mapping also seems to be insensitive to conformational changes that may occur upon binding, as can be seen from the small difference between the performances of PredUs on the bound and unbound CAPRI targets (Table 1).
The choice of structural neighbors is an important issue affecting the performance of template-based approaches and it might be expected that restricting the set of structural neighbors to closely related sequence homologs may produce more biologically relevant results. We have shown previously (7) that while such a limitation improves predictive accuracy it decreases the recall at the same time. As seen in Table 2, a general trend is that the number of cases for which we can make predictions and also the prediction recall improves as more remote neighbors are include with little sacrifice in precision. Consequently, the prediction strategy implemented in PredUs is to use the widest range of structural neighbors by default, since this appears to provide the best indication of the possible binding sites on a given protein. To limit the set of structural neighbors to those that a user thinks might be more biologically relevant, they can then apply the different evolutionary, structural and functional filters or specify a binding partner, as well as directly compare actual interfacial residues in the structural neighbors to the predictions.
Table 2.
PredUs prediction performance averages when using structure neighbors from the same and different SCOP groupings on the docking benchmark dataset
| Prediction methods | Cases | Precision average (%) | Recall average (%) |
|---|---|---|---|
| PredUs(server) | 185 | 50.3 | 57.5 |
| PredUs(original) | 185 | 43.6 | 45.7 |
| Family | 141 | 50.8 | 33.8 |
| Superfamily | 147 | 45.9 | 36.2 |
| Fold | 153 | 41.8 | 38.7 |
Quantities in each column are defined in the description of the PredUs benchmarks in the main text.
A limitation of PredUs is that, for every query protein, structural neighbors in a complex are required to make predictions. By exploiting remote structural homology, however, this limitation is small with only ∼5% the proteins in our benchmark having no structural neighbors with binding partners, and this percentage should continue to decrease as more protein–protein complexes are characterized structurally.
PredUs has been set up for half a year and has been tested extensively. In an application of genome-wide modeling of protein–protein interactions, we have used it to predict interfaces for all proteins with structural information in the yeast and human proteomes.
FUNDING
National Institutes of Health [GM030518, GM094597 and CA121852]; National Natural Science Foundation of China [60873040]; Shuguang Scholar Program of Shanghai Education Development Foundation. Funding of open access charge: Howard Hughes Medical Institute.
Conflict of interest statement. None declared.
REFERENCES
- 1.Tsai CJ, Lin SL, Wolfson HJ, Nussinov R. Protein-protein interfaces: architectures and interactions in protein-protein interfaces and in protein cores. Their similarities and differences. Crit. Rev. Biochem. Mol. Biol. 1996;31:127–152. doi: 10.3109/10409239609106582. [DOI] [PubMed] [Google Scholar]
- 2.Jones S, Thornton JM. Analysis of protein-protein interaction sites using surface patches. J. Mol. Biol. 1997;272:121–132. doi: 10.1006/jmbi.1997.1234. [DOI] [PubMed] [Google Scholar]
- 3.Lo Conte L, Chothia C, Janin J. The atomic structure of protein-protein recognition sites. J. Mol. Biol. 1999;285:2177–2198. doi: 10.1006/jmbi.1998.2439. [DOI] [PubMed] [Google Scholar]
- 4.Zhou HX, Qin S. Interaction-site prediction for protein complexes: a critical assessment. Bioinformatics. 2007;23:2203–2209. doi: 10.1093/bioinformatics/btm323. [DOI] [PubMed] [Google Scholar]
- 5.de Vries SJ, Bonvin AM. How proteins get in touch: interface prediction in the study of biomolecular complexes. Curr. Protein Pept. Sci. 2008;9:394–406. doi: 10.2174/138920308785132712. [DOI] [PubMed] [Google Scholar]
- 6.Tuncbag N, Kar G, Keskin O, Gursoy A, Nussinov R. A survey of available tools and web servers for analysis of protein-protein interactions and interfaces. Brief. Bioinform. 2009;10:217–232. doi: 10.1093/bib/bbp001. [DOI] [PMC free article] [PubMed] [Google Scholar]
- 7.Zhang QC, Petrey D, Norel R, Honig BH. Protein interface conservation across structure space. Proc. Natl Acad. Sci. USA. 2010;107:10896–10901. doi: 10.1073/pnas.1005894107. [DOI] [PMC free article] [PubMed] [Google Scholar]
- 8.Liang S, Zhang C, Liu S, Zhou Y. Protein binding site prediction using an empirical scoring function. Nucleic Acids Res. 2006;34:3698–3707. doi: 10.1093/nar/gkl454. [DOI] [PMC free article] [PubMed] [Google Scholar]
- 9.Chen HL, Zhou HX. Prediction of interface residues in protein-protein complexes by a consensus neural network method: test against NMR data. Proteins. 2005;61:21–35. doi: 10.1002/prot.20514. [DOI] [PubMed] [Google Scholar]
- 10.Neuvirth H, Raz R, Schreiber G. ProMate: a structure based prediction program to identify the location of protein-protein binding sites. J. Mol. Biol. 2004;338:181–199. doi: 10.1016/j.jmb.2004.02.040. [DOI] [PubMed] [Google Scholar]
- 11.Petrey D, Honig B. GRASP2: visualization, surface properties, and electrostatics of macromolecular structures and sequences. Methods Enzymol. 2003;374:492–509. doi: 10.1016/S0076-6879(03)74021-X. [DOI] [PubMed] [Google Scholar]
- 12.Yang AS, Honig B. An integrated approach to the analysis and modeling of protein sequences and structures. I. Protein structural alignment and a quantitative measure for protein structural distance. J. Mol. Biol. 2000;301:665–678. doi: 10.1006/jmbi.2000.3973. [DOI] [PubMed] [Google Scholar]
- 13.Henrick K, Thornton JM. PQS: a protein quaternary structure file server. Trends Biochem. Sci. 1998;23:358–361. doi: 10.1016/s0968-0004(98)01253-5. [DOI] [PubMed] [Google Scholar]
- 14.Berman HM, Westbrook J, Feng Z, Gilliland G, Bhat TN, Weissig H, Shindyalov IN, Bourne PE. The Protein Data Bank. Nucleic Acids Res. 2000;28:235–242. doi: 10.1093/nar/28.1.235. [DOI] [PMC free article] [PubMed] [Google Scholar]
- 15.Kolodny R, Koehl P, Levitt M. Comprehensive evaluation of protein structure alignment methods: scoring by geometric measures. J. Mol. Biol. 2005;346:1173–1188. doi: 10.1016/j.jmb.2004.12.032. [DOI] [PMC free article] [PubMed] [Google Scholar]
- 16.Li WZ, Godzik A. Cd-hit: a fast program for clustering and comparing large sets of protein or nucleotide sequences. Bioinformatics. 2006;22:1658–1659. doi: 10.1093/bioinformatics/btl158. [DOI] [PubMed] [Google Scholar]
- 17.Chang C-C, Lin C-J. LIBSVM, a library for support vector machines. 2001 Software available at http://www.csie.ntu.edu.tw/~cjlin/libsvm. [Google Scholar]
- 18.Hartshorn MJ. AstexViewer: a visualisation aid for structure-based drug design. J. Comput. Aided Mol. Des. 2002;16:871–881. doi: 10.1023/a:1023813504011. [DOI] [PubMed] [Google Scholar]
- 19.Ashburner M, Ball CA, Blake JA, Botstein D, Butler H, Cherry JM, Davis AP, Dolinski K, Dwight SS, Eppig JT, et al. Gene ontology: tool for the unification of biology. The Gene Ontology Consortium. Nat. Genet. 2000;25:25–29. doi: 10.1038/75556. [DOI] [PMC free article] [PubMed] [Google Scholar]
- 20.Lo Conte L, Ailey B, Hubbard TJP, Brenner SE, Murzin AG, Chothia C. SCOP: a Structural Classification of Proteins database. Nucleic Acids Res. 2000;28:257–259. doi: 10.1093/nar/28.1.257. [DOI] [PMC free article] [PubMed] [Google Scholar]
- 21.Finn RD, Mistry J, Tate J, Coggill P, Heger A, Pollington JE, Gavin OL, Gunasekaran P, Ceric G, Forslund K, et al. The Pfam protein families database. Nucleic Acids Res. 2010;38:D211–222. doi: 10.1093/nar/gkp985. [DOI] [PMC free article] [PubMed] [Google Scholar]
- 22.Apweiler R, Attwood TK, Bairoch A, Bateman A, Birney E, Biswas M, Bucher P, Cerutti L, Corpet F, Croning MD, et al. The InterPro database, an integrated documentation resource for protein families, domains and functional sites. Nucleic Acids Res. 2001;29:37–40. doi: 10.1093/nar/29.1.37. [DOI] [PMC free article] [PubMed] [Google Scholar]
- 23.Keskin Z, Gursoy A, Ma B, Nussinov R. Principles of protein-protein interactions: what are the preferred ways for proteins to interact? Chem. Rev. 2008;108:1225–1244. doi: 10.1021/cr040409x. [DOI] [PubMed] [Google Scholar]
- 24.Petrey D, Fischer M, Honig B. Structural relationships among proteins with different global topologies and their implications for function annotation strategies. Proc. Natl Acad. Sci. USA. 2009;106:17377–17382. doi: 10.1073/pnas.0907971106. [DOI] [PMC free article] [PubMed] [Google Scholar]