Abstract
MicroRNAs (miRNAs) are critical regulators in the complex cellular networks. The mirAct web server (http://sysbio.ustc.edu.cn/software/mirAct) is a tool designed to investigate miRNA activity based on gene-expression data by using the negative regulation relationship between miRNAs and their target genes. mirAct supports multiple-class data and enables clustering analysis based on computationally determined miRNA activity. Here, we describe the framework of mirAct, demonstrate its performance by comparing with other similar programs and exemplify its applications using case studies.
INTRODUCTION
MicroRNAs (miRNAs) are small non-coding RNAs that can bind to the 3′ untranslated regions (UTRs) of their target genes, leading to mRNA degradation or translation repression (1). So far, several hundreds of miRNAs have been identified in plants and animals, and shown to be involved in the regulation of a broad range of biological processes. The negative relationship between miRNAs and their targets suggests that an increase in the expression levels of a miRNA's targets might imply the decrease of its regulatory effect, or vice versa (2,3). Grounded in this property, several programs, including miReduce (4), MIR (5), Sylamer (6) and DIANA-mirExTra (7), have been proposed to infer miRNA activity changes between two biological states, of which the first three are stand-alone applications and the last one is a web-based tool. These methods summarize the expression differences between two states by a (sorted) list of (logarithm) fold changes for genes and correlate gene expression alterations with enrichment of miRNA-recognized motifs in the 3′-UTRs. Here, we introduce mirAct, a web-based tool which implements a distinct method that evaluates the activity change of a miRNA by a two-step procedure: determining the miRNA activity in a sample and analyzing the collective behavior of miRNA activity in different classes of samples. Besides, mirAct extends the analysis to multiple-class data and supports clustering analysis based on the computationally determined miRNA activity.
THE mirAct WEB SERVER
The workflow of mirAct
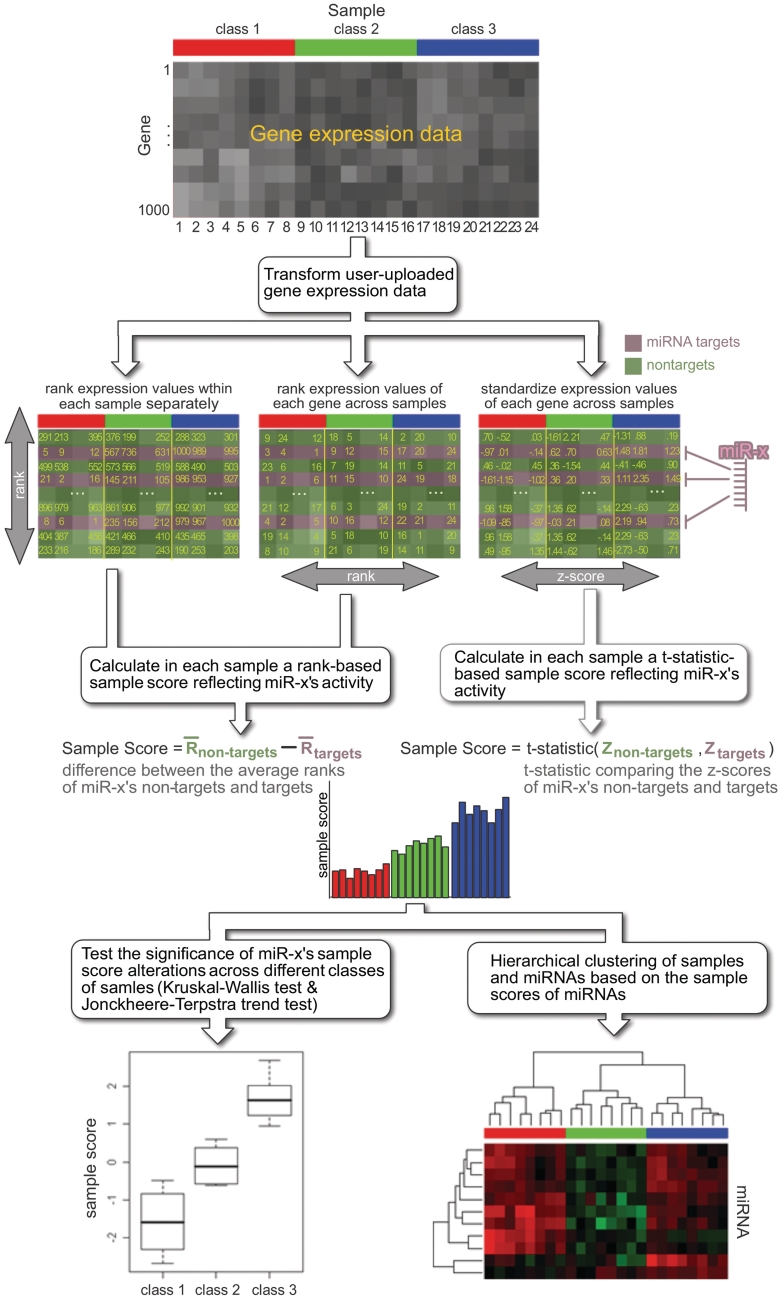
The mirAct web server implements the method proposed by Cheng et al. (8) and extends it for analyzing data with multiple classes and data with a limited number of samples. Here, we briefly describe the workflow of mirAct (Figure 1). Given the user-uploaded gene expression data, mirAct first transforms the values to ranks or Z-scores. Then, mirAct infers the regulatory effect of a miRNA via a two-step procedure. First, a sample score measuring the activity of a miRNA in a sample is obtained by comparing the expression levels of its non-targets with those of targets. In the case of rank transformation, the difference of the average ranks between a miRNA's non-targets and targets is used. In the case of Z-score representation, the two-sample t-statistic is applied. Then, the miRNA activity changes across different classes of samples are investigated by examining the sample scores via Kruskal–Wallis test (9), which tests the null hypothesis that all classes have identical miRNA activity and supports the analysis of multiple-class data. In addition, Jonckheere–Terpstra trend test (9) is implemented to allow the examination of any trend presenting in the miRNA activity, which may be useful for analyzing data with multiple stages (e.g. disease progression). Multiple comparisons are corrected using the Benjamini and Hochberg FDR method (10). It is the integration of information within a single sample and across different classes of samples makes mirAct distinct from other tools. Furthermore, based on the computationally determined miRNA sample scores, mirAct enables clustering analysis for samples and miRNAs, which facilitates the visualization and identification of miRNAs of interest.
Figure 1.
The workflow of mirAct.
Although successfully applied to miRNA activity determination, Cheng et al.'s method is not suitable for analyzing data in which each class contains a very limited number of samples (e.g. only one) (8). In this situation, Cheng et al.'s method gives poor results due to the small sample size. To resolve this problem, mirAct provides an alternative strategy, which pools together the rank/Z-score transformed expression levels of a miRNA's targets class by class, and investigates the miRNA activity change across different classes of samples by examining the pooled expression values via Kruskal–Wallis test and Jonckheere–Terpstra trend test, which inspect the equality of the average expression levels of the miRNA's targets in different classes and the existence of trend, respectively (see Example 2 below and Supplementary Figure S1). In other words, given a miRNA, for each class of samples, we collect the expression values of its targets into a set and compare the sets coming from different classes. Under the circumstances, the transformed expression levels of the miRNA targets reflect the miRNA activity directly and are reported to users instead of sample scores.
Input and output
The mirAct web server requires as input a tab-delimited file containing information of sample classification and gene expression. Besides, several necessary options need to be specified, including species, type of gene identifiers and type of miRNA target predictions. Once a task is submitted, a task ID will be returned to the user and the task status reported. Using the task ID, a user can retrieve the information of his or her task at any time. Once the computation is finished, mirAct will provide a detailed report on miRNA activity. If sample scores are available, mirAct will prompt an additional panel for clustering analysis. All the results are downloadable for further investigation.
PERFORMANCE EVALUTION
We assessed the performance of mirAct by comparing it with miReduce (4), MIR (5) and Sylamer (6). Due to the dependence on its internal database for miRNA–gene regulation relationships, the DIANA-mirExTra web server (7) was excluded from the analysis. Since no benchmarks are available, simulated data were used (see Supplementary Data; performance evaluation based on a real data set is also available in Supplementary Data). We modeled the activity change of a miRNA mi by introducing Δai (∈[0,1]). The larger the Δai, the greater the mi's activity change. Besides, to investigate the performance of the programs on noisy data, we perturbed n of the samples by an additive noise modeled as N(μn = 0, σn). For more details, please see Supplementary Data.
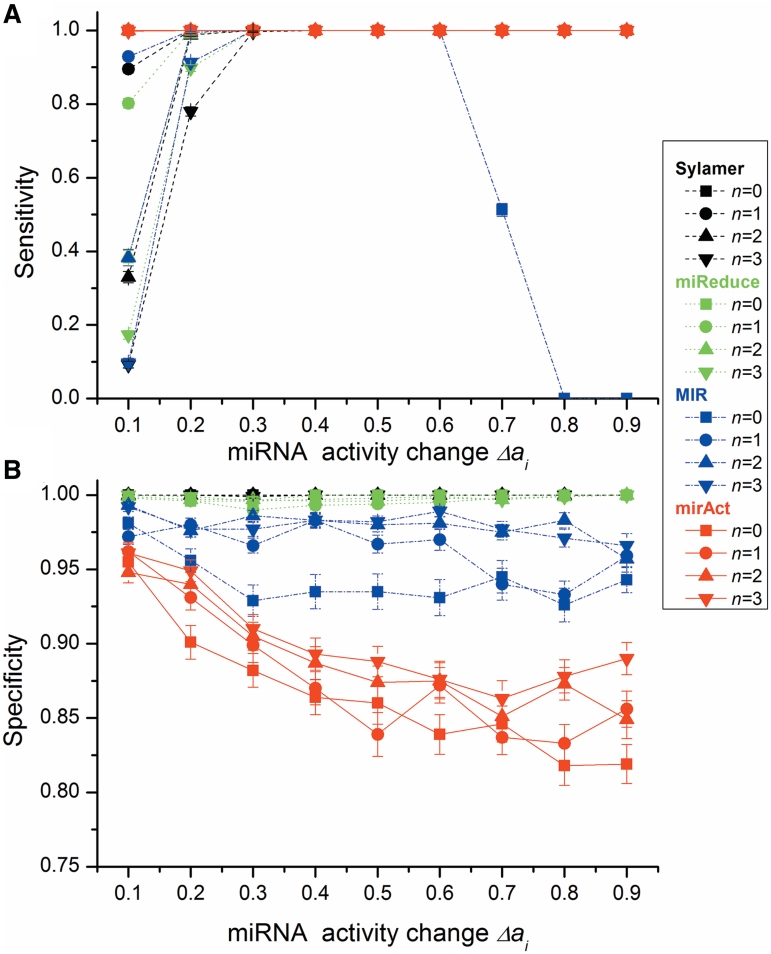
First, we investigated the performance of the programs under different extents of miRNA activity changes (Δai) and different noisy sample numbers (n) (Figure 2). In the case of sensitivity, mirAct performs as well as the other programs when there are no noisy samples, however, outperforms the others when noisy samples are present. In contrast, under the situation with noisy samples, the performance of the other programs drops sharply with the decrease of miRNA activity change. While considering specificity, the performance of mirAct is worse than the others but still keeps higher than 80%.
Figure 2.
Program performance with different extent of miRNA activity change (Δai) and different number of noisy samples (n). (A) sensitivity and (B) specificity of the tested programs (σn = 10).
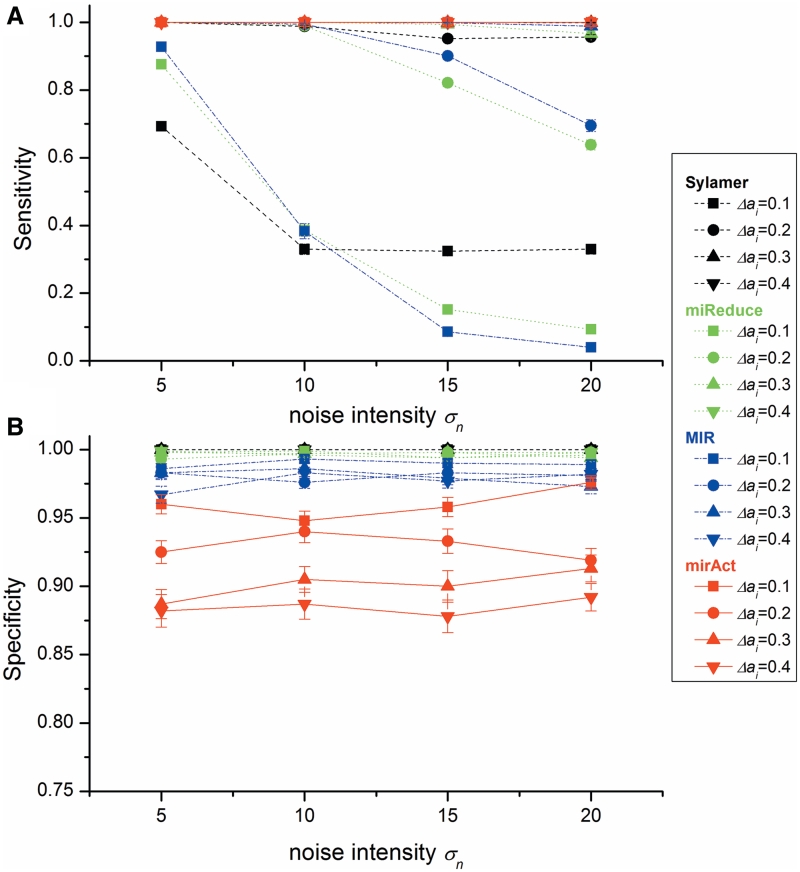
Second, we investigated the impact of noise intensity (σn) on performance. Figure 3 shows that when noise increases, mirAct outperforms the other programs by keeping a constantly high sensitivity which is not influenced by the extent of miRNA activity change. On the contrary, the sensitivity of the others decreases rapidly with the increase of noise and the decrease of miRNA activity change. However, mirAct exhibits the lowest specificity among the four, which maintains at a level of above 85%.
Figure 3.
Program performance with different noise intensity (σn) and different extent of miRNA activity change (Δai). (A) sensitivity and (B) specificity of the tested programs (n = 2).
The results suggest that mirAct is very sensitive to positives and is more robust to noise than the others. On the other hand, all the programs have high specificity, which seems immune to noise and miRNA activity change, though mirAct underperforms the others slightly. In addition, as demonstrated in Example 2 below, the alternative strategy implemented in mirAct performs better than the original method proposed by Cheng et al. (8) in the case of a limited sample size. All the above demonstrate the competitive performance of mirAct in miRNA activity inference.
APPLICATIONS
Example 1. Discovery of miRNAs involved in breast cancer via activity inference
As an example, we applied mirAct to analyze the gene expression data reported by Richardson et al. (11), in which the gene expression in pathological tissues from patients with basal-like breast cancer (BLC) and normal breast tissues were measured with Affymetrix gene chips (Affymetrix Human Genome U133 Plus 2.0). We downloaded the normalized gene expression data from Gene Expression Omnibus (GEO) (12) under the accession number GSE3744. We determined the miRNA activities using mirAct by choosing ‘TargetScan 5.0’ as the miRNA target prediction type, ‘rank across samples’ as the data transformation type and ‘sample scores’ as the miRNA activity inference method, respectively. The example can be performed by clicking the ‘Example-1’ button on the web page of mirAct.
We checked the top ten miRNAs returned by mirAct, which were sorted according to their significance of activity changes (Q-values). It was found that four miRNAs (miR-328, miR-34a, miR-128, miR-149) have already been reported to be associated with breast cancer. For example, miR-328 was demonstrated to control the expression of breast cancer resistance protein and influence drug disposition in human cancer cells (13); miR-128 was discovered to regulate stem-cell like properties of breast tumor initiating cells (14). It is expected that other miRNAs might also be involved in breast cancer and be candidates for further investigation.
Based on the activity profiles of the top 7 miRNAs with the most significant Q-values, i.e. with the most substantial activity changes, we performed a clustering analysis. As shown in Supplementary Figure S2, the samples split into two clusters, one for BLC samples and the other for normal samples, which completely coincides with their pathological classification. The result suggests that the mirAct-determined miRNA activity profiles could capture the differences between the two distinct classes of samples and be a promising predictor for sample classification.
Example 2. Identification of transfected miRNAs from gene expression data
Here, we exemplify the application of mirAct in a situation in which multiple classes of samples are present and each class has a very limited number of samples. In the miRNA transfection experiments performed by Lim et al. (2), wild-type miR-1, miR-124, their chimeras (chimiR-1-124, chimiR-124-1) and mutants (miR-124mut5-6) were transfected into Hela cells and gene expression measured. The data contains more than two classes of samples and each class has only a single expression profile. We downloaded the normalized gene expression data from GEO (GSE2075) and delivered them to mirAct for analysis by taking ‘TargetScan 5.0’ as the miRNA target prediction type, ‘rank within a sample’ as the data transformation type, and, very important, ‘transformed expression levels of miRNA targets’ as the miRNA activity computation method.
As a result, miR-124 and miR-1 were identified as the top two miRNAs with the most significant activity changes in the transfection experiment. Compared with their expression in other samples, the target genes of miR-124 exhibited a much lower average expression level in the samples transfected with miR-124 and chimiR-124-1 (Supplementary Figure S3). Similar observation was obtained for miR-1 (Supplementary Figure S4). The example can be performed by clicking the ‘Example-2’ button on the web page of mirAct.
To demonstrate the superiority of the alternative strategy to the original one proposed by Cheng et al. (8) in the case of a limited sample size, we repeated the above analysis except that the miRNA activity determination is based on ‘sample scores’. It was found that no miRNAs show significant activity change, since the sample size is too small for the original method to make an accurate and reliable statistical judgment. In contrast, the alternative strategy correctly identified the perturbed miRNAs, which thanks to its increase of power via the increase of sample size by pooling together transformed expression values of miRNA targets from the same class.
CONCLUSIONS
The mirAct web server is valuable for biologists to explore miRNA functions. First, since most biological specimens are limited and unavailable after expression profiling experiments, for instance, the samples from patients, mirAct provides a powerful method to recover the information of these samples at the miRNA level. Second, a large amount of gene expression data have been deposited at public databases, however miRNA regulation underlying the corresponding biological processes is nearly unknown. mirAct offers an effective way to investigate miRNA activity by mining these wealthy gene expression data.
SUPPLEMENTARY DATA
Supplementary Data are available at NAR Online.
FUNDING
Funding for open access charge: This work is supported by Chinese National Fundamental Research Project (Grants 2011CB910200); National Natural Science Foundation of China (30230110, 30521005, 30900270); Knowledge Innovation Program of the Chinese Academy of Sciences (KSCX1-YW-02, KSCX2-YW-R-127, INFO-115-D01-2009) China Postdoctoral Science Foundation (20070420731).
Conflict of interest statement. None declared.
REFERENCES
- 1.Bartel DP. MicroRNAs: genomics, biogenesis, mechanism, and function. Cell. 2004;116:281–297. doi: 10.1016/s0092-8674(04)00045-5. [DOI] [PubMed] [Google Scholar]
- 2.Lim LP, Lau NC, Garrett-Engele P, Grimson A, Schelter JM, Castle J, Bartel DP, Linsley PS, Johnson JM. Microarray analysis shows that some microRNAs downregulate large numbers of target mRNAs. Nature. 2005;433:769–773. doi: 10.1038/nature03315. [DOI] [PubMed] [Google Scholar]
- 3.Israel A, Sharan R, Ruppin E, Galun E. Increased microRNA activity in human cancers. PLoS One. 2009;4(6):e6045. doi: 10.1371/journal.pone.0006045. [DOI] [PMC free article] [PubMed] [Google Scholar]
- 4.Sood P, Krek A, Zavolan M, Macino G, Rajewsky N. Cell-type-specific signatures of microRNA on target mRNA expression. Proc. Natl Acad. Sci. USA. 2006;103:2746–2751. doi: 10.1073/pnas.0511045103. [DOI] [PMC free article] [PubMed] [Google Scholar]
- 5.Cheng C, Li LM. Inferring microRNA activities by combining gene expression with microRNA target prediction. PLoS ONE. 2008;3:e1989. doi: 10.1371/journal.pone.0001989. [DOI] [PMC free article] [PubMed] [Google Scholar]
- 6.van Dongen S, Abreu-Goodger C, Enright AJ. Detecting microRNA binding and siRNA off-target effects from expression data. Nature Methods. 2008;5:1023–1025. doi: 10.1038/nmeth.1267. [DOI] [PMC free article] [PubMed] [Google Scholar]
- 7.Alexiou P, Maragkakis M, Papadopoulos GL, Simmosis VA, Zhang L, Hatzigeorgiou AG. The DIANA-mirExTra web server: from gene expression data to microRNA function. PLoS One. 2010;5:e9171. doi: 10.1371/journal.pone.0009171. [DOI] [PMC free article] [PubMed] [Google Scholar]
- 8.Cheng C, Fu X, Alves P, Gerstein M. mRNA expression profiles show differential regulatory effects of microRNAs between estrogen receptor-positive and estrogen receptor-negative breast cancer. Genome Biol. 2009;10:R90. doi: 10.1186/gb-2009-10-9-r90. [DOI] [PMC free article] [PubMed] [Google Scholar]
- 9. Conover, W.J. (1998) Practical Nonparametric Statistics, 3rd ed,. John Wiley & Sons, Inc., Hoboken, NJ.
- 10.Benjamini Y, Hochberg Y. Controlling the false discovery rate: a practical and powerful approach to multiple testing. J. R. Stat. Soc. B. 1995;57:289–300. [Google Scholar]
- 11.Richardson AL, Wang ZC, De Nicolo A, Lu X, Brown M, Miron A, Liao X, Iglehart JD, Livingston DM, Ganesan S. X chromosomal abnormalities in basal-like human breast cancer. Cancer Cell. 2006;9:121–132. doi: 10.1016/j.ccr.2006.01.013. [DOI] [PubMed] [Google Scholar]
- 12.Barrett T, Suzek TO, Troup DB, Wilhite SE, Ngau WC, Ledoux P, Rudnev D, Lash AE, Fujibuchi W, Edgar R. NCBI GEO: mining millions of expression profiles–database and tools. Nucleic Acids Res. 2005;33:D562–D566. doi: 10.1093/nar/gki022. [DOI] [PMC free article] [PubMed] [Google Scholar]
- 13.Pan YZ, Morris ME, Yu AM. MicroRNA-328 negatively regulates the expression of breast cancer resistance protein (BCRP/ABCG2) in human cancer cells. Mol. Pharmacol. 2009;75:1374–1379. doi: 10.1124/mol.108.054163. [DOI] [PMC free article] [PubMed] [Google Scholar]
- 14.Yu F, Zhu Y, Gong C, Jiao Y, Song E. Mir-128 regulates the self-renewal of breast tumor-initiating cells through HTERT. Cancer Res. 2009;69:5157. [Google Scholar]


