Abstract
Small non-coding RNAs (ncRNAs) such as microRNAs, snoRNAs and tRNAs are a diverse collection of molecules with several important biological functions. Current methods for high-throughput sequencing for the first time offer the opportunity to investigate the entire ncRNAome in an essentially unbiased way. However, there is a substantial need for methods that allow a convenient analysis of these overwhelmingly large data sets. Here, we present DARIO, a free web service that allows to study short read data from small RNA-seq experiments. It provides a wide range of analysis features, including quality control, read normalization, ncRNA quantification and prediction of putative ncRNA candidates. The DARIO web site can be accessed at http://dario.bioinf.uni-leipzig.de/.
INTRODUCTION
High-throughput sequencing (HTS) using a small RNA preparation protocol (small RNA-seq) was primarily designed to measure the expression of microRNAs. Closer inspection of the resulting sequence libraries, however, revealed that many other ncRNA types are chopped into RNA molecules of microRNA-like length, and are hence detectable in the sequencing data as well (1). Some of the non-miRNA sources of short RNA sequences include tRNAs (tRNA-derived fragments) (2–4), snoRNAs (snoRNA-derived small RNAs) (5), 21U-RNAs (6) or snRNAs (1). Recently, small RNA sequencing has helped to identify new RNA species such as microRNA offset RNAs (moRs), which derive from miRNA precursors. Although they have first been described in the simple chordate Ciona intestinalis (7), they could be verified in mammalian transcriptomes (8) and have later been linked to Kaposi's sarcoma-associated Herpesvirus (9,10).
Hence, small RNA-seq data contain a plethora of processing and maturation products potentially including yet unknown RNA species. Despite this fact, many small RNA-seq data analysis tools such as miRanalyzer (11), miRDeep (12) or miRNAkey (13) focus on microRNAs—largely neglecting other types of RNAs. In addition, these programs are often restricted to specific sequencing platforms due to embedded mapping algorithms. Other tools such as deepBase do not allow the upload of own experimental data (14).
In addition to finding new RNA species, the expression levels of ncRNAs have been shown to be associated with a number of different phenotypes. Various forms of neoplastic diseases such as colorectal cancer (15), for instance, show changes in miRNA expression levels. Likewise, differential snoRNA expression has been found in a study with menigioma cells (16). RNA quantification is possible using tools such as rQuant.web (17) or RSEQTools (18); however, they are not readily applicable to small ncRNA analysis as annotation data must be collected from different sources.
We have combined a ncRNA prediction method (1,8) with tools to quantify ncRNAs in a completely platform independent and easy to use web tool. DARIO performs RNA-seq quality controls and quantifies RNA expression based on annotated ncRNAs from different ncRNA databases. The expression data and ncRNA predictions can be downloaded in the standardized BED format. We provide a script to locally convert SAM files and other mapping files to the BED format. The script is optimized to greatly reduce the amount of data that has to be uploaded to the DARIO server.
MATERIALS AND METHODS
Workflow
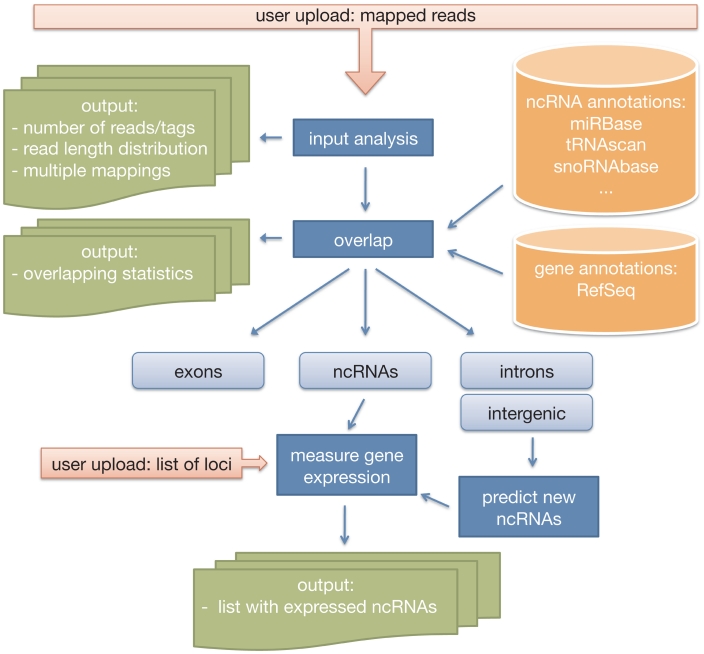
The DARIO web service requires previously mapped reads stored in compressed or uncompressed files in BAM or BED format. The uploaded file is uncompressed, if necessary, and examined for validity. A first analysis of the input data provides measures for quality control. The reads are then overlapped with various gene models of the selected species relevant for the analysis of small ncRNAs. Mapping loci overlapping with exonic regions are excluded from further analysis. Mapping loci overlapping with introns and intergenic regions are used to predict non-annotated ncRNAs. Finally, the results are summarized in HTML pages and data tables. A simplified workflow of the DARIO web service is depicted in Figure 1.
Figure 1.
Simplified workflow of a DARIO computation. After the user upload, the data are run through some quality checks with regard to read lengths distributions and multiple mappings. Subsequently, the mapping loci are overlapped with ncRNA annotation data for gene expression measuring. A random forest classifier predicts new ncRNAs. The results of the analysis are easily accessible from a summary web page.
Sequence and annotation data
Genome assemblies of six supported species were downloaded from the UCSC Genome Browser (http://hgdownload.cse.ucsc.edu/downloads.html): Homo sapiens (hg18, NCBI 36.1 and hg19, GRCh37), Macaca mulatta (rheMac2, MGSC Merged 1.0), Mus musculus (mm9, NCBI37), Danio rerio (danRer7, Zv9), Drosophila melanogaster (dm3, BDGP Release 5) and Caenorhabditis elegans (ce6, WUSTL School of Medicine GSC and Sanger Institute version WS190). For each assembly, we retrieved the UCSC Known Genes Track using the UCSC Table Browser in order to generate intron/exon lists.
ncRNA annotation was collected from several databases. While miRNA annotation was obtained from the miRBase v16 (19), most of the other ncRNA loci were downloaded from the UCSC Genome Browser. For human ncRNA data sets, we additionally included tRNA track (20), wgRNA track (21) for snoRNAs and the rnaGene track for other ncRNAs. For mouse, the tRNA track was used. For fly, our annotation encompasses the flyBaseNoncoding track from FlyBase (22). The sangerRnaGgene track containing WormBase annotations (23) is provided for Worm ncRNA data analysis. Where necessary, annotations were lifted to alternative assemblies with the UCSC tool liftover (http://hgdownload.cse.ucsc.edu/downloads.html). Additional ncRNA annotations were collected from the Mouse Genome Database (24) as well as from Ensembl/BioMart for zebrafish (25). If tRNA or snoRNA annotations were not available, we predicted candidates using tRNAscan-SE (26) or snoReport (27), respectively.
Webserver implementation
The web site and the HTML results are created by a set of Python scripts and the Mako template engine. The jobs are scheduled in a queued fashion and distributed over a set of active machines. Upon completion, the results are transferred to the web server and available under a personalized link for 4 weeks. Mapping loci are merged to blocks based on their genomic positions and assembled to regions of blocks using blockbuster v1.0 (8) with default parameters. These are then classified using the random forest method in WEKA v3.6 (1,28,29). Graphics are created using R (30) and the ggplot2 graphics package (31). RNAz Version 1.0 (32) has been used to screen all supported assemblies for potential functional RNA structures. Predicted ncRNA candidates are overlapped with these screenings to provide RNAz support.
RESULTS AND DISCUSSION
The DARIO web site provides a simple web form that allows the user to specify and upload input data. The web site currently supports seven assemblies of six species: human (hg18, hg19), rhesus monkey (rheMac2), mouse (mm9), fruit fly (dm3), worm (ce6) and zebrafish (danRer6). After file upload, a job is created and queued for computation. The user may supply an email address to be notified upon job completion. A single job typically takes between 5 and 30 min. The results are summarized on a single web page containing job details, quality control measures and figures, ncRNA quantification and classification. All results can be downloaded for further analysis.
Input format
DARIO uses mapped sequences as input. The alignments may be provided in the common BAM or BED formats (http://genome.ucsc.edu/FAQ/FAQformat.html). The BED files require the fields for sequence identifier, strand and need to provide the read count in the score field. This format allows to collapse reads occurring multiple times into unique sequence tags, dramatically reducing space requirements of sequencing data. DARIO allows upload of (g)ZIPed files.
We provide a small, no-dependency perl script to convert SAM and SOAP format files into the BED input format. Virtually, all common mapping tools (segemehl, BWA, SOAP, Bowtie, etc.) can write their output alignment to either of these formats.
Using genome loci of previously mapped reads, and thus decoupling read alignment and analysis, has a number of advantages over using raw sequence reads. First, DARIO has no dependencies to any sequencing platform or mapping tool. Thus, read data originating from any sequencing platform and aligned with any mapping program can be used. Second, this greatly reduces the required amount of data to be uploaded to the server (e.g. 1GB SAM file → 15MB compressed BED file).
Quality control
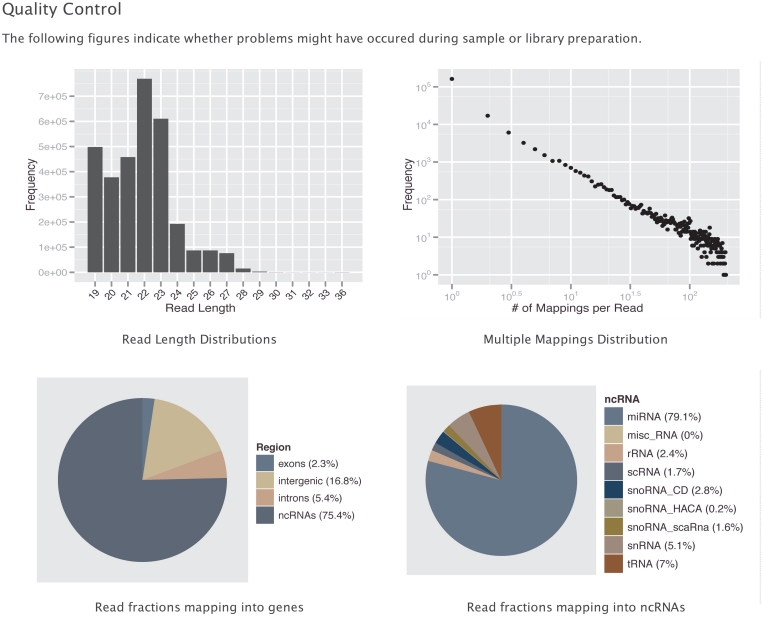
There are numerous errors and biases that can occur during sample handling, library preparation and sequencing in a small RNA-seq experiment, rendering an assessment of the experiments quality a necessity (33–35). A basic set of figures (Figure 2) gives the researcher a first impression of the quality of the experiment. This includes the read length distribution, the number and occurrence of multiple mapped reads, the fraction of reads mapping to different genomic loci (exon, intron or intergenic) and ncRNA classes (miRNA, tRNA, snoRNA, etc.). Other measures include the number of mappable reads and the number of tags.
Figure 2.
The DARIO web server provides a set of graphics for quality control. The figures show the read length distribution, the number of multiple mappings, the distribution of mapping loci across the genome and the annotated non-coding RNAs. The user may immediately check the success of his short RNA sequencing run in terms of capturing the ncRNA of interest.
RNA quantification
For expression analysis, mapping loci are overlapped with annotated ncRNAs from a variety of sources. To handle multiple mappings, the number of reads for each sequence tag is divided by the number of its mapping loci. This normalized expression value is assigned to each mapping locus. These expression values are additionally normalized based on the absolute number of mappable reads (RPM), to allow subsequent differential expression analysis. Note that these measures do not necessarily reflect precursor ncRNA abundance as RNA processing and sequencing protocol lead to a non-uniform read distribution across the precursor RNA.
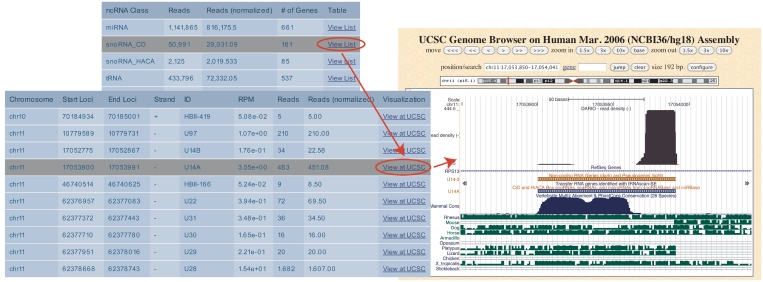
A list of expressed ncRNAs, itemized by ncRNA classes, is generated (Figure 3). The user obtains information about the normalized expression, the number of mapped reads (raw and multimap normalized), as well as a link to the UCSC genome browser for each expressed locus. The UCSC link helps the experimenter to quickly scan the data for new types of ncRNAs, e.g. microRNA-offset-RNAs (moRs) or vault RNAs, and to get a deeper understanding of the processing of these poorly understood ncRNA classes.
Figure 3.
The DARIO analysis output is partitioned into different ncRNA classes. For each ncRNA class, a list that may be sorted by location, name or expression criteria is provided. A link to the UCSC genome browser allows the instantaneous inspection of the ncRNAs, in this case a snoRNA including available ncRNA annotation tracks and conservation.
The web interface allows the upload of own annotation tracks. The specified regions are included in all downstream analysis. Predicted RNAs from previous DARIO runs can directly be used as user annotation.
Classification
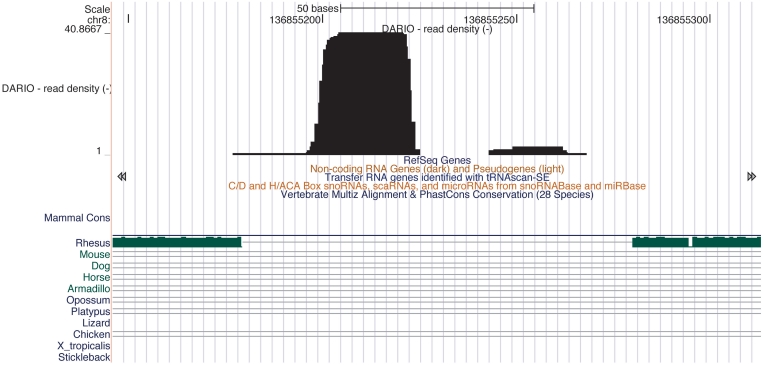
DARIO predicts new ncRNAs using a previously published machine learning approach (1). This method relies on characteristic read patterns exhibited by different classes of ncRNA. The classifier achieves positive predictive values (PPVs) and recall rates of 0.8. With recall rates varying from 0.6 to 0.7 and PPVs between 0.7 to 0.8, snoRNA predictions mark the lower bound of the classification [cf. Table 2 in (1)]. Reciever operator characteristic curves for all predicted ncRNAs in a number of species is given in the Supplementary Figure S1. For each candidate, a prediction score is given along with a RNAz classification (32), if available. One of the candidate miRNAs predicted on the human chromosome 8 using the DARIO platform is shown in Figure 4. With the links to the UCSC genome browser, it is possible to instantaneously inspect the prediction by loading multiple different annotation tracks.
Figure 4.
Example for a DARIO prediction for a miRNA. The integrated random forest classifier predicts a miRNA on the human chromosome 8 in an intergenic region. The expression pattern shows a typical miR and miR* processing product constellation. Interestingly, the UCSC browser reports neither annotations nor conservation at this position.
CONCLUSION
HTS offers wide-ranging possibilities for analyzing ncRNAs in an unprecedented way. However, deciphering the world of non-coding RNAs in HTS data requires tools that allow integrated analysis in a user-friendly way. We have developed the first integrated tool for the analysis and prediction of various small ncRNAs on user-provided RNA-seq data. The web service allows researchers to quickly grasp and assess the success of a short RNA-seq experiment. The web server overlaps the mapping loci with ncRNA genes from a number of ncRNA classes and annotation databases in order to quantify RNA abundance with different expression measures. Reads that do not map to annotated ncRNA genes are identified and classified. DARIO provides an easy to use web interface and thus greatly facilitates both initial evaluation and downstream analysis of read data originating from arbitrary sequencing platforms. Further versions of DARIO will allow to directly compare sets of small RNA transcriptomes to evaluate differences in expression levels of ncRNAs.
Availability and requirements
DARIO can be accessed freely via the web browser using the URL http://dario.bioinf.uni-leipzig.de/. There are no restrictions on use and no login requirement. It has been tested with several browsers and works with Safari, Firefox and Internet Explorer.
SUPPLEMENTARY DATA
Supplementary Data are available at NAR Online.
FUNDING
This publication is supported by LIFE - Leipzig Research Center for Civilization Diseases, Universität Leipzig. European Social Fund and the Free State of Saxony. Funding for open access charge: LIFE Center for civilization Diseases funded by the State of Saxony and the European Union.
Conflict of interest statement. None declared.
ACKNOWLEDGEMENTS
We thank Andreas Gruber for the inital web site template, Alexander Donath und Fabian Externbrink for their contribution to the backend of the web site and Christian Otto for his help with R routines.
REFERENCES
- 1.Langenberger D, Bermudez-Santana C, Stadler P, Hoffmann S. Identification and classification of small RNAs in transcriptome sequence data. Pac. Symp. Biocomput. 2010;15:80–87. doi: 10.1142/9789814295291_0010. [DOI] [PubMed] [Google Scholar]
- 2.Haussecker D, Huang Y, Lau A, Parameswaran P, Fire A, Kay M. Human tRNA-derived small RNAs in the global regulation of RNA silencing. RNA. 2010;16:673. doi: 10.1261/rna.2000810. [DOI] [PMC free article] [PubMed] [Google Scholar]
- 3.Lee Y, Shibata Y, Malhotra A, Dutta A. A novel class of small RNAs: tRNA-derived RNA fragments (tRFs) Genes Dev. 2009;23:2639. doi: 10.1101/gad.1837609. [DOI] [PMC free article] [PubMed] [Google Scholar]
- 4.Cole C, Sobala A, Lu C, Thatcher S, Bowman A, Brown J, Green P, Barton G, Hutvagner G. Filtering of deep sequencing data reveals the existence of abundant Dicer-dependent small RNAs derived from tRNAs. RNA. 2009;15:2147. doi: 10.1261/rna.1738409. [DOI] [PMC free article] [PubMed] [Google Scholar]
- 5.Taft R, Glazov E, Lassmann T, Hayashizaki Y, Carninci P, Mattick J. Small RNAs derived from snoRNAs. RNA. 2009;15:1233. doi: 10.1261/rna.1528909. [DOI] [PMC free article] [PubMed] [Google Scholar]
- 6.Ruby J, Jan C, Player C, Axtell M, Lee W, Nusbaum C, Ge H, Bartel D. Large-scale sequencing reveals 21U-RNAs and additional microRNAs and endogenous siRNAs in C. elegans. Cell. 2006;127:1193–1207. doi: 10.1016/j.cell.2006.10.040. [DOI] [PubMed] [Google Scholar]
- 7.Shi W, Hendrix D, Levine M, Haley B. A distinct class of small RNAs arises from pre-miRNA-proximal regions in a simple chordate. Nat. Struct. Mol. Biol. 2009;16:183–189. doi: 10.1038/nsmb.1536. [DOI] [PMC free article] [PubMed] [Google Scholar]
- 8.Langenberger D, Bermudez-Santana C, Hertel J, Hoffmann S, Khaitovich P, Stadler PF. Evidence for human microRNA-offset RNAs in small RNA sequencing data. Bioinformatics. 2009;25:2298–2301. doi: 10.1093/bioinformatics/btp419. [DOI] [PubMed] [Google Scholar]
- 9.Umbach JL, Cullen BR. In-depth analysis of Kaposi's sarcoma-associated herpesvirus microRNA expression provides insights into the mammalian microRNA-processing machinery. J. Virol. 2010;84:695–703. doi: 10.1128/JVI.02013-09. [DOI] [PMC free article] [PubMed] [Google Scholar]
- 10.Lin Y, Kincaid R, Arasappan D, Dowd S, Hunicke-Smith S, Sullivan C. Small RNA profiling reveals antisense transcription throughout the KSHV genome and novel small RNAs. RNA. 2010;16:1540. doi: 10.1261/rna.1967910. [DOI] [PMC free article] [PubMed] [Google Scholar]
- 11.Hackenberg M, Sturm M, Langenberger D, Falcon-Perez JM, Aransay AM. miRanalyzer: a microRNA detection and analysis tool for next-generation sequencing experiments. Nucleic Acids Res. 2009;37:68–76. doi: 10.1093/nar/gkp347. [DOI] [PMC free article] [PubMed] [Google Scholar]
- 12.Friedländer M, Chen W, Adamidi C, Maaskola J, Einspanier R, Knespel S, Rajewsky N. Discovering microRNAs from deep sequencing data using miRDeep. Nat. Biotechnol. 2008;26:407–415. doi: 10.1038/nbt1394. [DOI] [PubMed] [Google Scholar]
- 13.Ronen R, Gan I, Modai S, Sukacheov A, Dror G, Halperin E, Shomron N. miRNAkey: a software for microRNA deep sequencing analysis. Bioinformatics. 2010;26:2615–2616. doi: 10.1093/bioinformatics/btq493. [DOI] [PubMed] [Google Scholar]
- 14.Yang JH, Shao P, Zhou H, Chen YQ, Qu LH. deepBase: a database for deeply annotating and mining deep sequencing data. Nucleic Acids Res. 2010;38:D123–D130. doi: 10.1093/nar/gkp943. [DOI] [PMC free article] [PubMed] [Google Scholar]
- 15.Lanza G, Ferracin M, Gafa R, Veronese A, Spizzo R, Pichiorri F, Liu CG, Calin GA, Croce CM, Negrini M. mRNA/microRNA gene expression profile in microsatellite unstable colorectal cancer. Mol. Cancer. 2007;6:54. doi: 10.1186/1476-4598-6-54. [DOI] [PMC free article] [PubMed] [Google Scholar]
- 16.Chang LS, Lin SY, Lieu AS, Wu TL. Differential expression of human 5S snoRNA genes. Biochem. Biophys. Res. Commun. 2002;299:196–200. doi: 10.1016/s0006-291x(02)02623-2. [DOI] [PubMed] [Google Scholar]
- 17.Bohnert R, Ratsch G. rQuant.web: a tool for RNA-Seq-based transcript quantitation. Nucleic Acids Res. 2010;38:W348–W351. doi: 10.1093/nar/gkq448. [DOI] [PMC free article] [PubMed] [Google Scholar]
- 18.Habegger L, Sboner A, Gianoulis T, Rozowsky J, Agarwal A, Snyder M, Gerstein M. RSEQtools: a modular framework to analyze RNA-Seq data using compact, anonymized data summaries. Bioinformatics. 2011;27:281. doi: 10.1093/bioinformatics/btq643. [DOI] [PMC free article] [PubMed] [Google Scholar]
- 19.Griffiths-Jones S, Saini HK, van Dongen S, Enright AJ. miRBase: tools for microRNA genomics. Nucleic Acids Res. 2008;36:D154–D158. doi: 10.1093/nar/gkm952. [DOI] [PMC free article] [PubMed] [Google Scholar]
- 20.Chan PP, Lowe TM. GtRNAdb: a database of transfer RNA genes detected in genomic sequence. Nucleic Acids Res. 2009;37:D93–D97. doi: 10.1093/nar/gkn787. [DOI] [PMC free article] [PubMed] [Google Scholar]
- 21.Lestrade L, Weber MJ. snoRNA-LBME-db, a comprehensive database of human H/ACA and C/D box snoRNAs. Nucleic Acids Res. 2006;34:D158–D162. doi: 10.1093/nar/gkj002. [DOI] [PMC free article] [PubMed] [Google Scholar]
- 22.Crosby MA, Goodman JL, Strelets VB, Zhang P, Gelbart WM. FlyBase: genomes by the dozen. Nucleic Acids Res. 2007;35:D486–D491. doi: 10.1093/nar/gkl827. [DOI] [PMC free article] [PubMed] [Google Scholar]
- 23.Harris TW, Antoshechkin I, Bieri T, Blasiar D, Chan J, Chen WJ, De La Cruz N, Davis P, Duesbury M, Fang R, et al. WormBase: a comprehensive resource for nematode research. Nucleic Acids Res. 2010;38:D463–D467. doi: 10.1093/nar/gkp952. [DOI] [PMC free article] [PubMed] [Google Scholar]
- 24.Blake JA, Richardson JE, Bult CJ, Kadin JA, Eppig JT. MGD: the Mouse Genome Database. Nucleic Acids Res. 2003;31:193–195. doi: 10.1093/nar/gkg047. [DOI] [PMC free article] [PubMed] [Google Scholar]
- 25.Smedley D, Haider S, Ballester B, Holland R, London D, Thorisson G, Kasprzyk A. BioMart–biological queries made easy. BMC Genomics. 2009;10:22. doi: 10.1186/1471-2164-10-22. [DOI] [PMC free article] [PubMed] [Google Scholar]
- 26.Schattner P, Brooks AN, Lowe TM. The tRNAscan-SE, snoscan and snoGPS web servers for the detection of tRNAs and snoRNAs. Nucleic Acids Res. 2005;33:W686–W689. doi: 10.1093/nar/gki366. [DOI] [PMC free article] [PubMed] [Google Scholar]
- 27.Hertel J, Hofacker IL, Stadler PF. SnoReport: computational identification of snoRNAs with unknown targets. Bioinformatics. 2008;24:158–164. doi: 10.1093/bioinformatics/btm464. [DOI] [PubMed] [Google Scholar]
- 28.Breiman L. Random forests. Mach. Learn. 2001;45:5–32. [Google Scholar]
- 29.Hall M, Frank E, Holmes G, Pfahringer B, Reutemann P, Witten I. The WEKA data mining software: an update. SIGKDD Explorations. 2009;11:10–18. [Google Scholar]
- 30.R Development Core Team. R Found. Stat. Comput. 2008. R: a language and environment for statistical computing. Vienna, Austria, ISBN 3-900051-07-0, http://www.R-project.org. [Google Scholar]
- 31.Wickham H. ggplot2: Elegant Graphics for Data Analysis. Springer, New York Inc; 2009. [Google Scholar]
- 32.Washietl S, Hofacker I, Stadler P. Fast and reliable prediction of noncoding RNAs. Proc. Natl Acad. Sci. USA. 2005;102:2454. doi: 10.1073/pnas.0409169102. [DOI] [PMC free article] [PubMed] [Google Scholar]
- 33.Dohm JC, Lottaz C, Borodina T, Himmelbauer H. Substantial biases in ultra-short read data sets from high-throughput DNA sequencing. Nucleic Acids Res. 2008;36:e105. doi: 10.1093/nar/gkn425. [DOI] [PMC free article] [PubMed] [Google Scholar]
- 34.Linsen SE, deWit E, Janssens G, Heater S, Chapman L, Parkin RK, Fritz B, Wyman SK, deBruijn E, Voest EE, et al. Limitations and possibilities of small RNA digital gene expression profiling. Nat. Methods. 2009;6:474–476. doi: 10.1038/nmeth0709-474. [DOI] [PubMed] [Google Scholar]
- 35.Hansen KD, Brenner SE, Dudoit S. Biases in Illumina transcriptome sequencing caused by random hexamer priming. Nucleic Acids Res. 2010;38:e131. doi: 10.1093/nar/gkq224. [DOI] [PMC free article] [PubMed] [Google Scholar]


