Abstract
KINARI-Web is an interactive web server for performing rigidity analysis and visually exploring rigidity properties of proteins. It also provides tools for pre-processing the input data, such as selecting relevant chains from PDB files, adding hydrogen atoms and identifying stabilizing interactions. KINARI-Web offers a quick-start option for beginners, and highly customizable features for the experienced user. Chains, residues or atoms, as well as stabilizing constraints can be selected, removed or added, and the user can designate how different chemical interactions should be modeled during rigidity analysis. The enhanced Jmol-based visualizer allows for zooming in, highlighting or investigating different calculated rigidity properties of a molecular structure. KINARI-Web is freely available at http://kinari.cs.umass.edu.
INTRODUCTION
KINARI-Web (http://kinari.cs.umass.edu) is a streamlined and easy-to-use web server for performing rigidity and flexibility analysis of proteins. It also includes tools for curating PDB data files and options for calculating and modeling atomic interactions that contribute to a protein's mechanical stability. The rigidity-analysis engine implements (1), a variation of the pebble game algorithm of Jacobs and Hendrickson (2).
Jacobs, Thorpe and collaborators pioneered the use of rigidity-based methods in protein flexibility analysis, and demonstrated their usefulness in several applications based on their software packages MSU-FIRST (3–5), ASU-FIRST (6) and the Flexweb server (http://flexweb.asu.edu).
Rigidity analysis predicts which groups of atoms (called rigid clusters) are likely to move together in a coordinated fashion, without computing, nor giving specific motion information. Compared to molecular dynamics or normal mode analysis, it uses only simple inter-atomic connectivity and interaction information, and does not rely on energy calculations. Rigidity analysis examines a single static molecular structure and does not generate trajectories, thus making it possible to quickly examine large data sets.
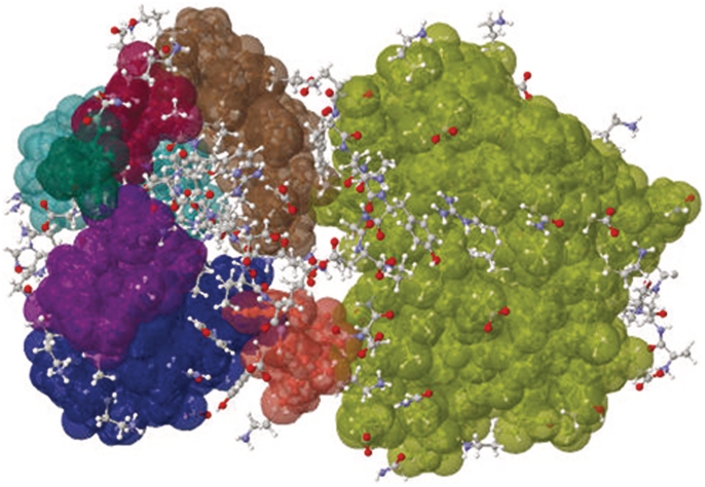
KINARI is a second generation protein rigidity analysis software, developed in Streinu's Linkage Laboratory at Smith College and the University of Massachusetts Amherst. Our goal is to provide a general, well-tested, versatile software library for rigidity analysis of molecular structures (not just proteins), which will be easy to integrate into larger applications. KINARI-Web, our first public release, enhances our command-line application with a web-based front-end. It provides options for streamlining the curation of the input protein data file, for building a molecular model that can be customized by the user, and includes an interactive visualization tool for exploring the rigidity results. A record of the performed experiments is provided in text files containing all the information needed to reproduce the results. For beginners, KINARI-Web offers a quick-start alternative, which sets curation and modeling parameters to default values. Figure 1 shows the result of the rigidity analysis performed on 2LAO, the Lysine-arginine-ornithine-binding periplasmic protein, using the default options.
Figure 1.
Rigidity analysis determines rigid clusters of atoms from static PDB data. Shown are the KINARI-Web rigidity results for 2LAO. Cluster colors, assigned at random, indicate groups of atoms which tend to move together in a coordinated fashion.
This website is free and open to all users and there is no login requirement.
METHODS
A session in KINARI-Web comprises two phases: (i) data input and curation; and (ii) rigidity analysis and visualization. During data input and curation, a PDB file is retrieved from the Protein Data Bank site or uploaded by the user, chains and atoms to be retained are selected, and chemical interactions are calculated, and can be removed, added or modified. During the second phase, modeling options are specified, rigidity analysis is performed, and results are explored with a script-enhanced Jmol-based (http://www.jmol.org) 3D visualizer.
Data input and curation
The input to KINARI-Web is a PDB-formatted file containing protein structure data; DNA and RNA data are not yet supported. Users can designate a PDB identification code, and KINARI-Web will retrieve the file from the Protein Data Bank. Alternatively, users can upload their own file. The curation feature of KINARI-Web has four steps, summarized in Table 1.
Table 1.
Curation prepares protein data for rigidity analysis
| Step | Description |
|---|---|
| 1 | Specify models, chains, ligands and water molecules to retain. |
| 2 | Remove alternate atoms and add hydrogen atoms. |
| 3 | Calculate chemical bonds and interactions. |
| 4 | Prune undesired interactions or add custom chemical constraints. |
Chains, ligands or chemical interactions can be removed or added to determine their effect on protein rigidity.
In the first curation step, KINARI-Web lists the models, chains, ligands, water molecules, etc. that are included in the uploaded PDB file, and the user selects the ones to be retained. For example, PDB file 1HVR, one of the available X-ray crystallography data files of HIV-1 Protease, contains two chains, A and B, as well as a ligand, XK2. A user analyzing 1HVR might want to retain only one of the chains (A or B), to compare the rigidity results with those for 1HHP, which is only a monomer.
X-ray crystallography PDB files do not contain hydrogen atoms, which participate in forming hydrogen bonds, critical elements in stabilizing the biomolecule. Step two of the curation process uses the Reduce software package to insert hydrogen atoms into the PDB file (7).
In the third step, important stabilizing interactions are calculated. Single and double covalent bonds, resonance bonds in peptide units, and disulfide bonds are calculated in KINARI using the identities and coordinates of the atoms, while hydrogen bonds are determined by invoking the software package HBPLUS (8). Using a method described in (9), a hydrophobic interaction is placed for every carbon–carbon, carbon–sulfur, or sulfur–sulfur pair, when their van der Waals surfaces are within a cutoff distance of 0.25 Å. Each covalent, resonance and disulfide bond is assigned an energy, in kcal/mol, that is determined from a table of average energies for each bond type and pair of atoms that are involved in the interaction. The energy of a hydrogen bond is computed using the Mayo energy function (10).
In the final curation step, the computed chemical interactions that exist between atoms in the PDB-formatted input file are presented to the user, who can designate which of them should be retained, and which should be removed. In the case of covalent, resonance, disulfide or hydrogen bonds, a user can remove constraints within a certain energy range or below/above a certain energy cutoff value. Chemical interactions that KINARI did not detect but which should be included in the molecular model of the protein, can be easily supplied as user-defined constraints. Permitting additional chemical constraints is a novel feature, not present in other web tools; this feature can be used for formulating rigidity-based hypotheses regarding their effect on the stability of the protein.
A quick-start interface, where default curation and modeling options are selected automatically, is provided for beginners and users who do not wish to use the advanced features.
Modeling proteins
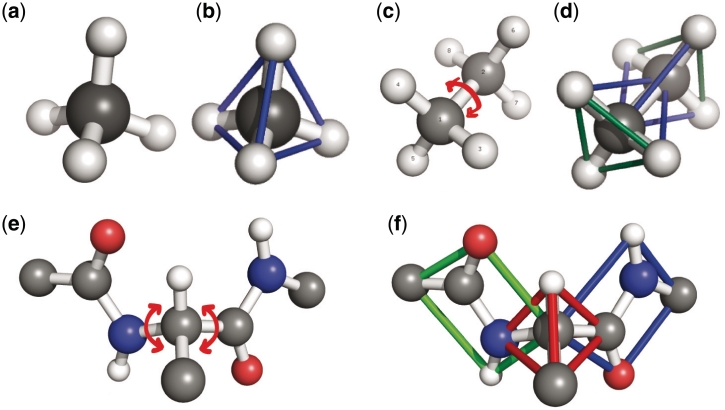
Novel to KINARI is how the mechanics of the protein are modeled. The curated set of atoms, bonds and interactions are used to build a mechanical representation of the protein, called a ‘body-bar-hinge’ framework. A body is a set of atoms rigidly attached to each other, as determined by constraints imposed through chemical bonds and stabilizing interactions. For example, the molecule in Figure 2a (methane, CH4) is rigid, because all the pair-wise distances between atoms are determined by covalent bond length and angle constraints. Abstractly, this can be visualized as the rigid tetrahedron in Figure 2b. Ethane (C2H6), shown in Figure 2c, exhibits one degree of flexibility. As in methane, each C atom together with its covalently-bonded neighbors, forms a rigid body comprising four atoms; since the C–C bond permits rotation, the molecule is flexible. Figure 2d shows the atoms of ethane clustered into two rigid bodies, forming intersecting tetrahedra, which share a rotatable bond acting as a hinge. Rotatable covalent bonds, disulfide bonds and strong hydrogen bonds are modeled, by default, as hinges. Weaker interactions can be modeled by specifying a number of bars, each one removing one degree of freedom.
Figure 2.
Methane (a) is rigid because all pair-wise distances between atoms are fixed (b). In ethane (c), a carbon atom (gray) and its bonded neighbor atoms form a rigid body. The two bodies share a hinge along the center C–C bond. The abstract body-bar-hinge framework for ethane is shown in (d); two rigid bodies (represented as tetrahedra) share a hinge (not visible). (e) The rotatable bonds in a protein's backbone; each peptide unit is rigid (f).
Rigidity analysis
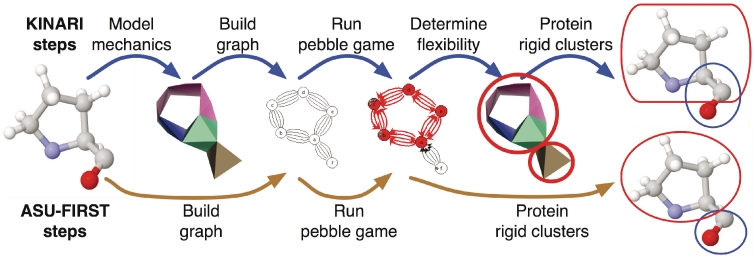
Once the modeling options have been specified, the user can run the rigidity analysis, which computes the rigid clusters within the protein, and the constraints between them. Internally, this phase proceeds in several steps, shown in Figure 3. The protein is first modeled as a body-bar-hinge framework, and then a special multi-graph is built, where each body is assigned a vertex, each hinge is assigned 5 edges, and each bar, one edge. This graph serves as input to the pebble game algorithm, which determines its components in terms of (6,6)-graph sparsity, a concept introduced in (1). The output of the pebble game is then interpreted in terms of clusters of atoms within the protein. An educational site (http://linkage.cs.umass.edu/pg/) and a video (11) introducing these mathematical concepts to a general audience are linked to from the KINARI-Web site.
Figure 3.
With KINARI, a proline molecule is modeled as a mechanical structure called a body-bar-hinge framework, from which an internal multi-graph is built. The pebble game algorithm calculates components in the multi-graph, from which the flexibility of the mechanical structure and protein rigid clusters are inferred. The ASU-FIRST software calculates the graph directly from the molecular data, and returns clusters which are disjoint sets of atoms.
Visualizing rigidity properties of biomolecules
After performing rigidity analysis, the KINARI-Web visualizer is used to explore the rigidity properties of macromolecules. The input protein is displayed along with its calculated rigid regions. By default, only the large rigid bodies are shown. The system provides a list of all the calculated clusters, from which the user can select which ones to display and which ones to hide; this makes it possible to view rigid clusters in isolation or in context. The user can zoom in to investigate specific regions, such as known active sites or domain interfaces that are functionally or structurally important. Bonds which act as hinges between rigid clusters, surfaces for each rigid cluster, specific atoms and different chemical interactions can be displayed or hidden from view. The ability to view and investigate the rigidity properties of specific small regions of a protein is a visualization feature that is not available elsewhere.
Other notable features of the visualizer include:
Select which clusters to show, filtering by size or select cluster IDs from a drop-down menu.
Hide or show atoms to help better visualize regions of interest.
Display hydrogen bonds and hydrophobic interactions.
Show all atoms in ball-and-stick or cartoon mode. Shapes of rigid clusters are shown with highlighted surfaces.
Save an orientation, that can be reverted back to.
Take a snapshot and save as a jpeg file for later use.
Full functionality of Jmol: zoom-in and out, translate protein and click on atoms to get their names and IDs.
Hinge and bar options: display all hinge axes and hinge bonds; select a particular hinge from a drop-down menu; show the two clusters of the hinge in isolation (hiding all other atoms), optionally highlight the two clusters with surfaces; apply spin. This will rotate the molecules about selected hinge axis.
Additional usages of the visualizer are demonstrated in the ‘Case study’ sections.
Output and profiling
The rigidity analysis results are provided in text files that can be downloaded and parsed. KINARI-Web keeps track of which options and features were enabled in each of the curation and modeling steps. That information is made available on a summary page that can be saved as a record of each computational experiment, so that results can be reproduced.
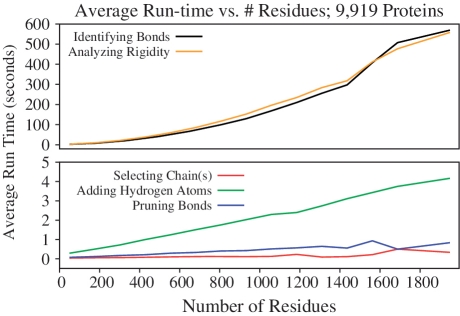
Profiling tests of the KINARI software and the KINARI-Web interface have been performed on data sets containing more than 9000 proteins. These data sets and the results are available on the KINARI-Web site. Profiling results include run-time measurements for each of the curation and the rigidity analysis phases. Figure 4 shows the average run-times for the curation steps and the rigidity analysis phase for proteins ranging from 50 residues to more than 1900.
Figure 4.
Profiling has been performed on more than 9000 proteins, ranging in size from 50 to more than 1900 residues. Average computation times for the curation and rigidity analysis steps were plotted against the number of residues in a PDB file.
RESULTS AND DISCUSSION
We illustrate the functionality of our software with three case studies. Details, including choice of curation and modeling parameters, and specific numbers produced by the rigidity analysis, can be found on the KINARI-Web site, under ‘Case studies’. First, we use the quick-start option to analyze horse heart cytochrome c, and we use the visualization tools to explore the rigidity results. Second, we investigate how adding and removing different bonds and interactions affects the rigidity of Bacteriophage T4 Lysozyme. In the third case study, we perform rigidity analysis of HIV-1 Protease with and without a ligand. Finally, we discuss how KINARI compares with the MSU-FIRST and ASU-FIRST software.
Case study 1—rigidity analysis with default options
Horse heart cytochrome c is a 104 residue heme protein associated with the inner membrane of mitochondria. The rigidity of this protein was previously investigated by (12,13). To analyze it with KINARI, we invoked the quick-start analysis option with PDB code 1HRC. The curation of the PDB file (the ligand was automatically removed) and the rigidity analysis using default options were performed in <5 s.
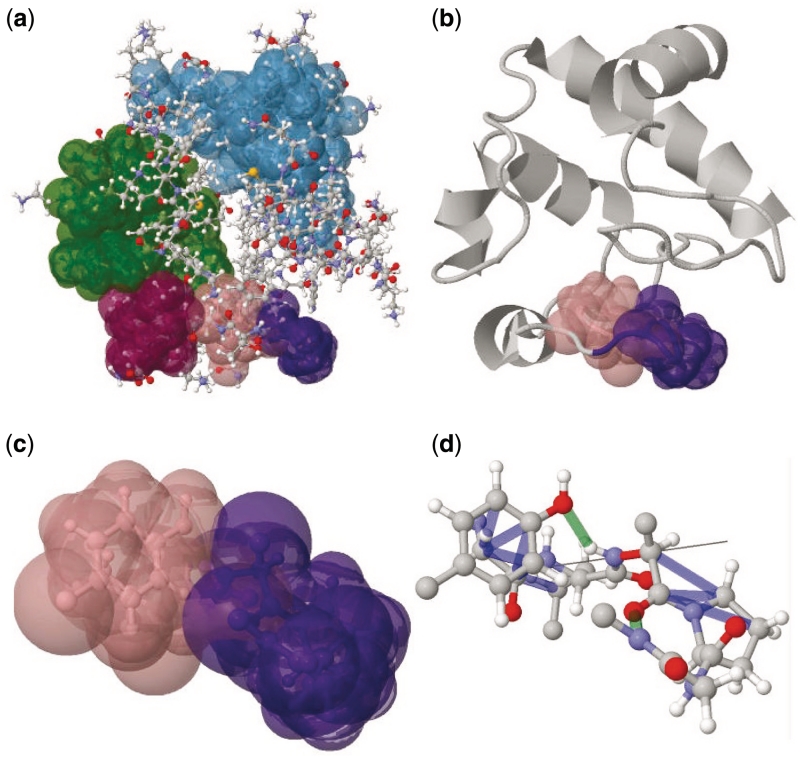
The calculated rigid regions of a protein can be easily explored in the visualizer. Figure 5a shows the ball-and-stick model rendition of 1HRC in the Jmol applet embedded in KINARI-Web. The five rigid clusters that are composed of at least 20 atoms are displayed with randomly-colored surfaces. Different visualizer features can be used to customize the parts of the protein and the set of rigid clusters displayed. Figure 5b shows the same protein, but the cartoon display option is selected, and only a subset of the clusters are highlighted.
Figure 5.
The visualizer can be used to display different rigidity features of 1HRC. The quick-start option sets default curation and modeling parameters, and displays the largest rigid clusters as highlighted surfaces in a ball-and-stick model (a). Many other visualization options are available. The same protein can be viewed as a cartoon (b), two bodies that connect at a mechanical hinge can be shown (c), while hydrogen bonds and hydrophobic interactions can be displayed in the vicinity of a mechanical hinge region (d).
The pink and purple clusters share a rotatable bond that acts as a hinge. The two clusters can be displayed in isolation, with highlighted clusters as in Figure 5c, or, as in Figure 5d, with the hinge axis, hydrogen bonds (green) and hydrophobic interactions (blue). The hydrogen bonds and hydrophobic interactions hold the two clusters rigidly together, but do not cross-link between the clusters. Visualizing the hinge up-close gives insight into the range of motion that the bond might exhibit.
Case study 2—adding and removing interactions
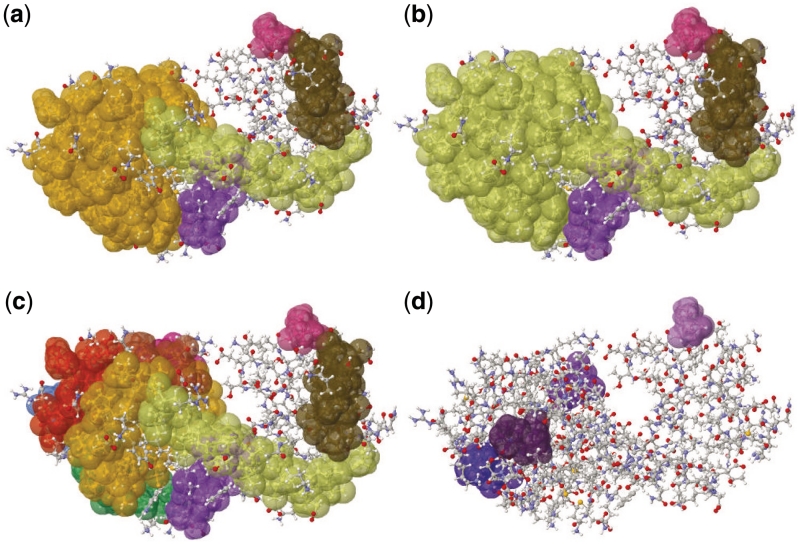
The curation phase of KINARI-Web can be used to add or remove bonds from a protein's molecular model. This can be done to determine how a single chemical constraint or which types of constraints help to maintain a protein's rigid clusters. We illustrate the curation feature on PDB file 2LZM, Bacteriophage T4 Lysozyme. Using the quick start option, KINARI-Web calculates that 2LZM has a largest rigid cluster composed of 830 atoms, shown in orange in Figure 6a.
Figure 6.
Chemical interactions can be added or removed from the molecular model, to help determine their effect on the rigidity of the protein. (a) Rigid clusters in Bacteriophage T4 Lysozyme, 2LZM, when no constraints are added or removed. (b) The effect of adding bonds between α-helices. (c and d) the largest rigid clusters when hydrophobic interactions and hydrogen bonds are excluded, respectively.
The option to add or remove constraints could be used, for instance, to probe whether the rigidity properties of a specific part of a protein would be affected by a change in the protein's amino acid sequence. Many mutation studies have been performed on Bacteriophage T4 Lysozyme to infer the role that different residues have on the stability of the protein (14). In this case study, KINARI-Web was used to add two constraints between neighboring α-helices (between residues 103 and 116, and 100 and 75), as might be introduced by mutations. The insertion of these two constraints caused previously separate regions of 2LZM to combine into a larger rigid cluster composed of 1012 atoms, shown in Figure 6b, showing that specific mutations might have a predictable effect on the protein's function. In another example, not illustrated here, Serine 235 of TEM-1 β-Lactamase was found to engage in a critical hydrogen bond (15). KINARI-Web can quickly determine the effect of such a constraint on the protein's rigidity, and could be used as a tool by biologists for designing mutation experiments.
Two extreme scenarios of rigidity analysis of 2LZM are further illustrated in Figure 6c and d with all hydrogen bonds removed, and with all hydrophobic interactions removed. This kind of inexpensive computational experiment can be used, for instance, to formulate and quickly evaluate theoretical hypotheses concerning contributions of different types of constraints to the protein's stability. A dramatic change in rigidity, quantified by the number of large clusters and their distribution, is observed.
Case study 3—effect of ligand on protein rigidity
KINARI-Web can be used to determine the effect of a ligand on the protein's rigidity. To demonstrate this feature, rigidity analysis of HIV-1 Protease PDB structure 1HVR was performed with and without an inhibitor. HIV-1 Protease has two molecular ‘flaps’ that move as the protease performs its function. When rigidity analysis is performed with the ligand present, the flaps are part of the largest rigid cluster Figure 7a. When the ligand is excised, Figure 7b, the flaps are flexible. These results are consistent with previous studies that have shown that the inclusion of a ligand greatly affects the rigidity of the flaps and protein (5).
Figure 7.
KINARI-Web can be used to determine how a ligand affects the rigidity of a protein. (a) HIV-1 Protease 1HVR analyzed with a ligand, and (b) without it. In (b), KINARI finds the protease's flaps (gray color ribbons at the top) to be flexible and not part of the largest rigid body.
Comparing KINARI-Web to other rigidity software
The first protein rigidity analysis software, MSU-FIRST, was a patented (16) command-line program based on a different underlying mechanical model (called bar-and-joint) and a heuristic pebble game algorithm for 3D bar-and-joint structures. ASU-FIRST, an extension made available through the Flexweb server, uses a different method. It identifies hydrogen bonds using its own internal function, and it implements a variant of the Mayo energy function (10) to calculate their energies. KINARI uses HBPLUS (8) for calculating the hydrogen bonds, and a slightly different variant of the Mayo energy function. Because of these differences, the set of hydrogen bonds identified by the two systems, and their ranking by energy, will exhibit slight variations. ASU-FIRST also offers three different methods to calculate hydrophobic interactions; KINARI implements only one. Novel to our system are the curation and modeling options, the intermediate mechanical modeling, and the advanced visualization capabilities, described in the ‘Methods’ section. KINARI-Web does not currently support the dilution and motion generation modules of Flexweb (17).
One of the main differences between KINARI and ASU-FIRST is accuracy in modeling. Figure 3 illustrates this on a small example. KINARI builds a mechanical model where rigid bodies of atoms overlap on rotatable bonds behaving like hinges, as shown in Figure 2. In contrast, ASU-FIRST models the protein using a special kind of multi-graph where vertices represent the atoms and each edge represents the removal of a single degree of freedom between the atoms. ASU-FIRST's rigid clusters are all disjoint and share no hinge joints. The rigid clusters identified by KINARI and ASU-FIRST are not identical, but when the same input PDB files, bonds and interactions, and modeling options are used, they will be in one-to-one correspondence. On-going work on KINARI investigates extensions that will further increase the modeling accuracy.
CONCLUSION
KINARI-Web is a suite of web tools to analyze, visualize and explore rigidity properties of proteins. Users can invoke default curation and modeling options, or customize them. The rigidity analysis relies on a novel modeling scheme, and the visualization tools enable the user to view and explore rigidity properties at different levels of detail.
FUNDING
National Science Foundation (DMS-0714934) and the Defense Advanced Research Projects Agency (HR0011-09-1-0003) grants (to I.S.). Funding for open access charge: NSF grant DMS-0714934 of I.S.
Conflict of interest statement. None declared.
ACKNOWLEDGEMENT
This software project, started in 2007, was triggered by a joint NSF grant of I.S. and Thorpe. We want to thank several individuals who helped us in the initial stages. Early discussions about ASU-FIRST, with Mike Thorpe and members of his group at the Center for Biological Physics, Arizona State University, especially Brandon Hespenheide, helped clarify how their software processed protein PDB data. Former members of I.S.’s Linkage Lab research group, Audrey Lee-St. John and Louis Theran, worked with us to identify and set up some software engineering tools that were used in the development and deployment of our web server. Diana Jaunzeikare did early testing and comparative profiling on ASU-FIRST and KINARI, which helped us identify the new curation features for the accurate processing of PDB data now present in KINARI.
REFERENCES
- 1.Lee A, Streinu I. Pebble game algorithms and sparse graphs. Discrete Mathematics. 2008;308:1425–1437. [Google Scholar]
- 2.Jacobs DJ, Hendrickson B. An algorithm for two-dimensional rigidity percolation: the pebble game. J. Comput. Phys. 1997;137:346–365. [Google Scholar]
- 3.Jacobs DJ. Generic rigidity in three-dimensional bond-bending networks. J. Phys. A-Math. Gen. 1998;31:6653–6668. [Google Scholar]
- 4.Jacobs DJ, Rader AJ, Kuhn LA, Thorpe MF. Protein flexibility predictions using graph theory. Proteins. 2001;44:150–165. doi: 10.1002/prot.1081. [DOI] [PubMed] [Google Scholar]
- 5.Thorpe MF, Lei M, Rader AJ, Jacobs DJ, Kuhn LA. Protein flexibility and dynamics using constraint theory. J. Mol. Graph. Model. 2001;19:60–69. doi: 10.1016/s1093-3263(00)00122-4. [DOI] [PubMed] [Google Scholar]
- 6.Thorpe MF, Chubynsky MV, Hespenheide BM, Menor S, Jacobs DJ, Kuhn LA, Zavodszky MI, Lei M, Rader AJ, Whiteley W. Flexibility in biomolecules. In: Barrio RA, Kasky KK, editors. Current Topics in Physics. London: Imperial College Press; 2005. ch. 6, pp. 97–112. [Google Scholar]
- 7.Word JM, Lovell SC, Richardson JS, Richardson DC. Asparagine and glutamine: using hydrogen atom contacts in the choice of side-chain amide orientation. J. Mol. Biol. 1999;285:1735–1747. doi: 10.1006/jmbi.1998.2401. [DOI] [PubMed] [Google Scholar]
- 8.McDonald IK, Thornton JM. Satisfying hydrogen bonding potential in proteins. J. Mol. Biol. 1994;238:777–793. doi: 10.1006/jmbi.1994.1334. [DOI] [PubMed] [Google Scholar]
- 9.FIRST 6.2.1 User Guide. 2009. Center for Biological Physics, Arizona State University, 2009. Available at: http://flexweb.asu.edu/ (10 June 2011, date last accessed) [Google Scholar]
- 10.Mayo SL, Dahiyat BI, Gordon DB. Automated design of the surface positions of protein helices. Protein Science. 1997;6:1333–1337. doi: 10.1002/pro.5560060622. [DOI] [PMC free article] [PubMed] [Google Scholar]
- 11.Lee A, Streinu I, Theran L. Proceedings of the 24th Symposium on Computational Geometry (SoCG'08) Maryland, USA: Association for Computing Machinery; 2008. Analyzing rigidity with pebble games. [Google Scholar]
- 12.Thorpe MF, Hespenheide BM, Yang Y, Kuhn LA. Flexibility and critical hydrogen bonds in cytochrome c. Pac. Symp. Biocomput. 2000;5:191–202. doi: 10.1142/9789814447331_0018. [DOI] [PubMed] [Google Scholar]
- 13.Rader AJ, Hespenheide BM, Kuhn LA, Thorpe MF. Protein unfolding: rigidity lost. Proc. Natl Acad. Sci. USA. 2002;99:3540–3545. doi: 10.1073/pnas.062492699. [DOI] [PMC free article] [PubMed] [Google Scholar]
- 14.Dao-pin S, Anderson DE, Baase WA, Dahlquist FW, Matthews BW. Structural and thermodynamic consequences of burying a charged residue within the hydrophobic core of T4 lysozyme. Biochemistry. 1991;31:11521–11529. doi: 10.1021/bi00113a006. [DOI] [PubMed] [Google Scholar]
- 15.Imtiaz U, Manavathu EK, Lerner SA, Mobashery S. Critical hydrogen bonding by serine 235 for cephalosporinase activity of TEM-1 β-lactamase. Antimicrob. Agents Chemother. 1999;37:2438–2442. doi: 10.1128/aac.37.11.2438. [DOI] [PMC free article] [PubMed] [Google Scholar]
- 16.Jacobs DJ, Thorpe MF. 2000. Computer-implemented system for analyzing rigidity of substructures within a macromolecule. U.S. Patent 6014449. [Google Scholar]
- 17.Hespenheide BM, Rader AJ, Thorpe MF, Kuhn LA. Identifying protein folding cores: observing the evolution of rigid and flexible regions during unfolding. J. Mol. Graph. Model. 2002;21:195–207. doi: 10.1016/s1093-3263(02)00146-8. [DOI] [PubMed] [Google Scholar]


