

Abstract
Brucella spp. are intracellular bacteria that cause an infectious disease called brucellosis in humans and many domestic and wildlife animals. B. suis primarily infects pigs and is pathogenic to humans. The macrophage-Brucella interaction is critical for the establishment of a chronic Brucella infection. Our studies showed that smooth virulent B. suis strain 1330 (S1330) prevented programmed cell death of infected macrophages and rough attenuated B. suis strain VTRS1 (a vaccine candidate) induced strong macrophage cell death. To further investigate the mechanism of VTRS1-induced macrophage cell death, microarrays were used to analyze temporal transcriptional responses of murine macrophage-like J774.A1 cells infected with S1330 or VTRS1. In total 17,685 probe sets were significantly regulated based on the effects of strain, time and their interactions. A miniTUBA dynamic Bayesian network analysis predicted that VTRS1-induced macrophage cell death was mediated by a proinflammatory gene (the tumor necrosis factor alpha [TNF-α] gene), an NF-κB pathway gene (the IκB-α gene), the caspase-2 gene, and several other genes. VTRS1 induced significantly higher levels of transcription of 40 proinflammatory genes than S1330. A Mann-Whitney U test confirmed the proinflammatory response in VTRS1-infected macrophages. Increased production of TNF-α and interleukin 1β (IL-1β) were also detected in the supernatants in VTRS1-infected macrophage cell culture. Hyperphosphorylation of IκB-α was observed in macrophages infected with VTRS1 but not S1330. The important roles of TNF-α and IκB-α in VTRS1-induced macrophage cell death were further confirmed by individual inhibition studies. VTRS1-induced macrophage cell death was significantly inhibited by a caspase-2 inhibitor but not a caspase-1 inhibitor. The role of caspase-2 in regulating the programmed cell death of VTRS1-infected macrophages was confirmed in another study using caspase-2-knockout mice. In summary, VTRS1 induces a proinflammatory, caspase-2- and NF-κB-mediated macrophage cell death. This unique cell death differs from apoptosis, which is not proinflammatory. It is also different from classical pyroptosis, which is caspase-1 mediated.
INTRODUCTION
Brucella spp. are facultative, intracellular, Gram-negative bacteria that cause a zoonotic disease called brucellosis in swine, cattle, other animals, and humans. Human brucellosis remains the most common zoonotic disease worldwide, with more than 500,000 new cases reported annually (28). B. suis is the main causative agent of brucellosis in swine and humans (28). Brucella enters and replicates efficiently in a variety of cells, including macrophages, epithelial cells, dendritic cells, and trophoblasts (34). Interaction between Brucella and macrophages is critical for the establishment of a chronic infection. The virulence of Brucella relies on its ability to survive and replicate in the vacuolar compartments of macrophages (18). In contrast, many rough derivatives of B. suis, B. abortus, and B. melitensis, which are deficient in the O antigen (or O side chain) associated with lipopolysaccharide (LPS), cannot survive inside macrophages and hence are attenuated (11, 33).
While smooth virulent Brucella strains inhibit programmed macrophage cell death (17, 18), many rough Brucella strains are cytotoxic to macrophages and induce macrophage cell death (7, 11, 14, 30, 32). Freeman et al. first reported that rough Brucella induced cytopathic cell death (14). Different types of cell death induced by rough Brucella were also described in the past decade. Fernandez-Prada et al. demonstrated that a mutant rough B. melitensis strain, WRR51, induced apoptosis in human monocytes (11). Pei et al. reported that rough B. abortus mutants induced necrosis (30) and oncosis (32) of infected macrophages. We recently showed that rough B. abortus strains RA1 and RB51 induced caspase-2-mediated, caspase-1-independent apoptosis and necrosis of macrophages (7).
A proinflammatory response occurs frequently in pathogen-induced programmed cell death. Pyroptosis is a caspase-1-mediated proinflammatory cell death. Pyroptosis can be induced by several bacterial pathogens, including Salmonella typhimurium, Shigella flexneri, and Legionella pneumophila (5). Necrosis is also often inflammatory and considered a common end of many types of cell death (e.g., oncosis) (13). Proinflammatory responses in Brucella-infected host cells were also studied (2, 6, 9, 18, 27). For example, microarray studies revealed that the transcriptional levels of many proinflammatory genes were upregulated in murine macrophages infected with smooth B. abortus strain 2308 (9) or smooth B. melitensis strain 16M at 4 h postinfection (18). However, in these cases, many other proinflammatory genes were also downregulated. In B. abortus strain 2308-infected trophoblastic cells (6), proinflammatory responses were also suppressed at the early stage of infection and followed by a delayed and mild expression of proinflammatory chemokines (6). In general, smooth virulent Brucella behaves as a furtive pathogen that circumvents killing via a dramatically subdued proinflammatory response (2).
A Bayesian network (BN) is a probabilistic graphical model that represents a set of random variables and their conditional independences via a directed acyclic graph. BN analysis is a powerful approach for identifying causal or apparently causal patterns in gene expression data (15). A Bayesian network can model linear, nonlinear, combinatorial, stochastic, and other types of relationships among variables across multiple levels of biological organizations (40). Capturing such relationships by using standard bioinformatics tools (e.g., clustering) is difficult. BN algorithms are also capable of handling noisy data found in biological experiments and easily incorporating prior knowledge during modeling to enhance the predictive power of the model. These properties make it possible to infer causal effects that would otherwise be undetectable if only microarray data or other small sets of experimental data are available. Recently, this laboratory has developed miniTUBA (39), a program that provides a generic Web-version tool to allow clinical and biomedical researchers to perform dynamic Bayesian network (DBN) analysis using temporal data sets.
We hypothesized that the mechanism of rough Brucella-induced macrophage cell death would be more specifically identified by systemic microarray analysis and experimental verification. In this report, we applied Affymetrix microarrays and miniTUBA DBN analysis to investigate molecular factors that regulate programmed macrophage cell death induced by rough attenuated B. suis strain VTRS1 but not by smooth virulent B. suis strain 1330 (S1330) (38). Our initial DBN microarray data modeling suggests that proinflammatory tumor necrosis factor alpha (TNF-α), caspase-2, and NF-κB genes among many other genes play critical roles in VTRS1-induced macrophage cell death. A further analysis indicated that proinflammatory genes were dramatically upregulated during infection with the VTRS1 vaccine candidate strain. A Mann-Whitney U test was used to support the concept that proinflammatory genes are regulated in the microarray significantly more frequently than by chance. The predicted roles of TNF-α, caspase-2, and NF-κB in regulating the cell death were further verified experimentally. The unique caspase-2-mediated proinflammatory cell death induced by VTRS1 differs from classical apoptosis and pyroptosis.
MATERIALS AND METHODS
Brucella strains and macrophages.
B. suis strains S1330 and VTRS1 were from Gerhardt Schurig's laboratory at the Virginia Polytechnic Institute and State University (Virginia Tech). VTRS1 is a mutant of B. Suis 2579 with wboA interrupted by a Tn5 kanamycin resistance gene. VTRS1 is a B. suis vaccine candidate that induces protection against a smooth virulent Brucella challenge in mice (38). Both strains were grown either in tryptic soy broth (TSB) or on tryptic soy agar (TSA) plates. The J774.A1 macrophage cell line (ATCC, Manassas, VA) was cultured at 37°C with 5% CO2 in complete tissue culture medium (c-DMEM) consisting of Dulbecco's modified Eagle's medium (DMEM) supplemented with 10% heat-inactivated fetal bovine serum (Invitrogen). Bone marrow-derived macrophages (BMDM) were collected from C57 mice and caspase-2-deficient C57 mice (a gift from Junying Yuan at Harvard University [4]) and kept in RPMI 1640 medium (Invitrogen) with 10% heat-inactivated fetal bovine serum and 15% L cell medium.
Macrophage infection and survival assays.
J774.A1 macrophages or BMDM were seeded in 24-well plates at a concentration of 2.5 × 10⁵ per well and incubated overnight. The macrophages were infected with S1330 or VTRS1 in triplicate at a multiplicity of infection (MOI) of 20, 200, or 2,000. The plates were centrifuged for 5 min at 300 × g and then incubated at 37°C for 1 h. For caspase inhibition studies, a caspase inhibitor sample pack (R&D Systems Inc., Minneapolis, MN) was used. The kit contains a pancaspase inhibitor (Z-VAD-FMK) and nine specific caspase inhibitors for inhibition of caspase-1 (Z-WEHD-FMK), caspase-2 (Z-VDVAD-FMK), caspase-3 (Z-DEVD-FMK), caspase-4 (Z-YVAD-FMK), caspase-6 (Z-VEID-FMK), caspase-8 (Z-IETD-FMK), caspase-9 (Z-LEHD-FMK), caspase-10 (Z-AEVD-FMK), and caspase-13 (Z-LEED-FMK). Each caspase inhibitor (20 μM) was used to pretreat J774.A1 macrophages or BMDM at 1 h prior to Brucella infection and was maintained through the entire experiment. For the NF-κB study, a specific IκB-α phosphorylation inhibitor (Bay 11-8071; 8 μM) (Sigma) was added to the J774.A1 macrophage culture medium 30 min prior to infection and was maintained during the infection (1 h). For the TNF-α pathway study, macrophages were incubated with monoclonal anti-TNF-α antibody (Biovision) at 20 μg/ml for 30 min prior to infection and through the entire experiment. The cells were then washed three times with Dulbecco's phosphate-buffered saline and treated with 50 μg/ml gentamicin to kill extracellular Brucella. Infected macrophages were then lysed with 0.1% Triton X-100 in phosphate-buffered saline (PBS) at 1, 2, 4, 8, 24, and 48 h postinfection. The viable CFU were determined using a standard protocol after plating a series of 1:10 dilutions of the lysed cells on TSA plates.
Determination of Brucella-induced cytopathic cell death.
Macrophages cultured in 24-well plates were infected with S1330 or VTRS1 in triplicate wells as described above. The culture supernatants were collected at 0, 1, 2, 4, 8, 24, and 48 h, respectively, and were stored at −20°C. The lactate dehydrogenase (LDH) released to the culture medium was determined using a CytoTox 96 nonradioactive cytotoxicity assay kit (Promega, Madison, WI). Brucella-induced macrophage cell death was further analyzed by using an annexin V-FLUOS staining kit (Roche Diagnostics Corporation, Indianapolis, IN). The images were documented with an RT Slide Spot digital camera and analyzed with Qcapture Pro software (QImaging, Canada). Annexin V- and/or propidium iodide (PI)-positive cells were counted in representative fields containing at least 200 live or dead cells. Gliotoxin (Sigma-Aldrich Chemical, St. Louis, MO)-treated (0.1 μM) cells were employed as a positive control for apoptotic cell death, and t-butyl-hydroperoxide (TBH) (Sigma-Aldrich Chemical, St. Louis, MO)-treated (100 μM) cells were used as a positive control for necrotic cell death.
Total RNA isolation.
J774.A1 macrophages were plated in T75 cell culture flasks at 8 × 10⁶ cells per flask 1 day prior to infection and then infected with B. suis S1330 or VTRS1 at an MOI of 200. Total RNAs were isolated by TRIzol and further purified by using the RNeasy minikit (Qiagen, Valencia, CA) at 0, 1, 2, 4, 8, 24, and 48 h postinfection. The RNA samples were stored at −80°C until an Agilent 2100 bioanalyzer (Agilent Technologies, Palo Alto, CA) was used to assess the concentrations and quality of RNA samples.
Microarray experiment and data analysis.
Total RNA (20 μg) per sample was used for hybridization with the Affymetrix mouse GeneChip 430 2.0 array at the Core Laboratory Facility at the Virginia Bioinformatics Institute (VBI). Preparation of cDNA, hybridization, quality controls, and scanning of the GeneChip 430 2.0 arrays were performed according to the manufacturer's protocol (Affymetrix, Santa Clara, CA) (18). For the probe sets that passed the present/absent filtering criterion, robust multiarray (RMA) normalization was performed (21). LIMMA (linear models for microarray data) was used to analyze up- or downregulated genes (37).
After fitting the LIMMA models, we applied an empirical Bayes smoothing method (R function eBayes) on the estimated parameters and their standard errors to get the moderated F statistics. Then, the moderated F statistics were used to determine any effects of strain, time, or possible interaction between strain and time. Time was handled as a categorical variable with seven levels (0, 1, 2, 4, 8, 24, and 48 h). We tested the overall strain effect for all seven time points simultaneously instead of testing strain effect conditional on individual time points. The difference between the inflammatory and noninflammatory genes as manifested through their overall effect was analyzed by a Mann-Whitney U test (i.e., Wilcoxon rank sum test) (36). The robust Mann-Whitney U test is a nonparametric test method without any distribution-related assumptions. The null hypothesis of this test was that there is no difference between the distributions of P values (from each effect) of inflammatory genes and noninflammatory genes. The input values for the Mann-Whitney U test are the P values associated with the moderated F statistics (estimated from the LIMMA models with empirical Bayes smoothing). For this test, the groups of inflammatory and noninflammatory genes were chosen based on a priori knowledge from the Gene Ontology (GO) annotation (1). To further demonstrate that the behavior of the inflammatory genes as a group was different from the remaining genes, a permutation method was implemented. Specifically, the same number of genes (equal to the number of inflammatory genes) was randomly selected from the whole gene pool without replacement and treated as inflammatory genes, with the rest to be treated as noninflammatory genes, and the Mann-Whitney U test was then recalculated. This procedure was repeated 10,000 times. A P value was obtained by calculating the proportion of shuffled test statistics that are greater than the observed one.
Cell death-associated genes were determined by using the GO annotation (1). Those genes that are related to cell death and significantly regulated were used for Bayesian network analysis with an internally developed software program, miniTUBA (39). In total, 83 genes were included in the DBN analysis. With two additional variables based on prior knowledge, 85 variables were used for the miniTUBA DBN analysis modeling.
For the miniTUBA analysis, the transcriptional data at the time points 0 h, 1 h, 2 h, 4 h, and 8 h postinfection were used for the simulation. The triplicates were included as replicates in the analysis. The Markov lag was set as 1 h. The spline fitting was used to fill in the missing data at the time points 3 h, 5 h, 6 h, and 7 h (39). The data at 24 h and 48 h were not used, since their use would require filling in too many missing time points and make the DBN analysis unreliable. The DBN analysis design was considered optimal after different trials and expert examination of predicted results. Data were discretized into three bins based on the quartiles for analysis using DBN. Specifically, the gene expression values of each gene across all included microarray chips were separated into three bins (low, medium, and high), each bin containing one-third of the values. The two manually generated variables were “Brucella_Rough” (i.e., rough or smooth Brucella strain) and “Macrophage_Death” (i.e., live or dead macrophages), representing the bacterium strains and the cell death phenotypes. The variable “Brucella_Rough” had three values (0 for no Brucella control, 1 for smooth Brucella strain 1330, and 2 for rough Brucella strain VTRS1). The variable “Macrophage_Death” also had three values: 0 for no observed cell death and 1 and 2 for two different levels of macrophages cell death. Based on our experimental data, level 1 of “Macrophage_Death” means a low level of cell death that occurred at 3, 4, and 5 h postinfection with VTRS1, and level 2 represents a higher level of cell death at 6, 7, and 8 h postinfection. Smooth strain 1330 does not induce any cell death within these time points. The variable “Brucella_Rough” was set to have no parent, since no other variable can be pointed to this variable. The variable “Macrophage_Death” was set to have no child, indicating that this variable cannot point to any other variable. In total, 16 DBN runs were performed using 16 computer nodes, and each run took 1 h. After the miniTUBA DBN simulations, the top network was selected for analysis. File S1 in the supplemental material contains the raw data for the miniTUBA DBN analysis.
Detection of cytokines in infected macrophages.
The levels of TNF-α and interleukin 1β (IL-1β) contained in collected culture supernatants were determined by using a sandwich enzyme-linked immunosorbent assay (ELISA) (BioLegend, CA) according to the manufacturer's instructions.
Determination of IκB-α phosphorylation.
J774.A1 macrophages were cultured in six-well plates at 1 × 10⁶ per well and infected with B. suis S1330 or VTRS1 at an MOI of 200 as described above. The macrophages were lysed with Celytic M cell lysis reagent (Sigma) with 1% protease inhibitor cocktail (Sigma) and 1% Halt phosphatase inhibitor (Thermo Scientific). Cell lysis (30 μg per sample) was subjected to PAGE on 10% Tris-HCl precast gels (Bio-Rad) and transferred onto Immobilon-P membranes (Millipore). The membranes were probed overnight at 4°C with mouse anti-IκB-α, mouse anti-phospho-IκB-α (Ser32/36) (Cell Signaling, CA), or rabbit anti-β-actin (Biovision, CA) antibodies. The membranes were then incubated with either goat anti-rabbit IgG or goat anti-mouse IgG conjugated with horseradish peroxidase (HRP) (Biovision, CA) at room temperature for 1 h and visualized by using an ECL Western blotting substrate (Pierce). The bands were quantified by densitometry and normalized to the β-actin expression.
To further test the role of NF-κB in VTRS1-induced macrophage cell death, the macrophages were pretreated with Bay 11-7082 at 8 μM for 1 h before VTRS1 infection, and the level of macrophage cell death was further analyzed as described above.
Statistical analysis of nonmicroarray experimental data.
Student's t test in Microsoft Excel was used for basic statistical analysis of experimental results that were not derived from the microarray study.
Microarray data accession number.
Microarray data were deposited in the GEO database under accession number GSE21117.
RESULTS
Survival patterns of B. suis S1330 and VTRS1 in J774.A1 macrophages.
Our studies demonstrated that S1330 and VTRS1 exhibited different kinetic patterns of survival inside J774.A macrophages (Fig. 1). The majority (approximately 90%) of phagocytosed S1330 brucellae were killed at 24 h postinfection, and this was followed by a rapid replication of surviving bacteria. This kinetic growth is consistent with the two-phase survival pattern of smooth virulent Brucella shown in earlier reports (18). In contrast, rough VTRS1 did not replicate after a slight increase in the count of live bacteria at 8 h postinfection. At 72 h postinfection, only 1% of the initial phagocytosed VTRS1 brucellae were recoverable (Fig. 1A).
Fig. 1.

Brucella growth inside macrophages and macrophage cell death. (A) Growth kinetics of B. suis S1330 and VTRS1 inside macrophages. (B) Annexin V and PI staining of normal, S1330-infected, or VTRS1-infected J774.A1 macrophages. VTRS1 induced obvious macrophage cell death at an MOI of 200 at 24 h postinfection. (C) LDH release from S1330- or VTRS1-infected macrophages. The data are represented as the means ± standard deviations from three independent experiments.
VTRS1 but not S1330 cells induced macrophage cell death.
The death of Brucella-infected J774.A1 macrophages was analyzed by annexin V (green) and propidium iodide (PI; red) staining. Annexin V detects translocation of phosphatidylserine from the inner cell membrane to the outer cell membrane of cells typically at the early stage of apoptosis. PI stains the DNA of necrotic cells and/or cells at the late stage of apoptosis. VTRS1 induced cell death with positive annexin V and/or PI staining in over 70% macrophages 24 h postinfection, while S1330 did not (Fig. 1B).
The LDH release assay was also used to determine the general cytotoxicity in macrophages infected with different Brucella strains (Fig. 1C). The LDH released from VTRS1-infected macrophages increased to 71.9% ± 1.3% over the uninfected macrophages at 24 h postinfection. No significant LDH release was detected from uninfected and S1330-infected macrophages (Fig. 1C). These results further confirmed that rough VTRS1 induces macrophage cell death, while smooth S1330 does not.
Virulent Brucella strains use a stealthy strategy to avoid activation of the innate immune system during the onset of infection (2). Virulent S1330 induced minimal cell death in infected bone marrow-derived macrophages at 24 h postinfection with an MOI of 200 or 2,000 (Table 1). No cell death was observed with a lower MOI or less time. In contrast, rough attenuated VTRS1 induced strong macrophage cell death that was time and dose dependent (Table 1). At 4 h postinfection, 18% ± 2.0% of infected macrophages underwent either apoptotic or necrotic cell death at an MOI of 20. The level of cell death significantly increased with increased MOIs and times of infection. For example, at 24 h postinfection with VTRS1 at an MOI of 200, 79.7% ± 3.4% of infected macrophages demonstrated programmed cell death (Table 1). Similar to many previous reports (7, 30), our experiments typically used the MOI of 200 for Brucella infections. When the MOI increased to a saturated level of 2,000, VTRS1 induced high level of cell death even at 4 h postinfection. This kinetic cell death pattern is consistent with the cell death induced by rough attenuated and smooth virulent B. abortus strains (7).
Table 1.
Kinetic analysis of B. suis-induced macrophage cell death
| MOI | hpia | Staining resultb |
|
|---|---|---|---|
| VTRS1 | S1330 | ||
| 2,000 | 4 | ++++ | − |
| 24 | ++++ | + | |
| 200 | 4 | +++ | − |
| 24 | ++++ | ± | |
| 20 | 4 | + | − |
| 24 | +++ | − | |
hpi, hours postinfection.
Results of annexin V and/or PI staining of macrophages infected with indicated bacteria. ++++, 75 to 100% positive; +++, 50 to 75% positive; ++, 25 to 50% positive; +, 5 to 20% positive; ±, <5% positive; −, no positive staining.
An Affymetrix microarray was further conducted to study transcriptional gene responses in macrophages infected with VTRS1 and S1330. To compare the responses of macrophages infected with wild-type smooth Brucella or rough mutants, the most widely used method is to use the same MOIs (23, 33, 42). For example, Jimenez de Bagues et al. compared the TNF-α and nitric oxide productions in J774.A1 murine macrophages infected with smoother or rough B. suis or B. melitensis strains with the same MOI of 40 (23). Rittig et al. studied intracellular trafficking and cytokine/chemokine release in human monocytes infected with smooth or rough Brucella strains with an MOI of 500 (33). Since macrophages phagocytose more rough brucellae than smooth brucellae (Fig. 1) (7), another way to compare macrophage responses to rough and smooth brucellae is to use differential MOIs (roughly 10-fold difference) for the initial infection to achieve the same Brucella cells taken up by macrophages. However, this method ignores the potential influence of extracellular brucellae on the macrophage responses (e.g., Toll-like receptor 4 [TLR4] activation) (31). Those brucellae outside macrophages may interact with the macrophage cell surface proteins or other factors and trigger active macrophage responses. Therefore, in our microarray experiment, we chose to infect J774.A1 macrophages with VTRS1 and S1330 at the same MOI of 200.
Differential gene profiles in macrophages infected with smooth and rough B. suis.
Our microarray data are available from the GEO database (http://www.ncbi.nlm.nih.gov/geo/) (see above). Of a total of 45,101 probe sets, 19,028 probe sets lacked gene expression on all chips and therefore were filtered out. The remaining 26,073 probe sets were normalized using RMA and analyzed using LIMMA as described in Materials and Methods. A total of 17,685 probe sets were significantly regulated (P value < 0.05). Among these, 10,556 sets were significantly regulated with strain, time, and interaction effects (see Fig. S1 in the supplemental material). The other 7,129 probe sets were significantly regulated with one or two of the strain, time, and interaction effects. The results indicate that the majority of the genes were significantly regulated by all three effects. The cell death-related genes from these 17,685 probe sets were obtained from the Gene Ontology (GO) annotation (1) and used for further analysis based on a dynamic Bayesian network (BN) method.
Dynamic Bayesian network analysis predicts critical genes associated with VTRS1-induced macrophage cell death.
Delineating the interactions between S1330 or VTRS1 and genes in the complex programmed cell death pathways is critical to the understanding of Brucella pathogenesis. The potential interactions were analyzed by the miniTUBA BN analysis. In our analysis, we generated two new parameters. The variable “Brucella_Rough” has three values, reflecting the infections with two Brucella strains (S1330 and VTRS1) and no infection (control). The variable “Macrophage_Death” also has three values, indicating different levels of live or dead macrophages infected by these two Brucella strains as described in Materials and Methods. The three-value discretization for this new variable is based on our prior experimental observation that 10 to 20% of VTRS1-infected macrophages underwent cell death at 3 to 5 h postinfection, and an increased number, 20 to 40% of macrophages, underwent cell death at 6 to 8 h postinfection. The prior experimental observation came from our independent experimental studies using the standard PI/annexin V staining method and LDH release assay. This prior knowledge added into the modeling allowed us to focus on a DBN to specifically address which genes regulate the macrophage cell death and how they interact in the regulatory pathway. Brucella infection serves as the entry point for the network analysis, and macrophage cell death serves as the terminus point.
Figure 2 shows a portion of the predicted top network from our miniTUBA DBN modeling. The whole network is shown in Fig. S2 in the supplemental material. Most of the 10 genes shown in Fig. 2 are directly associated with Macro- phage_Death. Casp2 (caspase-2) and its parent node, Nfkb2, are included to demonstrate that Casp2 is not directly associated with the cell death. All the interactions shown in Fig. 2 are conserved in the top 8 networks. These 10 genes could be divided into four different groups: (i) genes related to proinflammatory response, including the TNF-α, IL-1β, and Irak2 genes, (ii) genes in the NF-κB pathway, containing Nkkb2 and Nfkbia (NF-κB inhibitor alpha, also known as IκB-α) genes, (iii) caspase genes, including those for caspase-1, -2, and -7, and (iv) two other genes, encoding BirC4 (baculoviral IAP repeat-containing 4) and Atm (ataxia telangiectasia mutated). BirC4 is an inhibitor of apoptosis and also called XIAP (X-linked inhibitor of apoptosis). Atm belongs to the phosphatidylinositol 3/4-kinase family and is activated by DNA damage. These potential interactions prompted the further studies on the roles of TNF-α, IκB-α, and caspase-2 in VTRS1-induced macrophage cell death.
Fig. 2.

A portion of the miniTUBA-predicted top Bayesian network. The names include genes and two manually generated variables. Each arrow represents a predicted direct influence from one variable to another variable. The whole network is shown in Fig. S2 in the supplemental material.
It is noted that we did not preselect inflammatory genes in our DBN analysis. Many inflammatory genes (e.g., the TNF-α gene) were identified by our DBN analysis (Fig. 2) because these cell death-related genes are also inflammatory genes.
VTRS1-induced macrophage cell death was proinflammatory.
A set of 134 probes (92 genes) in the Affymetrix array is related to the inflammatory response. Among this set, 40 genes yielded significantly different expression profiles with strain, time, or interaction effects after Bonferroni's adjustment for the multiplicity testing (Fig. 3). The averaged expression profiles of the 40 inflammatory genes for each strain across time (Fig. 3A) indicated that VTRS1 induced a strong proinflammatory response that peaked at 8 h postinfection and remained high within the following 2 days. For example, the transcriptional level of TNF increased 40-fold in rough VTRS1-infected macrophages, compared to a 7-fold increase in smooth S1330-infected macrophages (Fig. 3B), at 4 h postinfection. However, S1330 induced only a slightly increased proinflammatory response within the first few hours and returned to approximately normal at 48 h postinfection.
Fig. 3.

Significantly increased proinflammatory gene responses induced by VTRS1 compared to S1330. (A) Average values of 40 significantly regulated inflammatory genes across different time points for two Brucella strains. (B) Heat map of these 40 significantly regulated inflammatory genes for two Brucella strains.
The comparisons of the empirical distributions of the P values between the inflammatory and noninflammatory probe sets for all three effects (strain, time, and their interaction) were further evaluated by the Mann-Whitney U test (Fig. 4). These gene lists were defined by the GO annotation and are independent from the microarray data (35). We tested the null hypothesis that the distribution functions of gene expression measurements between these two groups were the same by using the Mann-Whitney U test. We chose the Mann-Whitney U test because of its nonparametric nature. The P value was based on the null distribution. A permutation test was further conducted to confirm the conclusion (10). Out of 10,000 permutations, the P values were all zero for three effects (which means P values of <0.0001). It is clearly seen from the figure that for each effect, inflammatory probe sets have significantly smaller P values than the noninflammatory probe sets, indicating that the inflammatory genes are more differentiable than noninflammatory genes in terms of all three effects (strain, time, and their interaction). These results are consistent with the inflammatory gene expression profiling shown in Fig. 3. Therefore, Brucella-induced macrophage cell death is a proinflammatory response that is dependent on strain and time.
Fig. 4.

Significant differences between the inflammatory and noninflammatory genes related to strain, time, and interaction effects. For each effect (strain, time, and interaction), the Mann-Whitney U test indicates that the distribution of P values for the 134 inflammatory probe sets from the LIMMA analysis is significantly different from the distribution of P values for the 25,981 noninflammatory probe sets. The P values from the permutation based Mann-Whitney U tests are <0.0001 for all three effects.
The proinflammatory responses were further confirmed at the protein level. VTRS1-infected macrophages secreted more TNF-α (an approximately 100-fold increase at 4 h postinfection) and IL-1β (an approximately 3-fold increase at 24 h postinfection) than uninfected cells (Fig. 5A and B). S1330-infected macrophages produced less-increased TNF-α (an approximately 30-fold increase at 4 h postinfection) and IL-1β (an approximately 1.1-fold increase at 24 h postinfection).
Fig. 5.
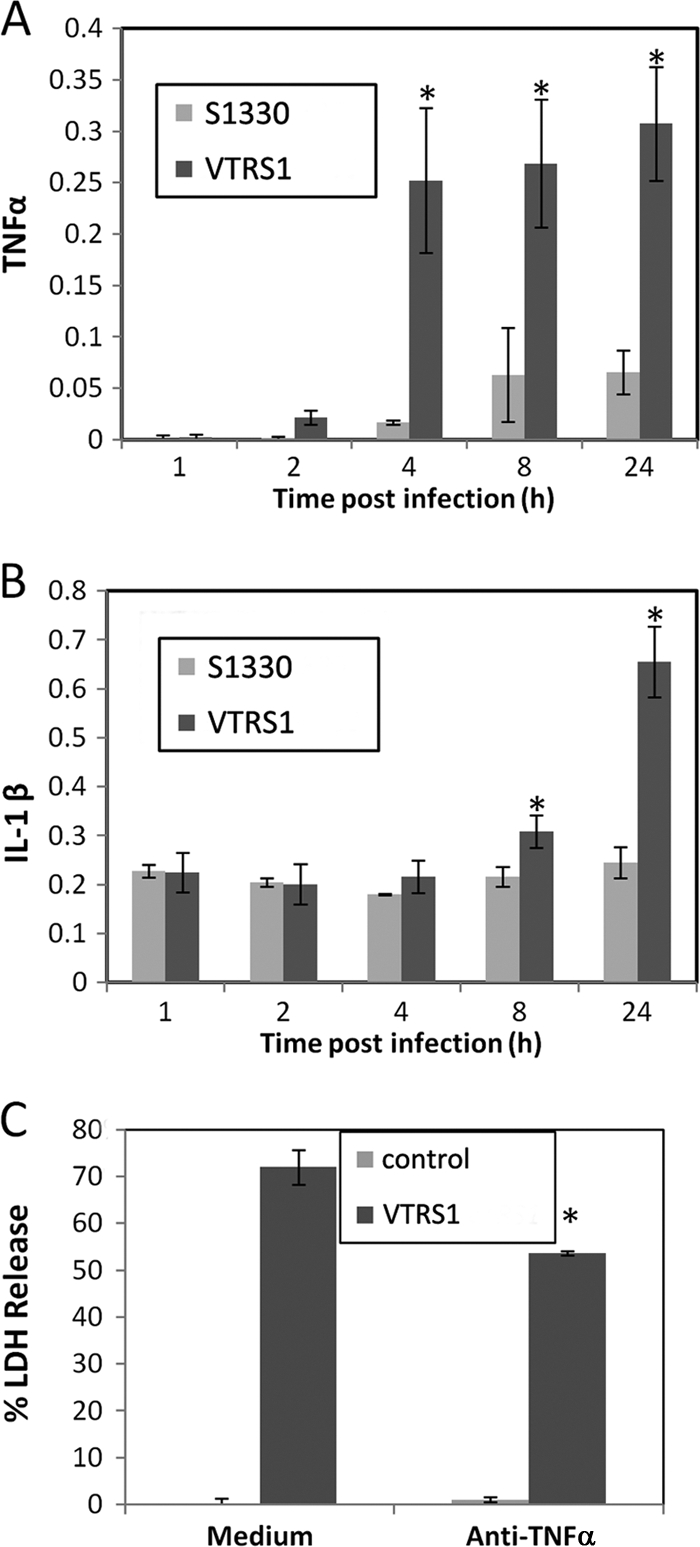
A strong proinflammatory response was induced by VTRS1 but not S1330. VTRS1 induced significantly more TNF-α (A) and IL-1β (B) in infected J774.A1 macrophages at later time points (hours postinfection) than S1330. The units for the y-axis of panels A and B are nanograms per milliliter. (C) VTRS1-induced macrophage cell death significantly decreased with anti-TNF-α antibody treatment (P value < 0.01). The results are representative of three independent experiments.
To determine the role of proinflammatory cytokine TNF-α in VTRS1-induced macrophage cell death, an antibody specific to TNF-α was used to block its function in macrophages prior to Brucella infection. At 24 h postinfection, a 26% decrease in VTRS1-induced cell death was observed due to this antibody treatment (Fig. 5C).
VTRS1-induced macrophage cell death was partially mediated by the NF-κB pathway.
The activation of the NF-κB pathway was determined by the hyperphosphorylation of IκB-α (24). Elevated levels of the phosphorylated IκB-α were found in VTRS1-infected J774.A1 macrophages at different time points (30 min to 4 h postinfection) (Fig. 6 A). S1330 infection induced much weaker IκB-α phosphorylation than VTRS1 infection.
Fig. 6.

Activation of the NF-κB pathway in J774.A1 macrophages by VTRS1 but not S1330. (A) Macrophage IκB-α phosphorylation was induced by VTRS1 but not by S1330. m, minutes; C, control. (B) VTRS1-induced macrophage cell death significantly decreased (P value < 0.01) with the NF-κB pathway inhibitor Bay 11-7082. The results are representative of three independent experiments.
To further test if NF-κB activation regulates VTRS1-induced macrophage cell death, Bay 11-7082 (12), a specific IκB-α phosphorylation inhibitor, was used to inhibit the activation of NF-κB pathway in Brucella-infected macrophages. Pretreatment with Bay 11-7082 at 8 μM reduced VTRS1-induced macrophage cell death by 54% at 24 h postinfection (P value < 0.001) (Fig. 6B). These results indicate that the NF-κB pathway activation is critical in the induction of VTRS1-induced macrophage cell death.
VTRS1-induced macrophage cell death was mediated by caspase-2.
Out of all caspases, the transcriptional levels of caspase-1, -2, -3, -4, -7, and -8 were differentially regulated in macrophages infected with S1330 or VTRS1 based on our microarray study (Fig. 7). VTRS1 induced much higher levels of caspase-1, -4, and -8 at 2 h or 4 h postinfection. The transcription of caspase-3 was significantly decreased at 8 h postinfection and increased afterwards in both VTRS1- and S1330-infected macrophages. Caspase-7 was not dramatically differentially regulated in Brucella-infected macrophages except that its transcription was mildly downregulated at 8 h and 48 h postinfection in VTRS1-infected macrophages. The transcription of caspase-2 changed only slightly in S1330-infected macrophages at any of the seven time points postinfection. In VRS1-infected macrophages, the caspase-2 transcription showed a dramatic decrease by 4 h postinfection followed by stable low expression at later time points.
Fig. 7.

Gene expression profile for significantly regulated caspases. The broken and intact lines represent expression levels of different caspases in J774.A1 macrophages infected with VTRS1 and S1330, respectively. BS, smooth B. suis strain S1330; RS, rough B. suis strain VTRS1.
To systematically study how different caspases regulated Brucella-induced macrophage cell death, a panel of caspase inhibitors were used to treat macrophages prior to Brucella infections (Fig. 8). An inhibitor of pancaspase, caspase-3/7, caspase-4, or caspase-8 stimulated minor inhibition of VTRS1-induced macrophage cell death. In contrast, the rough Brucella-induced macrophage cell death was dramatically inhibited by a caspase-2 inhibitor. In contrast to the high cell death rate (77.9% ± 5.7%) in VTRS1-infected macrophages with any inhibitor treatment, only 14% ± 2.5% macrophages died in caspase-2 inhibitor-treated macrophages. It is interesting that a caspase-1 inhibitor did not affect VTRS1-infected macrophage cell death, though the transcription of caspase-1 in VTRS1-infected macrophages was significantly upregulated at 8 h postinfection (Fig. 7).
Fig. 8.

Inhibition of VTRS1-induced macrophage cell death. VTRS1-induced J774.A1 macrophage cell death was dramatically inhibited by a caspase-2 (Casp2) inhibitor (inh). The cell death was also inhibited by an inhibitor of pancaspase, caspase-3/7, caspase-4, or caspase-8. Macrophages were pretreated with each caspase inhibitor and then infected with VTRS1 at an MOI of 200. The results are representative of three independent experiments. The cells were stained with PI and observed by phase-contrast (left panels) or fluorescence (right panels) microscopy. Magnification, ×200.
To further confirm the regulatory role of caspase-2 in VTRS1-induced macrophage cell death, BMDM isolated from a caspase-2-deficient mouse were infected with either VTRS1 or S1330. Over 60% of VTRS1-infected BMDM from a wild-type mouse died at 24 h postinfection, while BMDM from a caspase-2-deficient mouse showed only minimal cell death (Fig. 9). Taken together, these results strongly suggest that caspase-2 plays a vital role in rough B. suis strain VTRS1-induced murine macrophage cell death.
Fig. 9.

Inhibition of cell death of VTRS1-infected bone marrow-derived macrophages isolated from a caspase-2-knockout mouse. Compared to the case for wild-type macrophages, no obvious cell death was observed in VTRS1-infected macrophages from the caspase-2-knockout mice at 24 h postinfection.
DISCUSSION
Our study demonstrates for the first time that rough attenuated B. suis VTRS1, but not smooth virulent B. suis strain S1330, induces caspase-2-mediated, proinflammatory cell death in infected macrophages. This cell death is activated by the NF-κB pathway. The caspase-2-mediated, caspase-1-independent macrophage cell death is different from caspase-1-mediated pyroptosis. Apoptosis is a programmed process that, with or without caspase involvement, results in noninflammatory cell death that features shrinkage of the cell and its nucleus (5). Since a strong proinflammatory response occurs during the VTRS1-induced cell death, this rough Brucella-induced macrophage cell death is also not a typical apoptosis. To our knowledge, this unique caspase-2-dependent proinflammatory cell death demonstrated in our study has not been reported before.
The proinflammatory response during the VTRS1-induced macrophage cell death was demonstrated by the large number of upregulated proinflammatory factors, such as TNF-α and IL-1β (Fig. 2 and 3). The proinflammatory pattern was further confirmed by the inhibitory effect of anti-TNF-α antibody on the eventual macrophage cell death (Fig. 3C). Our conclusion was also indirectly supported by the observation that live rough B. suis and B. melitensis induced significantly higher production of proinflammatory cytokines (e.g., TNF-α, IL-1, and IL-6) in infected human monocytes than live smooth Brucella strains (33). Exogenous LPS isolated from rough or smooth Brucella strains had similar effects on the induction of proinflammatory cytokines in infected human monocytes (33). This result is consistent with previous reports that smooth Brucella O antigen (32) or heat-killed rough Brucella (7) is unable to induce macrophage cell death.
Caspase-2 is one of the most conserved caspases across many species. However, its function in cell death signaling is still an enigma. Caspase-2 has some unique features not shared by other caspases, including its nuclear localization (29) and the properties that make it both an initiator and an effector caspase in apoptosis (25). Caspase-2-deficient mice develop normally and have a mild phenotype, suggesting that this caspase function is redundant for cellular homeostasis during development and in the adult organism. However, caspase-2 is associated with cell death in response to different signaling pathways, such as reactive oxygen species (ROS) and endoplasmic reticulum stress (26). Our results provide another perspective of the role of caspase-2, including the possibility that rough Brucella induces cell death via a newly identified pathway.
How can this caspase-2-mediated proinflammatory response be defined? The term “pyroptosis” was originally defined as proinflammatory programmed cell death (5, 8). In the term, the Greek roots “pyro” and “ptosis” represent fire (or fever) and falling, respectively. Therefore, it might be possible to classify the caspase-2-mediated proinflammatory cell death as a “caspase-2-mediated pyroptosis.” In this case, pyroptosis could be divided into two groups, one mediated by caspase-1 and the other by caspase-2. While this caspase-2-mediated pyroptosis is first found here in rough Brucella-infected macrophages, this type of cell death may also exist in many other systems. Caspase-2-mediated cell death exists in host cells infected with other pathogens, such as Salmonella (22) and Epstein-Barr virus (41), and also cancer (26). Some of the caspase-2-mediated cell death may also be proinflammatory, which deserves further analyses.
Many questions regarding the caspase-2-mediated proinflammatory cell death or pyroptosis still remain. It was shown that caspase-1-mediated pyroptosis is not accompanied by the loss of mitochondrial membrane integrity and release of cytochrome c (5). However, our previous study indicated that the caspase-2-mediated cell death induced by rough Brucella strains was associated with decreased mitochondrial membrane potential (MMP) and subsequent cytochrome c release (7). One noteworthy observation is on the possible interaction between caspase-1 and caspase-2. It was reported that the activation of caspase-1 during Salmonella-induced macrophage cell death partially relies on caspase-2 (22). Besides the proinflammatory response, are there any differences between caspase-2-mediated pyroptosis and apoptosis? The caspase-2-mediated pyroptosis appears to preserve some features similar to those of apoptosis (7). It remains to be determined whether caspase-2-mediated pyroptosis and apoptosis coexist. Macrophage cell death induced by rough Brucella has been described as apoptosis, oncosis, or a mixture of apoptosis and necrosis (7, 11, 14). It is unknown whether caspase-2 functions in all these different types of cell death. The mechanism of caspase-2-mediated proinflammatory cell death induced by rough Brucella deserves further investigation.
The interaction between NF-κB and cell death is intriguing. The majority of evidence, especially that generated by the analysis of knockout mice, provides strong support to the antiapoptotic function of NF-κB (24). Many bacteria, for example, Yersinia spp. and Salmonella, induce macrophage cell death by inhibiting NF-κB activation. However, sporadic reports indicated that NF-κB may contribute to the induction of proapoptotic molecules (24). Pei et al. reported activation of NF-κB that was induced by rough B. abortus but not by smooth B. abortus (31). Our results with smooth and rough B. suis strains are consistent with this report. By selective inhibition of the NF-κB activation, we further demonstrated that the activation of NF-κB has a partial causative effect on the induction of VTRS1-induced macrophage cell death. While NF-κB potentiates caspase-1 activation, Bay 11-7085 (an inhibitor of NF-κB activation) did not prevent caspase-1-dependent lysis of anthrax lethal toxin-treated cells (12). To our knowledge, our study provides the first direct evidence that an inhibition of the NF-κB activation prevents pathogen-induced host cell death. The effect of the NF-κB activation is probably due to its regulatory role in the proinflammatory responses. However, more studies are required to further understand the mechanism of how NF-κB promotes Brucella-induced cell death.
The biological relevance of this caspase-2-dependent proinflammatory cell death is worth further investigation. Many other intracellular pathogens, such as Salmonella (22) and viruses (e.g., Epstein-Barr virus [41]), also induced host cell death that is mediated by caspase-2. It will be interesting to determine whether a proinflammatory response accompanies caspase-2-mediated cell death and, if so, how this proinflammatory caspase-2-mediated cell death plays a role in pathogenesis and host immunity. Caspase-2 is one of the most evolutionarily conserved caspases, and it may have multiple roles in the DNA damage response, cell cycle regulation, and tumor suppression (26). Our finding of a proinflammatory response associated with casepase-2 provides a new perspective on analysis of the other scenarios. In terms of Brucella, this unique cell death appears to be a host defense mechanism against Brucella pathogenesis, since smooth virulent Brucella does not induce cell death, whereas the rough, attenuated strain does. The inhibition of macrophage cell death allows the surviving brucellae to avoid the more hostile extracellular environment (34). The Brucella O antigen is a critical virulence factor in Brucella pathogenesis. Macrophage cell death induced by rough Brucella is most likely due to the pleiotropic effect of removing the majority of the O side chain that results in the structural change of the Brucella cell envelope (16). The Brucella O side chain probably acts as a negative modulator of nonspecific adherence, which allows receptors such as TLR to function (16). Meanwhile, recent findings also suggest that programmed cell death of macrophages infected with many pathogens (e.g., Mycobacterium tuberculosis, Salmonella, or influenza virus) plays a critical role in the initiation of antigen presentation and induction of protective immunity (3). Further study on the unique caspase-2-dependent proinflammatory cell death induced by a rough Brucella vaccine and vaccine candidates will provide a better understanding of protective Brucella immunity and promote rational vaccine development against infections with virulent Brucella.
Our research also demonstrated that the miniTUBA Bayesian network analysis provides a powerful method for analysis of microarray gene expression data and predicting gene interaction networks. While miniTUBA has been tested using clinical mouse data, our study is the first to demonstrate it can be used in predicting gene network interactions based on microarray data. Our miniTUBA program predicted that the groups related to the proinflammatory response, the NF-κB pathway, and caspases are three groups important for the induction of programmed cell death of VTRS1-infected macrophages. These miniTUBA-predicted results were verified by experimental studies. This approach is generic and can be used in analysis of other host pathogen interactions.
New features are being considered for addition into the miniTUBA DBN analysis. Our current miniTUBA analysis considered only those genes known to be associated with cell death. However, some genes with unknown cell death involvement may also participate in the VTRS1-induced macrophage cell death pathway. We have recently developed a BN+1 expansion method that can identify novel pathway elements by using static BN (19, 20). The BN+1 method has been verified using synthetic data analysis (19) and Escherichia coli real microarray data analysis (20). Such a method may possibly be applied in dynamical BN analysis and is currently under investigation.
Supplementary Material
ACKNOWLEDGMENTS
This work was sponsored by the NIH/NIAID Regional Center of Excellence for Bio-defense and Emerging Infectious Diseases Research (RCE) Program. We acknowledge membership within and support from the Region V Great Lakes RCE (NIH award 1-U54-AI-057153). This project was also supported by the NIAID R-21 grant (1R21AI057875-01) to Y. He.
Suggestions and critical review of the manuscript by Michele Swanson, Mary O'Riordan, and George W. Jourdian at the University of Michigan are gratefully acknowledged.
Footnotes
Supplemental material for this article may be found at http://iai.asm.org/.
Published ahead of print on 4 April 2011.
REFERENCES
- 1. Ashburner M., et al. 2000. Gene Ontology: tool for the unification of biology. The Gene Ontology Consortium. Nat. Genet. 25:25–29 [DOI] [PMC free article] [PubMed] [Google Scholar]
- 2. Barquero-Calvo E., et al. 2007. Brucella abortus uses a stealthy strategy to avoid activation of the innate immune system during the onset of infection. PLoS One 2:e631. [DOI] [PMC free article] [PubMed] [Google Scholar]
- 3. Baumann S., Nasser Eddine A., Kaufmann S. H. 2006. Progress in tuberculosis vaccine development. Curr. Opin. Immunol. 18:438–448 [DOI] [PubMed] [Google Scholar]
- 4. Bergeron L., et al. 1998. Defects in regulation of apoptosis in caspase-2-deficient mice. Genes Dev. 12:1304–1314 [DOI] [PMC free article] [PubMed] [Google Scholar]
- 5. Bergsbaken T., Fink S. L., Cookson B. T. 2009. Pyroptosis: host cell death and inflammation. Nat. Rev. 7:99–109 [DOI] [PMC free article] [PubMed] [Google Scholar]
- 6. Carvalho Neta A. V., et al. 2008. Modulation of the bovine trophoblastic innate immune response by Brucella abortus. Infect. Immun. 76:1897–1907 [DOI] [PMC free article] [PubMed] [Google Scholar]
- 7. Chen F., He Y. 2009. Caspase-2 mediated apoptotic and necrotic murine macrophage cell death induced by rough Brucella abortus. PLoS One 4:e6830. [DOI] [PMC free article] [PubMed] [Google Scholar]
- 8. Cookson B. T., Brennan M. A. 2001. Pro-inflammatory programmed cell death. Trends Microbiol. 9:113–114 [DOI] [PubMed] [Google Scholar]
- 9. Eskra L., Mathison A., Splitter G. 2003. Microarray analysis of mRNA levels from RAW264.7 macrophages infected with Brucella abortus. Infect. Immun. 71:1125–1133 [DOI] [PMC free article] [PubMed] [Google Scholar]
- 10. Farmer P., et al. 2005. Identification of molecular apocrine breast tumours by microarray analysis. Oncogene 24:4660–4671 [DOI] [PubMed] [Google Scholar]
- 11. Fernandez-Prada C. M., et al. 2003. Interactions between Brucella melitensis and human phagocytes: bacterial surface O-polysaccharide inhibits phagocytosis, bacterial killing, and subsequent host cell apoptosis. Infect. Immun. 71:2110–2119 [DOI] [PMC free article] [PubMed] [Google Scholar]
- 12. Fink S. L., Bergsbaken T., Cookson B. T. 2008. Anthrax lethal toxin and Salmonella elicit the common cell death pathway of caspase-1-dependent pyroptosis via distinct mechanisms. Proc. Natl. Acad. Sci. U. S. A. 105:4312–4317 [DOI] [PMC free article] [PubMed] [Google Scholar]
- 13. Fink S. L., Cookson B. T. 2005. Apoptosis, pyroptosis, and necrosis: mechanistic description of dead and dying eukaryotic cells. Infect. Immun. 73:1907–1916 [DOI] [PMC free article] [PubMed] [Google Scholar]
- 14. Freeman B. A., Kross D. J., Circo R. 1961. Host-parasite relationships in brucellosis. II. Destruction of macrophage cultures by Brucella of different virulence. J. Infect. Dis. 108:333–338 [DOI] [PubMed] [Google Scholar]
- 15. Friedman N., Linial M., Nachman I., Pe'er D. 2000. Using Bayesian networks to analyze expression data. J. Comput. Biol. 7:601–620 [DOI] [PubMed] [Google Scholar]
- 16. González D., et al. 2008. Brucellosis vaccines: assessment of Brucella melitensis lipopolysaccharide rough mutants defective in core and O-polysaccharide synthesis and export. PLoS One 3:e2760. [DOI] [PMC free article] [PubMed] [Google Scholar]
- 17. Gross A., Terraza A., Ouahrani-Bettache S., Liautard J. P., Dornand J. 2000. In vitro Brucella suis infection prevents the programmed cell death of human monocytic cells. Infect. Immun. 68:342–351 [DOI] [PMC free article] [PubMed] [Google Scholar]
- 18. He Y., et al. 2006. Brucella melitensis triggers time-dependent modulation of apoptosis and down-regulation of mitochondrion-associated gene expression in mouse macrophages. Infect. Immun. 74:5035–5046 [DOI] [PMC free article] [PubMed] [Google Scholar]
- 19. Hodges A. P., et al. 2010. Bayesian network expansion identifies new ROS and biofilm regulators. PLoS One 5:e9513. [DOI] [PMC free article] [PubMed] [Google Scholar]
- 20. Hodges A. P., Woolf P., He Y. 2010. BN+1 Bayesian network expansion for identifying molecular pathway elements. Commun. Integr. Biol. 3:549–554 [DOI] [PMC free article] [PubMed] [Google Scholar]
- 21. Irizarry R. A., et al. 2003. Exploration, normalization, and summaries of high density oligonucleotide array probe level data. Biostatistics 4:249–264 [DOI] [PubMed] [Google Scholar]
- 22. Jesenberger V., Procyk K. J., Yuan J., Reipert S., Baccarini M. 2000. Salmonella-induced caspase-2 activation in macrophages: a novel mechanism in pathogen-mediated apoptosis. J. Exp. Med. 192:1035–1046 [DOI] [PMC free article] [PubMed] [Google Scholar]
- 23. Jiménez de Bagüés M. P., Terraza A., Gross A., Dornand J. 2004. Different responses of macrophages to smooth and rough Brucella spp.: relationship to virulence. Infect. Immun. 72:2429–2433 [DOI] [PMC free article] [PubMed] [Google Scholar]
- 24. Karin M., Lin A. 2002. NF-kappaB at the crossroads of life and death. Nat. Immunol. 3:221–227 [DOI] [PubMed] [Google Scholar]
- 25. Krumschnabel G., Manzl C., Villunger A. 2009. Caspase-2: killer, savior and safeguard—emerging versatile roles for an ill-defined caspase. Oncogene 28:3093–3096 [DOI] [PMC free article] [PubMed] [Google Scholar]
- 26. Kumar S. 2009. Caspase 2 in apoptosis, the DNA damage response and tumour suppression: enigma no more? Nat. Rev. Cancer 9:897–903 [DOI] [PubMed] [Google Scholar]
- 27. Macedo G. C., et al. 2008. Central role of MyD88-dependent dendritic cell maturation and proinflammatory cytokine production to control Brucella abortus infection. J. Immunol. 180:1080–1087 [DOI] [PubMed] [Google Scholar]
- 28. Pappas G., Papadimitriou P., Akritidis N., Christou L., Tsianos E. V. 2006. The new global map of human brucellosis. Lancet Infect. Dis. 6:91–99 [DOI] [PubMed] [Google Scholar]
- 29. Paroni G., Henderson C., Schneider C., Brancolini C. 2002. Caspase-2 can trigger cytochrome C release and apoptosis from the nucleus. J. Biol. Chem. 277:15147–15161 [DOI] [PubMed] [Google Scholar]
- 30. Pei J., Ficht T. A. 2004. Brucella abortus rough mutants are cytopathic for macrophages in culture. Infect. Immun. 72:440–450 [DOI] [PMC free article] [PubMed] [Google Scholar]
- 31. Pei J., Turse J. E., Ficht T. A. 2008. Evidence of Brucella abortus OPS dictating uptake and restricting NF-kappaB activation in murine macrophages. Microbes Infect. 10:582–590 [DOI] [PMC free article] [PubMed] [Google Scholar]
- 32. Pei J., Turse J. E., Wu Q., Ficht T. A. 2006. Brucella abortus rough mutants induce macrophage oncosis that requires bacterial protein synthesis and direct interaction with the macrophage. Infect. Immun. 74:2667–2675 [DOI] [PMC free article] [PubMed] [Google Scholar]
- 33. Rittig M. G., et al. 2003. Smooth and rough lipopolysaccharide phenotypes of Brucella induce different intracellular trafficking and cytokine/chemokine release in human monocytes. J. Leukoc. Biol. 74:1045–1055 [DOI] [PubMed] [Google Scholar]
- 34. Roop R. M., II, Gaines J. M., Anderson E. S., Caswell C. C., Martin D. W. 2009. Survival of the fittest: how Brucella strains adapt to their intracellular niche in the host. Med. Microbiol. Immunol. 198:221–238 [DOI] [PMC free article] [PubMed] [Google Scholar]
- 35. Scheer M., et al. 2006. JProGO: a novel tool for the functional interpretation of prokaryotic microarray data using Gene Ontology information. Nucleic Acids Res. 34:W510–W515 [DOI] [PMC free article] [PubMed] [Google Scholar]
- 36. Shimizu T., et al. 2011. Microarray and quantitative RT-PCR analyses in calcium-channel blockers induced gingival overgrowth tissues of periodontitis patients. Arch. Oral Biol. 56:277–284 [DOI] [PubMed] [Google Scholar]
- 37. Smyth G. K. 2005. Limma: linear models for microarray data, p. 397–420In Gentlemann R., Carey V., Dudoit S., Irizarry R., Huber W. (ed.), Bioinformatics and computational biology solutions using R and bioconductor. Springer, New York, NY [Google Scholar]
- 38. Winter A. J., et al. 1996. Protection of BALB/c mice against homologous and heterologous species of Brucella by rough strain vaccines derived from Brucella melitensis and Brucella suis biovar 4. Am. J. Vet. Res. 57:677–683 [PubMed] [Google Scholar]
- 39. Xiang Z., Minter R. M., Bi X., Woolf P., He Y. 2007. miniTUBA: medical inference by network integration of temporal data using Bayesian analysis. Bioinformatics 23:2423–2432 [DOI] [PubMed] [Google Scholar]
- 40. Yu J., Smith V. A., Wang P. P., Hartemink A. J., Jarvis E. D. 2004. Advances to Bayesian network inference for generating causal networks from observational biological data. Bioinformatics 20:3594–3603 [DOI] [PubMed] [Google Scholar]
- 41. Zhang X., Uthaisang W., Hu L., Ernberg I. T., Fadeel B. 2005. Epstein-Barr virus-encoded latent membrane protein 1 promotes stress-induced apoptosis upstream of caspase-2-dependent mitochondrial perturbation. Int. J. Cancer 113:397–405 [DOI] [PubMed] [Google Scholar]
- 42. Zhong Z., et al. 2009. Cytotoxicity of Brucella smooth strains for macrophages is mediated by increased secretion of the type IV secretion system. Microbiology 155:3392–3402 [DOI] [PubMed] [Google Scholar]
Associated Data
This section collects any data citations, data availability statements, or supplementary materials included in this article.