

Abstract
We have screened a human immunoglobulin single-chain variable fragment (scFv) phage library against the C-terminal tetramerization regions of erythroid and nonerythroid beta spectrin (βI-C1 and βII-C1, respectively) to explore the structural uniqueness of erythroid and nonerythroid β-spectrin isoforms. We have identified interacting scFvs, with clones “G5” and “A2” binding only to βI-C1, and clone “F11” binding only to βII-C1. The Kd values, estimated by competitive enzyme-linked immunosorbent assay, of these scFvs with their target spectrin proteins were 0.1–0.3 μM. A more quantitative Kd value from isothermal titration calorimetry experiments with the recombinant G5 and βI-C1 was 0.15 μM. The α-spectrin fragments (model proteins), αI-N1 and αII-N1, competed with the βI-C1, or βII-C1, binding scFvs, with inhibitory concentration (IC50) values of ∼50 μM for αI-N1, and ∼0.5 μM for αII-N1. Our predicted structures of βI-C1 and βII-C1 suggest that the Helix B′ of the C-terminal partial domain of βI differs from that of βII. Consequently, an unstructured region downstream of Helix B′ in βI may interact specifically with the unstructured, complementarity determining region H1 of G5 or A2 scFv. The corresponding region in βII was helical, and βII did not bind G5 scFv. Our results suggest that it is possible for cellular proteins to differentially associate with the C-termini of different β-spectrin isoforms to regulate α- and β-spectrin association to form functional spectrin tetramers, and may sort β-spectrin isoforms to their specific cellular localizations.
Keywords: beta spectrin, erythroid and nonerythroid, scFv, structural difference, affinity difference
Introduction
Spectrin is a major protein in the membrane cytoskeleton and plays important structural roles in many types of human cells.1 Spectrin and other proteins such as actin, ankyrin, and protein 4.1 form a cytoskeletal network.2,3 The most common and well studied spectrin isoforms are erythroid αI- and βI-spectrin, and nonerythroid αII- and βII-spectrin.1 It is generally accepted that αI-, αII-, βI-, and βII-spectrin are all expressed within neurons,4–8 with αI- and βI-spectrin found in neuronal cell bodies, dendrites, and postsynaptic terminals of neurons,9 whereas αII- and βII-spectrin are found in the axon and presynaptic termini.10 The major functions of spectrin are to maintain cell shape and membrane integrity, with the functional form of spectrin being tetrameric. Erythrocytes of patients with hemolytic anemia symptoms have reduced levels of spectrin tetramers.11 The C-terminal region of α-spectrin associates with the N-terminal region of β-spectrin to form an αβ heterodimer, and further association at the N-terminal region of α-spectrin of one dimer with the C-terminal region of β-spectrin of another dimer forms (αβ)2 tetramers.12,13 The N-terminal partial domain of α-spectrin consists of a single helix (Helix C′), and the C-terminal partial domain of β-spectrin consists of two helices [Helices A′ and B′; see Fig. 6(A)]. These partial domain helices are involved in the dimer association to form tetramers, and thus these sites are often referred to as the tetramerization sites of spectrin. The affinity of dimers to form tetramers is lower in erythroid cells than in nonerythroid cells, with the Kd in the μM range for model erythroid proteins, and in the nM range for model nonerythroid proteins.14–17 The spectrin isoforms exhibit high sequence identity and similarity.16–18 We have shown that a small but key difference in the N-terminal junction region in αI- and αII-spectrin is primarily responsible for the large difference in spectrin tetramer formation in erythroid and nonerythroid spectrin.17 The tetramerization sites for βI- and βII-spectrin not only exhibit 80% sequence similarity but also exhibit affinities similar to each other in their association with α-spectrin to form spectrin tetramers.
Figure 6.
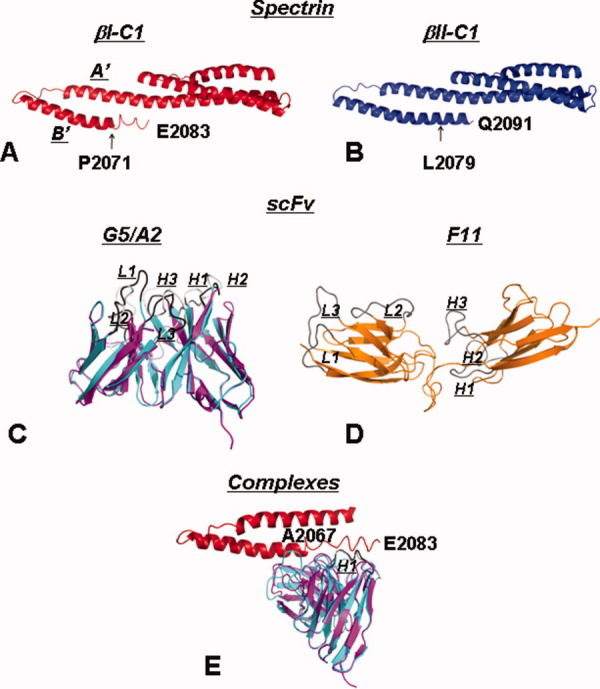
Predicted three-dimensional structures of β-spectrin segments and their complexes with scFvs. The structures of βI-C1 (A) and βII-C1 (B) show a canonical triple helical bundle for the last structural domain at the N-terminal part, and the double helical partial domain of Helix A′ and B′ at the C-terminal end. The major difference between βI-C1 and βII-C1 is at the C-terminal end of Helix B′, with βI assuming an unstructured conformation after residue 2070, whereas βII continues to assume a helical conformation. The overlaid structures of G5 (cyan) and A2 (purple) (C) show that their predicted structures are similar. The CDRs (L1, L2, L3, H1, H2, and H3) of G5 is in black and those of A2 in light gray. The predicted structure for F11 (orange) (D) differs substantially from those of G5 and A2 and does not resemble most of the scFv structures. In a possible βI-C1/G5 complex (only the partial domain of βI-C1 is shown) with residues 2071–2083 of βI-C1 docked to the H1 region of G5 and energy minimized, residues 2067–2070 in βI-C1 changed from unstructured to helical (E).
This study identified phage displayed single-chain variable fragments (scFvs)19 that differentially associate with the tetramerization site of either βI- or βII-spectrin. Phage display of antibody fragments has been widely used as a platform for rapid identification of antibody fragments that bind to targets with therapeutic, diagnostic, and research reagent applications.20–24 These libraries have been engineered to display the highly variable antigen-binding regions of human immunoglobins: the hypervariable domain of the light chain (VL) is linked to that of the heavy chain (VH) to form a scFv of VL-linker-VH.25 The complementarity determining regions (CDRs) in both VL and VH regions determine the scFv specificity. Phage particles displaying scFvs that bind to target proteins are selected by iterative rounds of target binding and phage amplification. Thus, antibody fragments from a large pool of diverse scFvs are selected to bind to target proteins with relatively high affinity.26,27 In this study, two scFvs, G5 and A2, were found to bind specifically to βI-C1 model protein, and one, F11, was found to bind specifically to βII-C1 model protein. None of the three bound to the N-terminal segment of either αI- or αII-spectrin (αI-N1 or αII-N2), the native binding partner of β-spectrin. However, both αI-N1 and αII-N1 competed with G5, A2, or F11 scFvs for β-spectrin interaction. Such specific interaction may regulate α- and β-spectrin association to form functional spectrin tetramers and may sort β-spectrin isoforms to their specific cellular localizations.
Results
Specific β-spectrin interactors
Using the fusion protein of the C-terminal segment of βI-spectrin (βI-C1, see “Materials and Methods” Section) as the target protein, after three rounds of screening of a phage library of initially about 109 different scFv proteins, 48 of the screened scFv clones were randomly selected for enzyme-linked immunosorbent assay (ELISA) assays, and 10 were found with signal-to-noise ratios, at 405 nm (S/N405), larger than 2 [Fig. 1(A)]. Six clones with the highest values (A2, B1, D4, G3, G5, and H3) were selected to determine whether they interacted specifically with βI-C1, or whether they also interacted with other spectrin tetramerization site segments (the nonerythroid counter part of βI-C1, βII-C1, and the corresponding α-spectrin segments, αI-N1 and αII-N1). Clones G5 and A2 were found to be specific for βI-C1 [Fig. 1(C)], with values of absorbance at 405 nm (A405) about 24-fold higher for clone G5 with βI-C1 than with βII-C1, αI-N1, and αII-N1, and about 10-fold higher for A2.
Figure 1.
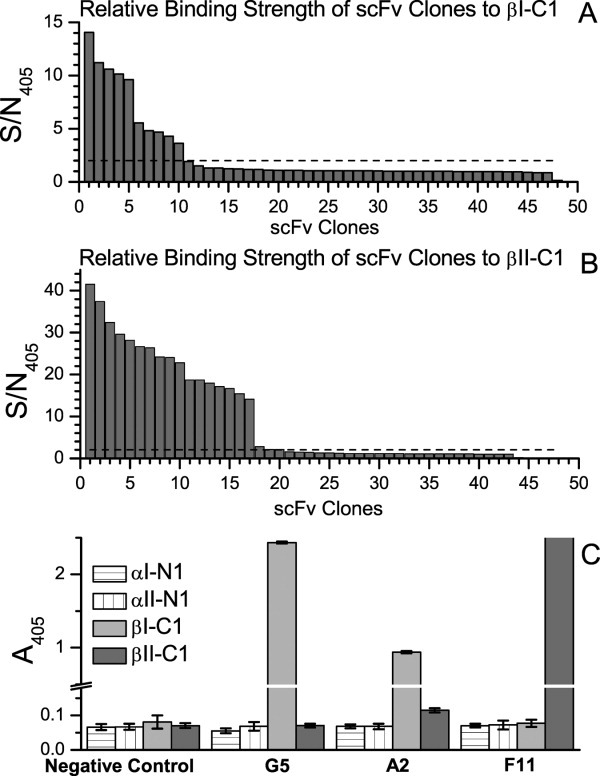
Confirmatory ELISA assay results (signal-to-noise ratio at 405 nm, S/N405) of 48 randomly selected clones recovered from screening scFv phage library. The bait proteins were (A) βI-C1 and (B) βII-C1. The S/N405 values were sorted for easy comparison. S/N405 values at 2 were marked with a dashed line. A total of 10 scFvs exhibited values larger than 2 in (A) and 18 in (B). Six of the 10 scFvs in (A) were tested for competitive binding with αI-N1, αII-N1, and βII-C1, and two, G5 and A2, were found to be specific for βI-C1 and not for αI-N1, αII-N1, and βII-C1 (C). Five of the 18 scFvs in (B) were tested and two, D12 and F11, were found to be specific for βII-C1 and not for αI-N1, αII-N1, and βI-C1 (C). DNA sequencing results showed that D12 and F11 were the same. For (C), selected phage clones were incubated with αI-N1, αII-N1, βI-C1, and βII-C1 proteins. Binding of the phage clones to these proteins was detected by ELISA. The negative control wells were without phage. Results are reported with error bars representing the standard deviation of the mean from duplicate measurements.
Similarly, using βII-C1 as the target protein, 18 scFv clones were found to exhibit S/N405 values larger than 2 [Fig. 1(B)]. Five clones with the highest values (A12, B8, D12, F11, and G10) were selected to determine whether they interacted only with βII-C1, or if they also interacted with βI-C1 as well as αI-N1 and αII-N1. Clones D12 and F11 were found to be specific for βII-C1 [Fig. 1(C)]. DNA sequencing results showed that D12 and F11 were the same, with their A405 values about 27-fold higher with βII-C1 than with βI-C1, αI-N1, and αII-N1. These results demonstrated that clones G5 and A2 scFvs associated only with βI-C1, and F11 scFv associated only with βII-C1. All three scFv clones did not interact with the α-spectrin N-terminal tetramerization sites. The amino acid sequences of these scFvs, translated from their DNA sequences obtained from sequencing, were aligned, and their Kabat CDRs (L1, L2, L3, H1, H2, and H3)28 were identified and are shown in Figure 2.
Figure 2.

(A) Sequence alignment of scFvs G5, A2, and F11. The six CDRs of scFvs, L1, L2, L3, H1, H2, and H3, are singly underlined. The residues predicted to be in unstructured regions by 3D-JIGSAW program are bolded. (B) Sequence alignment of the C-terminal regions of βI-spectrin (residues 2008–2083) and βII-spectrin (residues 2016–2091). The partial domain is predicted to consist of Helix A′ and Helix B′ (underlined). The residues predicted to be in unstructured regions are bolded. The sequences exhibit 71% identity and 81% similarity. Most of the sequence differences are found at the very end of the C-termini, from residue βI-T2058 (βII-A2067) to the end, with 53% identity and 67% similarity. Residues 2071–2083 in βI-spectrin assume an unstructured conformation, but residues 2079–2091 in βII-spectrin assume a helical conformation [also see Fig. 6(A,B)].
Competitive binding
Competitive ELISA experiments showed that the N-terminal α-spectrin segments, both αI-N1 and αII-N1, were able to compete with scFvs G5 and A2 for βI-C1 association, and with F11 for βII-C1 association (Fig. 3). Despite relatively large (up to 20%) uncertainties in individual measurements, it was clear that, in the βI-C1/G5 mixture, the amounts of G5 bound to βI-C1 decreased upon adding increasing amounts of αI-N1, or of αII-N1 [Fig. 3(A)], indicating competitive binding. Similarly αI-N1 and αII-N1 also competed with A2 for the association with βI-C1 [Fig. 3(B)] and F11 for the association with βII-C1 [Fig. 3(C)]. Curve fitting of these data (see “Materials and Methods” Section), assuming single binding site, allowed us to obtained the half maximal inhibitory concentration (IC50) for αI-N1 or αII-N1 in these associations. The IC50 value for αI-N1 inhibiting G5 binding to βI-C1 was 50 μM (R2 = 0.81), and for αII-N1 was 0.9 μM (R2 = 0.97) (Table I). These IC50 values also indicated that αII-N1 exhibits higher affinity than αI-N1 in association with βI-C1, in agreement with previous isothermal titration calorimetry (ITC) findings.17 Following a published method (see “Materials and Methods” Section) to calculate Kd values from corresponding IC50 values, we obtained a Kd value of 0.2 μM from the αI-N1 data and 0.1 μM from the αII-N1 data for the βI-C1/G5 complex. Similarly, for the βI-C1/A2 complex [Fig. 3(B)], the IC50 value for αI-N1 was 43 μM (R2 = 0.89), and for αII-N1 was 0.2 μM (R2 = 0.96). The Kd for the βI-C1/A2 complex was 0.2 μM from the αI-N1 data and 0.3 μM from the αII-N1 data.
Figure 3.

Competitive ELISA of phages displaying scFvs G5, A2, or F11. Fusion proteins βI-C1 or βII-C1 (βI-C1 or βII-C1) were immobilized on plates. Clones G5 or A2 were added to βI-C1 plates, and F11 were added βII-C1 plates. The same volume, but different amounts (i.e., concentrations), of either αI-C1 or αII-C1 were added. Absorbance values at 405 nm were obtained and normalized.29 Semi-log plots of normalized values versus the concentrations of αI-N1 (closed circles) or αII-N1 (open circles) were analyzed (see text) to give IC50 values for βI-C1 and clone G5 (or A2) binding, and for βII-C1 and F11 binding. The R2 values for the curve fitting for IC50 values in (A) are 0.81 for αI-N1 and 0.97 for αII-N1, in (B) are 0.90 for αI-N1 and 0.97 for αII-N1, and in (C) are 0.90 for αI-N1 and 0.97 for αII-N1.
Table I.
IC50 and Kd Values from Competitive ELISA Measurements (Fig. 3) and Kd Values from ITC Experiments (Fig. 5)
| IC50 (μM) | |||||
|---|---|---|---|---|---|
| αI-N1 | αII-N1 | ||||
| βI-C1/G5 | βI-C1/A2 | βII-C1/F11 | βI-C1/G5 | βI-C1/A2 | βI-C1/F11 |
| 50 | 43 | 50 | 0.9 | 0.2 | 0.9 |
| Kd (μM) for β spectrin/scFv (G5, A2, or F11) complexes | |||||||
|---|---|---|---|---|---|---|---|
| Competitive ELISA | ITC | ||||||
| G5 | A2 | F11 | rG5 | ||||
| αI-N1a | αII-N1b | αI-N1a | αII-N1b | αI-N1a | αII-N1b | ||
| βI-C1 | 0.2 | 0.1 | 0.2 | 0.3 | N.B.c | N.B. | 0.15 |
| βI-C1Δ | n.d.d | n.d. | n.d. | n.d. | n.d. | n.d. | 5.3 |
| βII-C1 | N.B. | N.B. | 0.2 | 0.1 | N.B. | ||
Kd values obtained from the αI-N1 curve in the assay.
Kd values obtained from the αII-N1 curve.
N.B., no binding.
n.d., not determined.
For βII-C1/F11 complex [Fig. 3(C)], the IC50 value for αI-N1 was 50 μM (R2 = 0.90) and for αII-N1 was 0.9 μM (R2 = 0.97). The Kd value for the βII-C1/F11 complex was 0.2 μM from the αI-N1 data and 0.1 μM from the αII-N1 data. In summary, the Kd values were all about 0.2 μM for G5 or A2 complexed with βI-C1, and for F11 complexed with βII-C1.
Affinity of recombinant G5 to βI-C1—ITC studies
As the ELISA measurements discussed above exhibited relatively large experimental errors, recombinant G5 (rG5) protein was prepared for direct measurements of its association with βI-C1 and βII-C1. rG5 consisted of 264 residues, including the N-terminal FLAG tag (9 residues), C-terminal His tag (13 residues), and G5 (239 residues) (see “Materials and Methods” Section), and was purified to give a single component at about 30 kD on the gel (Fig. 4 inset, left panel). The Western blot results showed the presence of both FLAG-tag (middle panel) and His-tag (right panel) in the purified scFv. The analysis of experimental circular dichroism (CD) spectra (Fig. 4) showed that the secondary structure consisted of about 47% β-sheet, 8% α-helix, and 45% unstructured.
Figure 4.
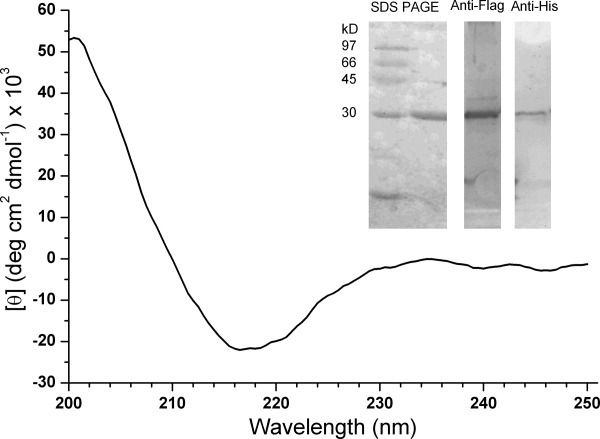
Far UV circular dichorism spectrum of recombinant protein G5 (rG5). The spectrum was analyzed with the K2D2 program to give 47% β-sheet, 8% α-helix and 45% unstructured. Protein SDS gel electrophoresis analysis showed rG5 to be ∼ 30 kD (left panel). Western blotting with anti-FLAG antibody (middle panel) and anti-His antibody (right panel) showed the presence of FLAG-tag at the N terminus and His-tag at the C-terminus.
The Kd value from ITC measurements for the rG5/βI-C1 complex was 0.15 ± 0.04 μM (n = 5) [Fig. 5(A)], in good agreement with the 0.1–0.2 μM values obtained from ELISA measurements. When a protein derived from βI-C1 but with residues after 2070 removed (βI-C1Δ) was used in the ITC titration, the Kd value increased to 5.3 μM [Fig. 5(B)], clearly indicating the involvement of residues 2071–2083 of βI in rG5 binding. ITC titration of rG5 with βII-C1 showed little detectable binding under the same condition [Fig. 5(C)], further confirming the binding specificity of G5 toward βI- but not βII-spectrin.
Figure 5.

Isothermal titration calorimetry (ITC) results showed a Kd value of 0.15 μM for rG5 with βI-C1 (A), and 5.3 μM for rG5 with βI-C1Δ, where residues 2071–2083 in βI-C1 were deleted (B). Little heat was involved in the titration of rG5 and βII-C1 (C), in agreement with the ELISA results. The protein samples were dialyzed in 5 mM phosphate buffer with 150 mM sodium chloride at pH 7.4 overnight, with gentle stirring to ensure identical buffer conditions. The ITC experiments were carried out with 30 μM β-spectrin protein titrated into the sample cell containing 3 μM rG5.
We also did ITC experiments for βI-C1/αI-N1 and βI-C1/αII-N1 associations with the same βI-C1 sample used for rG5 titration, and a Kd of 0.9 μM was obtained for the βI-C1/αI-N1 complex, and a Kd of 6 nM was obtained for the βI-C1/αII-N1 complex (Table I). Without the fusion protein tag on the βI protein, we have shown previously that the Kd value for the βI-C1/αI-N1 complex was about 1 μM,16,30,31 and that for the βI-C1/αII-N1 ranged from 4 to 12 nM.15–18 Thus, it appears that the fusion protein tag in βI-C1, βII-C1, αI-N1, and αII-N1 did not affect the association of these proteins.
Predicted structures of βI-C1 and βII-C1
The crystal structure of the C-terminal region of bound βI, complexed with the N-terminal region of αI, has been solved by X-ray diffraction.32 However, the structure of the free form is not known except that Helix B′ in the partial domain ends at residue 2070,33 and the region downstream of residue 2070 is unstructured, as shown by spin label electron paramagnetic resonance (EPR) studies.34 Therefore, we used homology modeling methods to predict the free form of βI-C1 and βII-C1. The modeling program (see “Materials and Methods” Section) selected the protein with a Protein Data Bank (PDB) code of 1CUN35 as the template for predicting the structures for both βI-C1 (residues 1898–2083). This template protein (1CUN) is a recombinant protein of domains 16–17 of chicken α-spectrin.35 With this template, a predicted structure of βI-C1 was obtained, with a triple helical bundle as the full structural domain, followed by two helices as the partial domain [Fig. 6(A)]. The first helix in the partial domain, Helix A′, and the last helix in the structural domain showed no clear boundary between them, with one helix merging into the next helix. The second helix in the partial domain region, Helix B′, consisted of 29 residues (βI-2042-2070), followed by an unstructured region (βI-2071-2083).
For βII-C1 (residues 1906–2091), the modeling program also selected the protein 1CUN as the template, presumably due to the high degree of similarity in the sequences of βI-C1 and βII-C1. A very similar overall structure was obtained, except for Helix B′ [Fig. 6(B)]. Helix B′ was a long helix of 45 residues (βII-2047-2091), 16 residues longer than that in βI [Fig. 6(B)]. Helix B′ in βII started 3 residues earlier than Helix B′ in βI (residue 2047 in βII corresponds to residues 2039 in βI), and the difference was more obvious at the end of Helix B′. The unstructured region following Helix B′ in βI was a helical region in βII (βII-2080-2091). Thus, Helix B′ in βI was shorter than that in βII and was followed by a region with unstructured conformation.
The remarkable agreement between the predicted structure and the experimental observation of βI, on the last residue in Helix B′ (residue 2070) and the unstructured region down stream of this residue further provide evidence that the coiled-coil-type proteins are well suited for homology modeling. We believe that the homology-modeling techniques are particularly useful for coiled coil type helices, as we have discussed previously.36 Because of the heptad repeats in their sequences of these helices, the structures of the helices are relatively restricted, governed by similar molecular interactions, with the residues at the “a” and “d” positions of a coiled helix being hydrophobic and clustering with other hydrophobic residues, such as the “a” and “d” residues of other helices with similar structure when bundled. Thus, it is not surprising to find that the predicted structure of βI-C1 obtained by homology modeling agrees very well with experimental results. We believe that the predicted structure for βII-C1 is equally solid. ITC results indicated that the unstructured region of residues 2071–2083 in βI was important for G5 binding. With the corresponding region in βII being helical, it is not surprising that ITC measurements did not detect any binding of βII-C1 to G5.
Predicted structures of G5, A2, and F11
The homology modeling program selected one protein (4m5.3 anti-fluorescein single chain antibody fragment; PDB: 1X9Q)37 as the template for both βI-C1 interactors G5 and A2, indicating high sequence homology between G5 and A2. The predicted 3D structures for G5 and A2 were quite similar [Fig. 6(C)]. A similar structure was also predicted for rG5, which consisted of an added N-terminal FLAG epitope-tag of 9 residues and a C-terminal His tag of 13 residues. From the predicted structure, the secondary structure content of rG5 was calculated to consist of 41% β-sheet, 10% α-helix, and 49% unstructured, in very good agreement with the values extracted from CD spectra of rG5 discussed above (47% β-sheet, 8% α-helix, and 45% unstructured). This agreement also provided validity to the predicted structures of rG5, G5, and A2.
For F11, a different template (an engineered scFv T84.66 dimer; PDB: 1MOE)38 was selected by the program. The predicted structure for F11 [Fig. 6(D)] was quite different from those of G5 and A2, and did not resemble the structures of most scFvs. Thus, we will not discuss its structure further. However, it is highly likely that the structure of F11 differs from those of G5 and A2. Tertiary structural epitope difference is responsible for the different binding properties.
Possible binding sites of scFvs on β-spectrin
The specificity of scFvs to binding proteins is usually due to the specificity in their CDRs. As the H1 segment is the only CDR segment that shares sequence identity between G5 and A2, we suggest that the H1 segment plays an important role in the binding of βI-C1, and we docked H1 to the C-terminus of Helix B′, including the unstructured region consisting of residues 2071–2083 to give βI-C1/G5 and βI-C1/A2 complexes. In the proposed structure of the complexes, after energy minimization under the G43a1 force field to remove distorted residues and close contacts, residues T2073, Q2080, and E2083 in the unstructured region downstream of Helix B′ and residues T153 and S156 in the unstructured H1 of G5 formed a network of hydrogen bonds to stabilize the complex [Fig. 6(E)]. Furthermore, cation and π electron (cation-π) interactions between K2070 and K2077 of βI and Y50 of L2 and Y226 and Y227 of H3 might enhance the stability of the complex. Similar, but fewer, interactions were found in the βI-C1/A2 complex, in agreement with the experimental finding of a weaker affinity for A2. Thus, it is possible that hydrogen bonds (or salt bridges) as well as cation-π interactions between positively charged and aromatic side chains are necessary for βI interactors to bind to this region of βI to give stable complexes. It should be noted that we used a fairly simple approach for docking the proteins rather than more sophisticated docking programs as our goal is simply to show possible protein–protein interactions.
Discussion
It has been shown that, in the association of two αβ dimers to form an (αβ)2 tetramer, erythroid αI-spectrin and nonerythroid αII-spectrin exhibit different affinity with β-spectrin, either βI- or βII-spectrin, and yet βI- and βII-spectrin exhibit similar affinity with α-spectrin, either αI- or αII-spectrin.14,39 The model proteins used in most studies of the α-spectrin tetramerization site at the N-terminus are αI-N1 and αII-N1, each consisting of the N-terminal partial domain and one (the first) structural domain. The model proteins of the β-spectrin tetramerization site at the C-terminus are βI-C1 and βII-C1. General structural prediction shows that each of these two proteins consists of the last structural domain and the C-terminal partial domain.40,41 The Kd values for the complexes of αI-N1 with either βI-C1 or βII-C1 are ∼1 μM, whereas the values for the complexes of αII-N1 with either βI-C1 or βII-C1 are ∼10 nM.15,16 Thus, the affinity differences in tetramer formation between spectrin I and II are mostly attributable to the conformational differences between αI and αII.17,18,42 The βI and βII C-terminal partial domains (residues 2008–2083 in βI and 2016–2091 in βII) are considered to be similar both in function and in conformation. These two regions exhibit high sequence homology (∼70% identity and 80% similarity). However, in this study, we show protein binding differences between βI and βII C-termini. We use phage displayed scFv library screening method to probe the difference in β-spectrin C-terminal partial domains. We showed that two scFvs (G5 and A2) bound specifically to the βI but not the βII C-terminus. We also identified one scFv, F11, that bound specifically to the βII but not the βI C-terminus. None of the three scFvs showed any detectable association with the N-termini of αI- and αII-spectrin, rendering selective protein binding. These results suggest that there are different conformations, not necessarily of the entire partial domain region but of some local segment(s) in βI-C1 and βII-C1.
Detailed structural information is needed for a mechanistic understanding of the differences in spectrin isoform tetramer formation. Yet, the majority of the structural studies of spectrin are of its structural domains (e.g., 1AJ343; 2SPC44; 3EDV45; 3KBT/3KBU32) or SH3 domain (2RMO46; 2OAW47; 1U0648). For the tetramerization regions, many studies have focused on the N-terminal region of αI- and αII-spectrin,15–18,30,31,42,48 but only a few have studied the C-terminal region of β-spectrin.32–34,41,49
Spin label EPR studies provide the first experimental information on a local region of Helix B′ in free βI-spectrin (not associated with αI-spectrin), with residues before 2071P in helical conformation (Helix B′), and residues after 2071P in an unstructured conformation.33,34 The predicted structure of free Helix B′ of βI in this study also showed that Helix B′ ended at residue 2070, and residues 2071–2083 were unstructured, in excellent agreement with EPR studies [Figs. 2(C) and 6(A)]. Recently, the crystal structure of the bound form (to an αI-spectrin fragment) of the C-terminal region of βI-spectrin showed a helical conformation for residues 2044–2069 and residues 2074–2083, and a short unstructured region (residues 2070–2073) [Fig. 2(C)]. Thus, a large part of the unstructured region in the free form (residues 2071–2083) is helical (2074–2083) in the bound form. Structural differences in the free42 and bound15,30,36 forms of α-spectrin have been observed experimentally, with the N-terminal junction region in αI-spectrin (residues 46–52) undergoing conformational changes, from unstructured to helical conformation, upon binding to the C-terminal fragment of β1-spectrin.30,32 The conformation of the βI-Helix B′ bound to G5 was predicted to consist of residues 2044–2068, a conformation different from the free form and a form in the presence of αI [Fig. 2(C)]. Residues 2071–2083 remained unstructured. It is likely that some of the βI residues in the unstructured conformation interact with the residues in the unstructured H1 CDR of G5, and that these interactions contribute toward a stable βI-C1-G5 complex. The removal of this region in βI resulted in a less stable G5-βI complex, and we have found earlier that αI-N1 does not associate with βI-C1Δ.33 The predicted structure of scFv A2 was very similar to that of G5. Thus, βI-C1 also interacted with A2 in a similar manner. However, such conformation did not allow the binding of scFv F11.
No experimental information is currently available for the structure of the similar region in βII. The predicted structure of the free Helix B′ in βII-C1 in this study showed a longer Helix B′, with the region corresponding to the unstructured region in βI (residues 2071–2083 in βI and residues 2079–2091 in βII) being helical and forming part of Helix B′. We suggest that the difference in the conformation in this region of β-spectrin is responsible for the selective binding of G5 and A2 to βI and of F11 to βII. These predicted structural features in free and in various bound form await experimental verification, or revision.
It is possible that specific cellular proteins, such as those with structural features similar to those in G5 and A2, or those in F11, may bind β-spectrin isoforms with specificity, due to hydrogen bonding networks and/or pairs of cation-π interactions between the side-chains of a particular β-spectrin isoform and its specific interactor. It has been reported, for example, that the ring-infected erythrocyte surface antigen of Plasmodium falciparum binds to the C-terminal region of βI-spectrin.50 These bindings may play a role in determining or regulating spectrin isoform tetramer formation if the bindings exhibit affinity similar to the Kd values for scFvs obtained in this study. The Kd values for β-spectrin, either βI-C1, or βII-C1, and scFv interactors (G5 and A2, or F11, respectively) are about 0.2 μM, a value higher than that for αII-N1/βI-C1 and αII-N1/βII-C1 complexes (ca. 10 nM), but lower than that for αI-N1/βI-C1 and αI-N1/βII-C1 complexes (ca. 1 μM). Thus, in a mixture of αI, αII, βI, and βII, the concentration or the level of (αII/βI)2 would decrease slightly in the presence of a specific βI-interactor (e.g., a cellular protein), as the interactor competes with αII for βI and may reduce the amount of (αII/βI)2 formation. However, the concentration of (αII/βII)2 should not change, as βI-interactor does not compete with αII for βII. Similarly, cellular proteins with structural features similar to scFv F11 may affect the tetramer concentration of (αII/βII)2, but not (αII/βI)2. In neural cells, one of the functions of the spectrin tetramer network beneath the inner leaflet of membrane bilayer is to maintain the membrane integrity.51,52 These tetramers are not only (αIβI)2 and (αIIβII)2 but also hybrids, such as (αIβII)2 or (αIIβI)2.4 It is possible that cellular proteins bind specifically to one spectrin tetramerization site, but not others, to maintain and regulate the formation of these specific tetramers. In addition to affecting tetramer formation, these interactors/binders may affect the distinct localization, or sorting, of β-spectrin, for example, in hair cells53 and in neuronal cells.49 If α-spectrin and β-spectrin existing at nonstoichiometric ratios in cells, there will be an opportunity for these interactors to interact with the noncomplexed subunit, and thus not necessary affecting the αβ complex formation. It has been shown that in chicken erythroid cells, α-spectrin is synthesized in a 3:1 ratio relative to β-spectrin, and the subunits are assembled in equimolar proportions, with the excess α-spectrin turning over.54,55 Future studies are needed to understand the physiological effects of any interactors on spectrin tetramer formation.
It is possible that the structural differences between βI- and βII-spectrin extend beyond the regions discussed above, that is, beyond residue 2083 in βI and residue 2091 in βII. It has been shown that two important residues in βII, residue 2110 (serine) and 2159 (threonine) can be phosphorylated, and phosphorylation greatly reduced its interaction with αII-spectrin.49 However, in βI, the residue corresponding to the serine residue in βII is an alanine residue, which can not be phosphorylated. The phosphorylation sites in this region are not conserved in βI and βII.49 It is interesting to note that abnormalities at the C-terminus of another spectrin isoform, βIV-spectrin, are involved in the quivering mice phenotype.56
Our results also demonstrate the usefulness of phage displayed scFvs. We concur with a reviewer of this paper, who stated that “probes of this nature for spectrin function are still under-developed and the reagents described here have potential for multiple applications.”
Materials and Methods
Spectrin recombinant proteins
The following tetramerization site spectrin segments were selected to prepare fusion recombinant proteins, with glutathione S-transferase (GST) at the N-terminus, using standard procedures17,33,39: (1) a C-terminal segment of βI-spectrin consisting of residues 1898–2083, to include the last spectrin structural domain followed by the partial domain of two helices responsible for the association with α-spectrin in tetramer formation [sequence shown in Fig. 2(B)] and an unstructured region (βI-C1), (2) a shortened version of βI-C1 consisting of residues 1898–2070, with the unstructured region (last 13 residues in βI-C1) removed (βI-C1Δ), (3) the βII counterpart of βI-C1, consisting of residues 1906–2093 (βII-C1), (4) an N-terminal segment of αI spectrin consisting of residues 1–156, to include the partial domain of a long helix responsible for the association with β-spectrin in tetramer formation, followed by the first spectrin structural domain (αI-N1), and (5) the αII counterpart of αI-N1, consisting of residues 1–147 (αII-N1).
scFv phage library screening for β-spectrin interactors
The human immunoglobulin scFv phage-display library,19,26,57,58 with about 109 unique scFvs displayed at the N-terminus of the gene III product, was used to screen for scFv that binds βI-C1 (scFv-βI) or βII-C1 (scFv-βII). Three rounds of screening were applied.
In the first (initial) round, βI-C1 or βII-C1, with a concentration of 10 μg/mL (0.1 μM) in a phosphate buffer (8 mM Na2HPO4 and 1.5 mM KH2PO4 at pH 7 with 137 mM NaCl and 3 mM KCl), was immobilized individually in the wells of 96-well plates. Bovine serum albumin was added to coat any remaining surface to minimize subsequent nonspecific scFv binding. After washing, a solution containing the phage library was added to the wells. After 2 h, unbound phages were removed, the bound phages were eluted with an acidic solution (50 mM glycine, pH 2), followed by pH neutralization with a Tris buffer (1 mM, pH 8) and phage amplification. Phage amplification was achieved by infection and growing the TG strain of Escherichia coli cells to mid-log phase in Luria Bertani medium at 37°C for 1 h, with shaking.59
For the second round of screening, the amplified phages selected in the first round were used, and the target protein concentration was lowered to 5 μg/mL to select binders with affinity higher than those selected in the first round. Selected phages were amplified and used in the third round, where the target protein concentration was further reduced to 2.5 μg/mL.
ELISA for specific interaction
From the screened phages with interacting scFv clones, 48 were randomly selected for ELISA60 to confirm their interaction only with their target protein (either βI-C1 or βII-C1). We also used ELISA with αI-N1, αII-N1 and the nontarget β protein, either βI-C1 or βII-C1, to identify those scFvs that interact only with the target protein but not with the other tetramerization site proteins. In this assay, horseradish peroxidase (HRP)-conjugated anti-M13 phage antibody was used to detect the amount of complex formed between a specific scFv-phage and the target protein. The values of the absorbance at 405 nm (A405) of a well with scFv-phage and immobilized target protein (signal) and of a well without immobilized protein (noise) were used to calculate A405 signal-to-noise ratios (S/N405).
Competitive ELISA assay
Competitive ELISA experiments were designed to determine whether αI-N1, the binding partners of βI-C1, competed with a selected scFv displaying phage (scFv-βI) for βI-C1binding. Mixtures of scFv-βI (ca. 10 μM, or 1014 phage particles in 100 μL) and varying concentrations of αI-N1 (0–0.03M) were preincubated at 25°C for 1 h and then added to wells with immobilized βI-C1. This mixture was incubated at 25°C for 2 h. The amounts of HRP-conjugated anti-phage antibody in each well, indicated by A405 values, were obtained as a function of αI-N1 concentration. For comparison purposes, the A405 values were normalized by the value of a sample without αI-N1 protein.61 The normalized A405 values, as a function of log [αI-N1], were fitted to a published competitive binding equation, A405 ([αI-N1]) = Ab + (At − Ab)/(1 + 10([αI-N1]−log IC50)),62 where At = A405 without αI-N1, Ab = A405 with saturating level of competitor, and IC50 = concentration of αI-N1 with 50% signal remaining. The At, Ab, and IC50 values were obtained from curve fitting. The dissociation constant (Kd) values for βI-C1 and scFv-phage complex were calculated from the IC50 with a published equation,  = [scFv]/(IC50/
 − 1),62 where was the Kd for the βI-C1 and scFv complex and for the βI-C1 and αI-N1 complex. [scFv] = 10 μM. Similarly, the IC50 value of αII-N1, in competition with the association of βII-C1 with its scFv interactors and the Kd value for βII-C1 with F11 were also determined.
Recombinant G5 scFv protein (rG5) preparation
G5 protein, a scFv-βI interactor (see “Results” Section), was prepared with the pAPIII6,19 including an N-terminal FLAG epitope-tag (DYKDDDDKL) and a C-terminal His tag (VDGRAASHHHHHH) to give rG5. With this AP-G5 plasmid, the protein overexpression in E. coli BL21(DE3) Codon Plus cells was controlled by alkaline phosphatase promoter, and a signal peptide (ompA) directs the recombinant protein to the periplasmic space in E. coli cells. Cells were grown in phosphate-limiting media,63 containing 100 mg/L ampicillin at 30°C for 18–20 h. About 5–7 g of cells were harvested from 2 L cultures and suspended in a Tris buffer (30 mM, pH 8.0) with 20% sucrose and 1 mM EDTA (80 mL per gram of wet cells) for 5–10 min with gentle agitation on ice. The mixture was centrifuged at 8000g at 4°C for 20 min. The pellet was resuspended in the same volume of ice-cold 5 mM MgSO4, followed by shaking in an ice bath for 10 min to release rG5 by osmotic shock, and centrifuged. The supernatant was dialyzed extensively against a phosphate buffer (50 mM with 300 mM NaCl, pH 8), with 10 mM imidazole, before loading onto a Ni-NTA agarose column. The column was washed with the phosphate buffer with 20 mM imidazole, and rG5 was eluted with the phosphate buffer with 250 mM imidazole. About 1 mg of pure rG5 was obtained from 1 g of cells. Published procedures for Western blotting64 with minor modification were followed to detect the presence of N-terminal FLAG and C-terminal His tags in rG5.
CD measurement
The far UV CD spectrum of rG5 (3 μM) in a phosphate buffer (5 mM with 150 mM NaCl, pH 7.4; PBS) was recorded on a J-810 model spectrophotometer (JASCO, Japan) at 25°C with a 0.1 cm pathlength cell. The observed ellipicity was converted into mean residue molar ellipicity (deg cm2 dmol−1) as before.36 CD spectra were also analyzed with the K2D2 program to estimate the secondary structure content (http://www.ogic.ca/projects/k2d2/).38 This program provides a Pearson correlation coefficient of 0.90 for α-helix and 0.78 for β-sheet prediction.29
ITC measurements of scFv and β-spectrin
ITC measurements, using a VP-ITC (MicroCal, LLC, Northampton, MA), at 25°C16 were done on protein samples extensively dialyzed in PBS at 4°C. rG5 (3 μM) in the sample cell was titrated with βI-C1, βI-C1Δ, or βII-C1 (30 μM). Titrations of αI-N1 (180 μM) to βI-C1 (15 μM) and of αII-N1 (42 μM) to βI-C1 (3.7 μM) were also performed.
Structural prediction
The three-dimensional structures of the C-terminal segments of β-spectrin and three scFv antibody fragments, including rG5, were predicted using the program 3D-JIGSAW (http://bmm.cancerresearchuk.org/~3djigsaw/).65 This program predicts structures based on their sequence homology with proteins whose structural coordinates are already deposited in the PDB.
A possible structure for the complex of a scFv and a β-spectrin segment was obtained by docking the two proteins manually, and restrained by molecular information obtained from experimental data. The Swiss-PDB Viewer (SPBDV, http://spdbv.vital-it.ch/) was used to manipulate the structures. With the β-spectrin segment fixed in space and guided by information obtained experimentally, the scFv was moved and rotated to give a complex that satisfied all of the experimental results. A 6000-step energy minimization was carried out with GROMACS (v.4.0.1) using the G43a1 force field17,66 to eliminate clashing atom contacts introduced by simple manual docking. The structures were visualized with PyMOL (Schrödinger, LLC, New York, NY).
Acknowledgments
The authors thank Renhua Huang for performing the Western blotting experiments. They also thank the reviewers for their helpful comments; some of the comments have been included in this article.
Glossary
Abbreviations:
- αI-N1
a recombinant protein of αI-spectrin segment with residues 1–156
- αI-spectrin
erythroid α-spectrin
- αII-N1
a GST fusion protein of αII-spectrin segment with residues 1–147
- αII-spectrin
nonerythroid α-spectrin
- βI-C1
a GST fusion protein of βI-spectrin segment with residues 1898–2083
- βI-C1Δ
a GST fusion protein of βI-spectrin segment with residues 1898–2070, that is, the residues 2071–2083 in βI-C1 were deleted
- βI-spectrin
erythroid β-spectrin
- βII-C1
a GST fusion protein of βII-spectrin segment with residues 1906–2093
- βII-spectrin
nonerythroid β-spectrin
- CD
circular dichroism
- CDRs
complementarity determining regions
- ELISA
enzyme-linked immunosorbent assay
- EPR
electron paramagnetic resonance
- GST
glutathione S-transferase
- HRP
horseradish peroxidase
- ITC
isothermal titration calorimetry
- PBS
phosphate buffered saline at pH 7.4
- rG5
recombinant G5, a single-chain variable fragment found to bind βI-C1
- scFv
single-chain variable fragment.
References
- 1.Bennett V, Healy J. Organizing the fluid membrane bilayer: diseases linked to spectrin and ankyrin. Trends Mol Med. 2008;14:28–36. doi: 10.1016/j.molmed.2007.11.005. [DOI] [PubMed] [Google Scholar]
- 2.Bennett V, Baines AJ. Spectrin and ankyrin-based pathways: metazoan inventions for integrating cells into tissues. Physiol Rev. 2001;81:1353–1392. doi: 10.1152/physrev.2001.81.3.1353. [DOI] [PubMed] [Google Scholar]
- 3.Broderick M, Winder S. Spectrin, alpha-actinin, and dystrophin. Adv Protein Chem. 2005;70:203–246. doi: 10.1016/S0065-3233(05)70007-3. [DOI] [PubMed] [Google Scholar]
- 4.Clark MB, Ma Y, Bloom ML, Barker JE, Zagon IS, Zimmer WE, Goodman SR. Brain α erythroid spectridentification, compartmentalization, and β spectrin associations. Brain Res. 1994;663:223–236. doi: 10.1016/0006-8993(94)91267-x. [DOI] [PubMed] [Google Scholar]
- 5.Malchiodi-Albedi F, Ceccarini M, Winkelmann JC, Morrow JS, Petrucci TC. The 270 kDa splice variant of erythrocyte β-spectrin (β1Σ2) segregates in vivo and in vitro to specific domains of cerebellar neurons. J Cell Sci. 1993;106:67–78. doi: 10.1242/jcs.106.1.67. [DOI] [PubMed] [Google Scholar]
- 6.Yoon SH, Skalka H, Prchal JT. Presence of erythroid and nonerythroid spectrin transcripts in human lens and cerebellum. Invest Ophthalmol Visual Sci. 1989;30:1860–1866. [PubMed] [Google Scholar]
- 7.Winkelmann JC, Forget BG. Erythroid and nonerythroid spectrins. Blood. 1993;81:3173–3185. [PubMed] [Google Scholar]
- 8.Susuki K, Rasband MN. Spectrin and ankyrin-based cytoskeletons at polarized domains in myelinated axons. Exp Biol Med. 2008;233:394–400. doi: 10.3181/0709-MR-243. [DOI] [PubMed] [Google Scholar]
- 9.Riederer BM, Zagon IS, Goodman SR. Brain spectrin (240/235) and brain spectrin (240/235E): two distinct spectrin subtypes with different locations within mammalian neural cells. J Cell Biol. 1986;102:2088–2096. doi: 10.1083/jcb.102.6.2088. [DOI] [PMC free article] [PubMed] [Google Scholar]
- 10.Kordeli E. The spectrin-based skeleton at the postsynaptic membrane of the neuromuscular junction. Microsc Res Tech. 2000;49:101–107. doi: 10.1002/(SICI)1097-0029(20000401)49:1<101::AID-JEMT11>3.0.CO;2-U. [DOI] [PubMed] [Google Scholar]
- 11.Delaunay J. The molecular basis of hereditary red cell membrane disorders. Blood Rev. 2007;21:1–20. doi: 10.1016/j.blre.2006.03.005. [DOI] [PubMed] [Google Scholar]
- 12.DeSilva TM, Peng KC, Speicher KD, Speicher DW. Analysis of human red cell spectrin tetramer (head-to-head) assembly using complementary univalent peptides. Biochemistry. 1992;31:10872–10878. doi: 10.1021/bi00159a030. [DOI] [PubMed] [Google Scholar]
- 13.Speicher DW, DeSilva TM, Speicher KD, Ursitt JA, Hembach P, Weglarz L. Location of the human red cell spectrin tetramer binding site and detection of a related “closed” hairpin loop dimer using proteolytic footprinting. J Biol Chem. 1993;268:4227–4235. [PubMed] [Google Scholar]
- 14.Bignone PA, Baines AJ. Spectrin αII and βII isoforms interact with high affinity at the tetramerization site. Biochem J. 2003;374:613–624. doi: 10.1042/BJ20030507. [DOI] [PMC free article] [PubMed] [Google Scholar]
- 15.Long F, McElheny D, Jiang S, Park S, Caffrey MS, Fung LW-M. Conformational change of erythroid α-spectrin at the tetramerization site upon binding β-spectrin. Protein Sci. 2007;16:2519–2530. doi: 10.1110/ps.073115307. [DOI] [PMC free article] [PubMed] [Google Scholar]
- 16.Mehboob S, Jacob J, May M, Kotula L, Thiyagarajan P, Johnson ME, Fung LW-M. Structural analysis of the alpha N-terminal region of erythroid and nonerythroid spectrins by small-angle X-ray scattering. Biochemistry. 2003;42:14702–14710. doi: 10.1021/bi0353833. [DOI] [PubMed] [Google Scholar]
- 17.Mehboob S, Song Y, Witek M, Long F, Santarsiero BD, Johnson ME, Fung LW-M. Crystal structure of the non-erythroid α-spectrin tetramerization site reveals differences between erythroid and non-erythroid spectrin tetramer formation. J Biol Chem. 2010;285:14572–14584. doi: 10.1074/jbc.M109.080028. [DOI] [PMC free article] [PubMed] [Google Scholar]
- 18.Li Q, Fung LW-M. Structural and dynamic study of the tetramerization region of non-erythroid alpha-spectra frayed helix revealed by site-directed spin labeling electron paramagnetic resonance. Biochemistry. 2009;48:206–215. doi: 10.1021/bi8013032. [DOI] [PMC free article] [PubMed] [Google Scholar]
- 19.Haidaris CG, Malone J, Sherrill LA, Bliss JM, Gaspari AA, Insel RA, Sullivan MA. Recombinant human antibody single chain variable fragments reactive with Candida albicans surface antigens. J Immunol Methods. 2001;257:185–202. doi: 10.1016/s0022-1759(01)00463-x. [DOI] [PubMed] [Google Scholar]
- 20.Smith GP. Filamentous fusion phage: novel expression vectors that display cloned antigens on the virion surface. Science. 1985;228:1315–1317. doi: 10.1126/science.4001944. [DOI] [PubMed] [Google Scholar]
- 21.Kehoe JW, Kay BK. Filamentous phage display in the new millennium. Chem Rev. 2005;105:4056–4072. doi: 10.1021/cr000261r. [DOI] [PubMed] [Google Scholar]
- 22.McCafferty J, Griffiths AD, Winter G, Chiswell DJ. Phage antibodies: filamentous phage displaying antibody variable domains. Nature. 1990;348:552–554. doi: 10.1038/348552a0. [DOI] [PubMed] [Google Scholar]
- 23.Bradbury AR, Marks JD. Antibodies from phage antibody libraries. J Immunol Methods. 2004;290:29–49. doi: 10.1016/j.jim.2004.04.007. [DOI] [PubMed] [Google Scholar]
- 24.Hoogenboom HR. Selecting and screening recombinant antibody libraries. Nat Biotechnol. 2005;23:1105–1116. doi: 10.1038/nbt1126. [DOI] [PubMed] [Google Scholar]
- 25.Marks JD, Hoogenboom HR, Bonnert TP, McCafferty J, Griffiths AD, Winter G. By-passing immunization. Human antibodies from V-gene libraries displayed on phage. J Mol Biol. 1991;222:581–597. doi: 10.1016/0022-2836(91)90498-u. [DOI] [PubMed] [Google Scholar]
- 26.Kay BK, Kasanov J, Yamabhai M. Screening phage-displayed combinatorial peptide libraries. Methods. 2001;24:240–246. doi: 10.1006/meth.2001.1185. [DOI] [PubMed] [Google Scholar]
- 27.Kay BK, Thai S, Volgina V. Biotinylation of protein targets for affinity selection experiments with phage. Methods Mol Biol. 2009;498:185–196. doi: 10.1007/978-1-59745-196-3_13. [DOI] [PMC free article] [PubMed] [Google Scholar]
- 28.Johnson G, Wu TT. Kabat database and its applications: future directions. Nucleic Acids Res. 2001;29:205–206. doi: 10.1093/nar/29.1.205. [DOI] [PMC free article] [PubMed] [Google Scholar]
- 29.Andrade MA, Chacon P, Merelo JJ, Moran F. Evaluation of secondary structure of proteins from UV circular dichroism spectra using an unsupervised learning neural network. Protein Eng. 1993;6:383–390. doi: 10.1093/protein/6.4.383. [DOI] [PubMed] [Google Scholar]
- 30.Antoniou C, Lam VQ, Fung LW-M. Conformational changes at the tetramerization site of erythroid α-spectrin upon binding β-spectra spin label EPR study. Biochemistry. 2008;47:10765–10772. doi: 10.1021/bi800840p. [DOI] [PMC free article] [PubMed] [Google Scholar]
- 31.Lam VQ, Antoniou C, Rolius R, Fung LW-M. Association studies of erythoid alpha-spectrin at the tetramerization site. Br J Haematol. 2009;147:392–395. doi: 10.1111/j.1365-2141.2009.07876.x. [DOI] [PMC free article] [PubMed] [Google Scholar]
- 32.Ipsaro JJ, Harper SL, Messick TE, Marmorstein R, Mondragón A, Speicher DW. Crystal structure and functional interpretation of the erythrocyte spectrin tetramerization domain complex. Blood. 2010;115:4843–4852. doi: 10.1182/blood-2010-01-261396. [DOI] [PMC free article] [PubMed] [Google Scholar]
- 33.Luo BH, Mehboob S, Hurtuk MG, Pipalia NH, Fung LW-M. Important region in the beta-spectrin C-terminus for spectrin tetramer formation. Eur J Haematol. 2001;68:73–79. doi: 10.1034/j.1600-0609.2002.01569.x. [DOI] [PubMed] [Google Scholar]
- 34.Mehboob S, Luo BH, Fu W, Johnson ME, Fung LW-M. Conformational studies of the tetramerization site of human erythroid spectrin by cysteine-scanning spin-labeling EPR methods. Biochemistry. 2005;44:15898–15905. doi: 10.1021/bi051009m. [DOI] [PubMed] [Google Scholar]
- 35.Grum VL, Li D, MacDonald RI, Mondragon A. Structures of two repeats of spectrin suggest models of flexibility. Cell. 1999;98:523–535. doi: 10.1016/s0092-8674(00)81980-7. [DOI] [PubMed] [Google Scholar]
- 36.Song Y, Pipalia NH, Fung LW-M. The L49F mutation in alpha erythroid spectrin induces local disorder in the tetramer association region: fluorescence and molecular dynamics studies of free and bound alpha spectrin. Protein Sci. 2009;18:1916–1925. doi: 10.1002/pro.202. [DOI] [PMC free article] [PubMed] [Google Scholar]
- 37.Midelfort KS, Hernandez HH, Lippow SM, Tidor B, Drennan CL, Wittrop KD. Substantial energetic improvement with minimal structural perturbation in a high affinity mutant antibody. J Mol Biol. 2004;343:685–701. doi: 10.1016/j.jmb.2004.08.019. [DOI] [PubMed] [Google Scholar]
- 38.Carmichael JA, Power BE, Garrett TP, Yazaki PJ, Shively JE, Raubischek AA, Wu AM, Hudson PJ. The crystal structure of an anti-CEA scFv diabody assembled from T84.66 scFvs in VL-to-VH orientation: implications for diabody flexibility. J Mol Biol. 2003;326:341–351. doi: 10.1016/s0022-2836(02)01428-6. [DOI] [PubMed] [Google Scholar]
- 39.Begg GE, Morris MB, Ralston GB. Comparison of the salt-dependent self-association of brain and erythroid spectrin. Biochemistry. 1997;36:6977–6985. doi: 10.1021/bi970186n. [DOI] [PubMed] [Google Scholar]
- 40.Mehboob S, Luo BH, Patel BM, Fung LW-M. alpha beta Spectrin coiled coil association at the tetramerization site. Biochemistry. 2001;16:12457–12464. doi: 10.1021/bi010984k. [DOI] [PubMed] [Google Scholar]
- 41.Nicolas G, Pedroni S, Fournier C, Gautero H, Craescu C, Dhermy D, Lecomte MC. Spectrin self-association site: characterization and study of beta-spectrin mutations associated with hereditary elliptocytosis. Biochemistry J. 1998;332:81–89. doi: 10.1042/bj3320081. [DOI] [PMC free article] [PubMed] [Google Scholar]
- 42.Park S, Caffrey MS, Johnson ME, Fung LW-M. Solution structural studies on human erythrocyte α-spectrin tetramerization site. J Biol Chem. 2003;278:21837–21844. doi: 10.1074/jbc.M300617200. [DOI] [PubMed] [Google Scholar]
- 43.Pascual J, Pfuhl M, Walther D, Saraste M, Nilges M. Solution structure of the spectrin repeat: a left-handed antiparallel triple-helical coiled-coil. J Mol Biol. 1997;273:740–751. doi: 10.1006/jmbi.1997.1344. [DOI] [PubMed] [Google Scholar]
- 44.Yan Y, Winograd E, Viel A, Cronin T, Harrison SC, Branton D. Crystal structure of the repetitive segments of spectrin. Science. 1993;262:2027–2030. doi: 10.1126/science.8266097. [DOI] [PubMed] [Google Scholar]
- 45.Davis L, Abdi K, Machius M, Brautigam C, Tomchick DR, Bennett V, Michaely P. Localization and structure of the ankyrin-binding site on β2-spectrin. J Biol Chem. 2009;284:6982–6987. doi: 10.1074/jbc.M809245200. [DOI] [PMC free article] [PubMed] [Google Scholar]
- 46.Prokhorov DA, Timchenko MA, Kudrevatykh YA, Fediukina DV, Gushchina LV, Khristoforov VS, Filimonov VV, Kutyshenko VP. Study of the structure and dynamics of a chimeric variant of the SH3 domain (SHA-Bergerac) by NMR spectroscopy. Russ J Bioorg Chem. 2008;35:578–585. doi: 10.1134/s1068162008050075. [DOI] [PubMed] [Google Scholar]
- 47.Gushchina LV, Gabdulkhakov AG, Nikonov SV, Mateo PL, Filimonov VV. Structural and thermodynamic studies of Bergerac-SH3 chimeras. Biophys Chem. 2009;139:106–115. doi: 10.1016/j.bpc.2008.10.011. [DOI] [PubMed] [Google Scholar]
- 48.Chevelkov V, Faelber K, Diehl A, Heinemann U, Oschkinat H, Reif B. Detection of dynamic water molecules in a microcrystalline sample of the SH3 domain of alpha-spectrin by MAS solid-state NMR. J Biomol NMR. 2005;31:295–310. doi: 10.1007/s10858-005-1718-z. [DOI] [PubMed] [Google Scholar]
- 49.Bignone PA, King MD, Pinder JC, Baines AJ. Phosphorylation of a threonine unique to the short C-terminal isoform of betaII-spectrin links regulation of alpha-beta spectrin interaction to neuritogenesis. J Biol Chem. 2007;282:888–896. doi: 10.1074/jbc.M605920200. [DOI] [PubMed] [Google Scholar]
- 50.Pei X, Guo X, Coppel R, Bhattacharjee S, Haldar K, Gratzer W, Mohandas N, An X. The ring-infected erythrocyte surface antigen of Plasmodium falciparum stabilizes spectrin tetramers and suppresses further invasion. Blood. 2007;110:1036–1042. doi: 10.1182/blood-2007-02-076919. [DOI] [PMC free article] [PubMed] [Google Scholar]
- 51.de Matteis MA, Morrow JS. Spectrin tethers and mesh in the biosynthetic pathway. J Cell Sci. 2000;113:2331–2343. doi: 10.1242/jcs.113.13.2331. [DOI] [PubMed] [Google Scholar]
- 52.Morrow JS, Rimm DL, Kennedy SP, Cianci CD, Sinard JH, Weed SA. Of membrane stability and mosaics: the spectrin cytoskeleton. In: Hoffman J, Jamieson J, editors. Handbook of physiology. London: Oxford University Press; 1997. pp. 485–540. [Google Scholar]
- 53.Legendre K, Safieddine S, Küssel-Andermann P, Petit C, El-Amraoui A. alphaII-betaV spectrin bridges the plasma membrane and cortical lattice in the lateral wall of the auditory outer hair cells. J Cell Sci. 2008;121:3347–3356. doi: 10.1242/jcs.028134. [DOI] [PubMed] [Google Scholar]
- 54.Blikstad I, Nelson WJ, Moon RT, Lazarides E. Synthesis and assembly of spectrin during avian erythropoiesis: stoichiometric assembly but unequal synthesis of α and β spectrin. Cell. 1983;32:1081–1091. doi: 10.1016/0092-8674(83)90292-1. [DOI] [PubMed] [Google Scholar]
- 55.Moon RT, Lazarides E. β-spectrin limits α-spectrin assembly on membranes following synthesis in a chicken erythroid cell lysate. Nature. 1983;305:62–65. doi: 10.1038/305062a0. [DOI] [PubMed] [Google Scholar]
- 56.Parkinson NJ, Olsson CL, Hallows JL, McKee-Johnson J, Keogh BP, Noben-Trauth K, Kujawa SG, Tempel BL. Mutant β-spectrin 4 causes auditory and motor neuropathies in quivering mice. Nat Genet. 2001;29:61–65. doi: 10.1038/ng710. [DOI] [PubMed] [Google Scholar]
- 57.Bliss JM, Sullivan MA, Malone J, Haidaris CG. Differentiation of Candida albicans and Candida dubliniensis by using recombinant human antibody single-chain variable fragments specific for hyphae. J Clin Microbiol. 2003;41:1152–1160. doi: 10.1128/JCM.41.3.1152-1160.2003. [DOI] [PMC free article] [PubMed] [Google Scholar]
- 58.Scholle MD, Kehoe JW, Kay BK. Efficient construction of a large collection of phage-displayed combinatorial peptide libraries. Comb Chem High Throughput Screen. 2005;8:545–551. doi: 10.2174/1386207054867337. [DOI] [PubMed] [Google Scholar]
- 59.Rider JE, Adey NB, Sparks AB, Kay BK. Microbiological methods. In: Kay BK, Winter J, McCafferty J, editors. Phage display of peptides and proteins: a laboratory manual. San Diego: Academic Press; 1996. pp. 55–65. [Google Scholar]
- 60.Lequin RM. Enzyme immunoassay (EIS)/enzyme-linked immunosorbent assay (ELISA) Clin Chem. 2005;51:2415–2418. doi: 10.1373/clinchem.2005.051532. [DOI] [PubMed] [Google Scholar]
- 61.Karatan E, Merguerian M, Han Z, Scholle MD, Koide S, Kay BK. Molecular recognition properties of FN3 monobodies that bind the Src SH3 domain. Chem Biol. 2004;11:835–844. doi: 10.1016/j.chembiol.2004.04.009. [DOI] [PubMed] [Google Scholar]
- 62.Cheng YC, William HP. Relationship between the inhibition constant (KI) and the concentration of inhibitor which causes 50 percent inhibition (IC50) of an enzymatic reaction. Biochem Pharm. 1973;22:3099–3108. doi: 10.1016/0006-2952(73)90196-2. [DOI] [PubMed] [Google Scholar]
- 63.Simmons LC, Reilly D, Klimowski L, Raju TS, Meng G, Sims P, Hong K, Shields RL, Damico LA, Rancatore P, Yansur DG. Expression of full-length immunoglobulins in Escherichia coli: rapid and efficient production of aglycosylated antibodies. J Immunol Methods. 2002;263:133–147. doi: 10.1016/s0022-1759(02)00036-4. [DOI] [PubMed] [Google Scholar]
- 64.Martin CD, Rojas G, Mitchell JN, Vincent KJ, Wu J, McCafferty J, Schofield DJ. A simple vector system to improve performance and utilisation of recombinant antibodies. BMC Biotechnol. 2006;6:46. doi: 10.1186/1472-6750-6-46. [DOI] [PMC free article] [PubMed] [Google Scholar]
- 65.Bates PA, Kelley LA, MacCallum RM, Sternberg MJ. Enhancement of protein modeling by human intervention in applying the automatic programs 3D-JIGSAW and 3D-PSSM. Proteins. 2001;5(Suppl):39–46. doi: 10.1002/prot.1168. [DOI] [PubMed] [Google Scholar]
- 66.Hess B, Kutzner C, van der Spoel D, Lindahl E. GROMACS 4: algorithms for highly efficient, load-balanced, and scalable molecular simulation. J Chem Theory Comput. 2008;4:435–447. doi: 10.1021/ct700301q. [DOI] [PubMed] [Google Scholar]