Abstract
Rats are widely used for the studies of pulmonary toxicology in both juveniles and adults. To facilitate such studies, investigators have developed models of lung architecture based on manual or computerized airway measurements. However, postnatal growth of conducting airways of rat lungs has never been reported. In this paper, we present conducting airway architecture statistics for male Sprague–Dawley rat lungs at ages 15, 28, 40, and 81 days by analyzing CT images from airway silicon casts. Detailed branching characteristics and intersubject variance are presented. This study shows that (i) airway growth in diameter and length is not linear with age, (ii) growth of airway length is faster than that of diameter during the 15–81-day postnatal period, and (iii) asymmetry in airway diameter (ratio of major to minor daughter diameter) increases with age.
Keywords: conducting airways, computed tomography image, lung growth, Sprague–Dawley rats
Introduction
Lung development disruption due to air pollution is attracting growing attention because children could be susceptible to air pollution insults via different mechanisms than adults are. For example, exposure to air pollution can cause irreversible disruption in the lung development, which is not as much of a concern for adults. Epidemiology studies suggest that adverse health effects due to air pollution can begin at early ages. Chronic exposure to air pollution is associated with reduced lung function (Künzli et al. 1997; Frischer et al. 1999; Peters et al. 1999; Avol et al. 2001; Horak et al. 2002; Gauderman et al. 2004, 2007; Rojas-Martinez et al. 2007). Children who exercise outdoors with high levels of air pollution have a greater risk of developing asthma (Gauderman et al. 2000; Pope et al. 2004). Animal studies show that prenatal and postnatal exposure to air pollutants, including particulate matter, ozone, and tobacco smoke, impairs lung development in structure and function (Mauderly et al. 1987; Ji et al. 1997; Finkelstein & Johnston, 2004; Fanucchi et al. 2006; Mauad et al. 2008; Avdalovic et al. 2009; Lee et al. 2010).
Rats are widely used for studies of pulmonary toxicology, and details of rat lung architecture in the bronchial region have been obtained from manual airway measurements (Raabe et al. 1976; Yeh et al. 1979; Phillips & Kaye, 1995) and computerized analysis of lung CT images (Sera et al. 2003; Tawhai et al. 2004; Lee et al. 2008a,b;). There have been many studies on the development of rat lungs (Pinkerton et al. 1982; Bruce & Lo, 1991; Mizuuchi et al. 1994; Mauderly, 2000; Burri, 2006), and Blanco (1992) suggested a quantitative model of postnatal formation of alveoli in rat lung. However, to our knowledge, there are no or very limited data for tracheobronchial airway architecture of rats at young ages and the corresponding course of development.
In this study airway size and branching patterns in the bronchial region of male Sprague–Dawley rats at 15, 28, 40, and 81 days of age are presented using computerized analysis of lung cast computed tomography (CT) images (Lee et al. 2008a,b;). Details of airway enlargement and changes in branching characteristics are described for each postnatal age studied. This study will aid in constructing realistic airway models at different ages and studies of pulmonary toxicology during lung development.
Materials and methods
Preparation of airway cast
Male Sprague–Dawley rats were delivered at specific ages 3 days prior to necropsy from Harlan Livermore (Livermore, CA, USA) where they were housed in protective barriers and routinely screened for common viral and bacterial pathogens. The animals were provided with 2018S rodent diet and microfiltered water ad libitum, and were housed in a HEPA filtered barrier. After the animals were delivered, they were housed in filtered air on Harlan 7084 pelleted bedding and provided with filtered water and Purina Lab Chow 5001 ad libitum until necropsy in Association for Assessment and Accreditation of Laboratory Animal Care-approved facilities.
Animals were euthanized with an injection of pentobarbital administered at a dosage of 0.5 mL kg–1 of body weight at 15, 28, 40, or 81 days after birth. Lungs were fixed in the chest via tracheal cannula with Karnovsky's fixative at 30 cm H2O pressure for 1 h, then removed from the chest and stored in fixative. Fixed lungs were placed in buffered saline prior to casting. Room temperature vulcanization (RTV) silicone was introduced to the lung through the trachea under a slight negative pressure (−80 mmHg) until it reached the distal airways. This study focuses on bronchial airway growth, so the casting was stopped before the silicone RTV fill the alveoli. The silicone RTV was allowed to cure for 48 h, after which the airway tissue was removed with bleach (details in Lee et al. 2008a).
Lung architecture analysis
Lung casts were imaged using a commercially available microCT scanner, MicroCAT II (Siemens, Knoxville, TN, USA) in high resolution mode. The image was reconstructed using the Feldkamp reconstruction algorithm with corresponding pixel size of 53 μm for 81-day-old rats and 28.6 μm otherwise. Image resolution was 49 μm for 53-μm pixel images and 32 μm for 28.6-μm ones. Using a constant ratio of image resolution to airway size for each age would improve the consistency of the analysis. Generation-average airway diameter from a fine-resolution image could be a little smaller than that from a coarser image because some of the smallest airways may be lost due to the coarseness of the image, but the difference was not significant (< 5%) in our test using a 81-day lung cast.
Custom software was employed to extract from these CT images the branching patterns of conducting airways, including airway diameter, length, branching angle, rotation angle and connectivity between airways (Lee et al. 2008a,b, 2010). The custom software finds the best fit of a flexible bifurcation model to each airway of the CT image and produces an average error between the model and actual airway. This error increases when the airway size is comparable to pixel size or the software fails to find reasonable fit. Branching angle is defined as the angle between parent branch and its daughter branch. Rotation angle is defined as the angle between successive bifurcation planes, where the bifurcation plane is defined by a parent branch and its two daughters. Using computerized analysis of lung cast CT images, most conducting airways were measured. Airways were excluded from analysis for two reasons: (i) the error normalized by airway radius was > 20% or (ii) the airway radius was smaller than two pixels.
Results
Table 1 shows body weight change with age and total number of airways analyzed in this study. Figure 1 shows lung casts at postnatal ages of 15, 28, 40, and 81 days.
Table 1.
Body weight change with age and total number of airways analyzed in this study. Number of airways indicates the average number of airways per rat analyzed. This number does not show the change in the number of airways during growth. The difference in the number of airways between ages may depend on the casting condition and image resolution. More airways would be lost in the analysis for age 15 and 81 days because their pixel size compared to their airways is larger than that for 28 and 40 days
| Postnatal age (days) | Body weight (g) | Number of subjects | Number of airways |
|---|---|---|---|
| 15 | 24.6 ± 2.9 | 7 | 4087 |
| 28 | 66.9 ± 10.8 | 6 | 4898 |
| 40 | 150.3 ± 8.6 | 6 | 5069 |
| 81 | 381.4 ± 13.6 | 8 | 4393 |
Fig. 1.
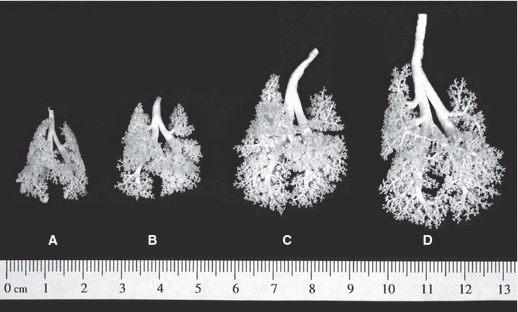
Lung casts at postnatal ages of (A) 15, (B) 28, (C) 40, and (D) 81 days.
Airway diameter and length as a function of generation with age
Airway diameter and length as a function of Weibel generation (Weibel, 1963) at each age are presented in Tables 2 and 3. Figure 2 shows airway growth in (A,B) diameter and (C,D) length as a function of age. Both diameter and length grow nonlinearly with age in most generations except for distal generations, where the diameter grows quite linearly with age. Airway length grows with a very similar pattern in generations larger than four (Fig. 2D). The intersubject standard deviation of diameter and length is about 6 and 10% of the average, respectively. Figure 2A,D indicates that proximal diameter and distal length grow much faster before 40 days of age than after.
Table 2.
Airway diameter (mm) as a function of generation at ages 15, 28, 40, and 81 days. The first, second, and third columns for each age are average diameter, intrasubject standard deviation, and intersubject standard deviation, respectively
| 15 days | 28 days | 40 days | 81 days | |||||||||
|---|---|---|---|---|---|---|---|---|---|---|---|---|
| Gen no. | Average | Intra- | Inter- | Average | Intra- | Inter- | Average | Intra- | Inter- | Average | Intra- | Inter- |
| 0 | 1.8016 | 0 | 0.1244 | 2.3313 | 0 | 0.2787 | 2.7077 | 0 | 0.185 | 3.1535 | 0 | 0.1924 |
| 1 | 1.5557 | 0.1242 | 0.1525 | 2.0694 | 0.2293 | 0.203 | 2.2906 | 0.1802 | 0.3147 | 2.6505 | 0.2229 | 0.1764 |
| 2 | 1.3731 | 0.3809 | 0.1389 | 1.6566 | 0.4808 | 0.2911 | 1.9291 | 0.502 | 0.1756 | 2.3426 | 0.6335 | 0.1408 |
| 3 | 0.9257 | 0.447 | 0.1243 | 1.1779 | 0.5028 | 0.1741 | 1.4984 | 0.5976 | 0.1831 | 1.8029 | 0.7007 | 0.1574 |
| 4 | 0.7277 | 0.4357 | 0.0835 | 0.9193 | 0.4853 | 0.1255 | 1.0392 | 0.5617 | 0.1118 | 1.3098 | 0.6887 | 0.1128 |
| 5 | 0.5092 | 0.3643 | 0.0331 | 0.6198 | 0.4045 | 0.0482 | 0.7611 | 0.4969 | 0.0535 | 0.9008 | 0.5733 | 0.0815 |
| 6 | 0.3847 | 0.268 | 0.0222 | 0.4924 | 0.3197 | 0.0355 | 0.5681 | 0.3922 | 0.0166 | 0.6863 | 0.4826 | 0.0417 |
| 7 | 0.3096 | 0.1965 | 0.0121 | 0.3847 | 0.2329 | 0.0145 | 0.4514 | 0.2992 | 0.0144 | 0.5513 | 0.3688 | 0.043 |
| 8 | 0.261 | 0.1542 | 0.007 | 0.3321 | 0.1896 | 0.0049 | 0.3816 | 0.2331 | 0.012 | 0.4714 | 0.3047 | 0.032 |
| 9 | 0.2337 | 0.1258 | 0.007 | 0.292 | 0.1491 | 0.0038 | 0.3363 | 0.19 | 0.0066 | 0.4176 | 0.2742 | 0.0241 |
| 10 | 0.217 | 0.1072 | 0.0085 | 0.2711 | 0.1311 | 0.0073 | 0.3104 | 0.1674 | 0.0072 | 0.3857 | 0.2326 | 0.016 |
| 11 | 0.2059 | 0.0928 | 0.0058 | 0.2525 | 0.1141 | 0.0042 | 0.2925 | 0.1439 | 0.0091 | 0.3654 | 0.2077 | 0.0113 |
| 12 | 0.1999 | 0.0809 | 0.0055 | 0.2436 | 0.1056 | 0.0052 | 0.2783 | 0.1335 | 0.0097 | 0.3544 | 0.1816 | 0.016 |
| 13 | 0.1914 | 0.0716 | 0.0051 | 0.2371 | 0.0947 | 0.0042 | 0.2707 | 0.1214 | 0.0101 | 0.3469 | 0.1769 | 0.0156 |
| 14 | 0.1894 | 0.0653 | 0.0044 | 0.2307 | 0.09 | 0.0073 | 0.2609 | 0.1101 | 0.0115 | 0.3392 | 0.1572 | 0.0142 |
| 15 | 0.1846 | 0.059 | 0.0056 | 0.2275 | 0.081 | 0.0097 | 0.2561 | 0.1013 | 0.0138 | 0.3329 | 0.1456 | 0.0143 |
| 16 | 0.1815 | 0.0533 | 0.0037 | 0.221 | 0.0707 | 0.0091 | 0.2477 | 0.0924 | 0.0119 | 0.3249 | 0.1282 | 0.0155 |
| 17 | 0.1765 | 0.047 | 0.0062 | 0.2172 | 0.0605 | 0.0092 | 0.2393 | 0.0855 | 0.01 | 0.317 | 0.1232 | 0.018 |
| 18 | 0.1794 | 0.0473 | 0.0051 | 0.2105 | 0.0565 | 0.0125 | 0.2362 | 0.0819 | 0.013 | 0.3138 | 0.1244 | 0.0132 |
| 19 | 0.1757 | 0.0433 | 0.0065 | 0.2071 | 0.0549 | 0.0095 | 0.2295 | 0.0738 | 0.0136 | 0.3109 | 0.1019 | 0.0134 |
| 20 | 0.1713 | 0.0404 | 0.0083 | 0.2029 | 0.0484 | 0.0097 | 0.2293 | 0.0734 | 0.0099 | 0.3007 | 0.0996 | 0.012 |
| 21 | 0.169 | 0.0352 | 0.0071 | 0.192 | 0.0425 | 0.0171 | 0.2269 | 0.0701 | 0.0107 | 0.298 | 0.0806 | 0.0177 |
| 22 | 0.1692 | 0.0346 | 0.0112 | 0.1883 | 0.041 | 0.0139 | 0.2256 | 0.064 | 0.0125 | 0.2915 | 0.0726 | 0.0197 |
| 23 | 0.1627 | 0.0325 | N/A | 0.198 | 0.045 | 0.0065 | 0.2206 | 0.063 | 0.015 | 0.2904 | 0.0689 | 0.0172 |
| 24 | N/A | N/A | N/A | 0.194 | 0.045 | 0.002 | 0.241 | 0.068 | 0.012 | 0.2886 | 0.068 | 0.0193 |
Table 3.
Airway length (mm) as a function of generation at ages 15, 28, 40, and 81 days. The first, second, and third columns are average length, intrasubject standard deviation, and intersubject standard deviation, respectively
| 15 days | 28 days | 40 days | 81 days | |||||||||
|---|---|---|---|---|---|---|---|---|---|---|---|---|
| Gen no. | Average | Intra- | Inter- | Average | Intra- | Inter- | Average | Intra- | Inter- | Average | Intra- | Inter- |
| 1 | 3.5117 | 0.9733 | 0.533 | 4.3064 | 1.1874 | 0.8327 | 6.5333 | 1.748 | 1.8455 | 8.0787 | 2.5753 | 0.3372 |
| 2 | 1.5618 | 0.3531 | 0.159 | 2.3348 | 0.5505 | 0.4156 | 2.871 | 0.6663 | 0.1893 | 3.7813 | 0.9456 | 0.4266 |
| 3 | 1.4536 | 0.6678 | 0.4646 | 1.7146 | 0.8068 | 0.2835 | 1.9327 | 0.856 | 0.2457 | 2.6508 | 1.1027 | 0.4248 |
| 4 | 0.9897 | 0.8726 | 0.19 | 1.3395 | 0.8854 | 0.2461 | 1.4759 | 0.9574 | 0.232 | 1.979 | 1.371 | 0.2468 |
| 5 | 0.657 | 0.4402 | 0.0845 | 0.8123 | 0.4099 | 0.0908 | 1.073 | 0.6626 | 0.1229 | 1.341 | 0.9404 | 0.1359 |
| 6 | 0.5224 | 0.3869 | 0.0427 | 0.6911 | 0.4719 | 0.0492 | 0.8175 | 0.5001 | 0.0831 | 1.0079 | 0.6406 | 0.0835 |
| 7 | 0.424 | 0.2935 | 0.045 | 0.5289 | 0.2991 | 0.0371 | 0.7004 | 0.4398 | 0.0441 | 0.856 | 0.5514 | 0.0628 |
| 8 | 0.3663 | 0.23 | 0.017 | 0.4839 | 0.2898 | 0.0231 | 0.6088 | 0.3912 | 0.031 | 0.7393 | 0.4638 | 0.0611 |
| 9 | 0.3393 | 0.2043 | 0.0179 | 0.4382 | 0.2358 | 0.0382 | 0.5644 | 0.3655 | 0.0512 | 0.6665 | 0.3776 | 0.044 |
| 10 | 0.3278 | 0.2096 | 0.0221 | 0.4117 | 0.2462 | 0.0233 | 0.5148 | 0.2984 | 0.0249 | 0.6444 | 0.3768 | 0.0401 |
| 11 | 0.3105 | 0.1827 | 0.0195 | 0.3905 | 0.2229 | 0.0222 | 0.5137 | 0.3082 | 0.0218 | 0.6194 | 0.3916 | 0.025 |
| 12 | 0.2984 | 0.1713 | 0.0252 | 0.3971 | 0.2436 | 0.0163 | 0.4935 | 0.2988 | 0.0169 | 0.5932 | 0.3555 | 0.0425 |
| 13 | 0.2999 | 0.1643 | 0.0125 | 0.3766 | 0.2022 | 0.0212 | 0.455 | 0.2516 | 0.0327 | 0.5855 | 0.3306 | 0.0222 |
| 14 | 0.2773 | 0.143 | 0.0192 | 0.3621 | 0.2014 | 0.0337 | 0.4488 | 0.2527 | 0.0255 | 0.5597 | 0.3245 | 0.0316 |
| 15 | 0.2601 | 0.1317 | 0.0189 | 0.3616 | 0.2055 | 0.0344 | 0.4364 | 0.2373 | 0.0391 | 0.5548 | 0.3325 | 0.0433 |
| 16 | 0.2598 | 0.1347 | 0.0204 | 0.3397 | 0.1893 | 0.0174 | 0.4062 | 0.2184 | 0.0254 | 0.5313 | 0.2873 | 0.0435 |
| 17 | 0.2497 | 0.1222 | 0.0118 | 0.3241 | 0.1685 | 0.0391 | 0.406 | 0.2311 | 0.0423 | 0.5275 | 0.2982 | 0.0397 |
| 18 | 0.2502 | 0.1213 | 0.042 | 0.3128 | 0.1538 | 0.03 | 0.3799 | 0.2228 | 0.031 | 0.5152 | 0.2911 | 0.0322 |
| 19 | 0.2406 | 0.117 | 0.0219 | 0.2976 | 0.1394 | 0.0271 | 0.373 | 0.1944 | 0.0261 | 0.4831 | 0.2577 | 0.0558 |
| 20 | 0.221 | 0.093 | 0.0258 | 0.2835 | 0.1472 | 0.0435 | 0.3733 | 0.2125 | 0.0493 | 0.4679 | 0.2289 | 0.0624 |
| 21 | 0.208 | 0.0757 | 0.0255 | 0.2767 | 0.1425 | 0.0447 | 0.3475 | 0.1982 | 0.0435 | 0.4778 | 0.2334 | 0.0457 |
| 22 | 0.1675 | 0.0544 | 0.003 | 0.3162 | 0.1619 | 0.0442 | 0.3877 | 0.178 | 0.0711 | 0.4548 | 0.2009 | 0.0355 |
| 23 | N/A | N/A | N/A | 0.301 | 0.1459 | 0.0057 | 0.417 | 0.2308 | N/A | 0.4734 | 0.2345 | 0.0254 |
| 24 | N/A | N/A | N/A | 0.2578 | 0.1085 | N/A | 0.4621 | 0.2322 | N/A | 0.3903 | 0.166 | 0.0328 |
Fig. 2.
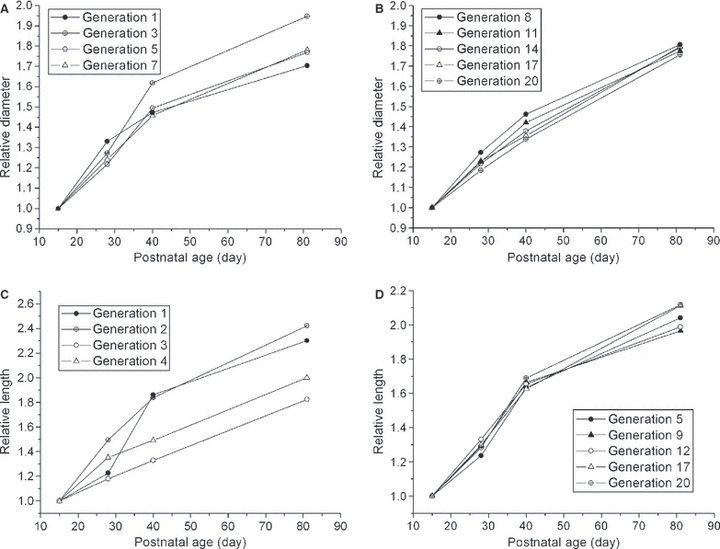
(A,B) Diameter and (C,D) length as a function of age. Both diameter and length are normalized by diameter and length at age 15 days. (A) and (B) show generations from 0 to 7 and 8 to 20 respectively and (C) and (D) show generations from 1 to 4 and 5 to 20, respectively. Only representative generations are shown in the figures.
Figure 3 shows the percent increase in airway diameter and length at 28, 40, and 81 days of age compared to age 15. From 15 to 40 days, proximal airway diameter grows faster than distal, whereas from 40 to 81 days, distal diameter grows much faster than proximal (Fig. 3A). From 15 to 28 days of age, airway diameter and length enlarge at a similar rate, whereas after 28 days, growth in length is faster than in diameter. On the whole, length grows 20% more than diameter over the 15–81 day period.
Fig. 3.
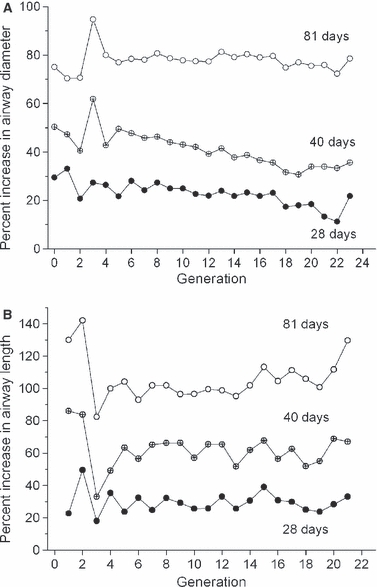
Percentage change of (A) diameter and (B) length relative to age 15 days.
For all ages studied, intra-subject variations in airway size were very large, which is consistent with previous study (Majumdar et al. 2005). Large intra-subject variations result from the highly monopodial structure (a main branch with much smaller side branches) of rat airways. In contrast, intersubject variations in the airway size were very small.
It is well known that the ratio of major to minor daughter diameter (asymmetry) is large in the proximal airways, whereas the diameters of two daughters become similar (more symmetric) in distal ones (Phillips & Kaye, 1995; Lee et al. 2008b). This trend is the same for all ages studied but asymmetry becomes larger as the lung grows. Asymmetry at 81 days of age significantly increases relative to age 15 (P-value smaller than 0.05) in 12 distal generations among 22 studied and in four generations among 22 after Bonferroni correction, which indicates that major airways grow faster than minor ones (Fig. 4). P-value was calculated from Student's t-test.
Fig. 4.
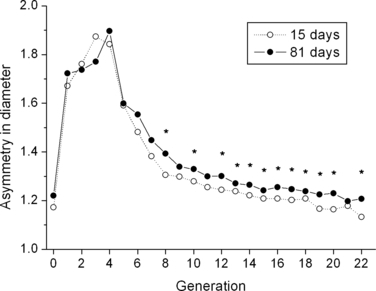
Ratio of major to minor daughter diameter (asymmetry) as a function of generation at age 15 and 81 days. *Asymmetry at age 81 is significantly larger than that of age 15 (P-value is < 0.05).
Airway length to diameter ratio (L/d) is correlated with the ratio of daughter to parent diameter (d/dp) (Fig. 5). This correlation is useful for constructing airway tree models. Length to diameter ratio at age 81 days is significantly larger than that at 15 days due to the larger growth in length compared to diameter (Fig. 3A,B).
Fig. 5.
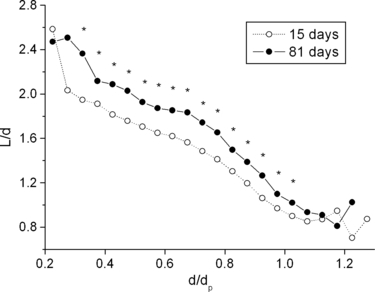
Length to diameter ratio (L/d) as a function of the ratio of airway diameter to its parent diameter (d/dp) at age 15 and 81 days. *Asymmetry at age 81 is significantly larger than that of age 15 days (P-value is < 0.05).
Branching angle, rotation angle, and gravity angle
Figure 6A,B shows branching and rotation angle, respectively, as a function of generation at each age. Branching angles are similar for different generations. Rotation angles are smaller in the most proximal two generations, indicating that the first few airways branch rather in-plane, whereas in subsequent generations they branch more out-of-plane. Neither branching or rotation angle change with postnatal growth. Gravity angle also did not change with age (figure not presented); average gravity angles are 84.9, 86.0, 87.6, and 86.8 at age 15, 28, 40, and 81, respectively. These values are slightly smaller than the value of 87.6 from Raabe et al. (1976). In our work, gravity angle was calculated by assuming that the angle between trachea and gravity was 86° (Yeh et al. 1979).
Fig. 6.
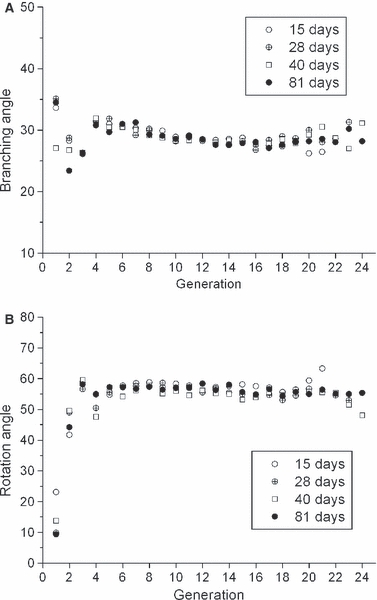
(A) Branching angle as a function of generation. (B) Rotation angle as a function of generation.
Previous studies (Sera et al. 2003; Lee et al. 2008b) showed that bifurcation angle is correlated with the ratio of daughter to parent diameter (d/dp). Branching angle decreases almost linearly with d/dp, indicating that minor daughters turn more sharply than major ones, which is common for all the ages in this study (Fig. 7). In conclusion, conducting airway branching characteristics do not change significantly during postnatal growth.
Fig. 7.
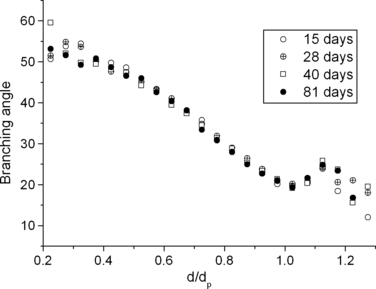
Branching angle as a function of the ratio of airway diameter to its parent diameter (d/dp).
Discussion
Figure 8 compares this and previous studies (Raabe et al. 1976; Sera et al. 2003) on adult rats. Our data for airway diameter and length from 81-day-old rat lungs are very close to female data from Raabe et al. (1976). In Raabe's data, the difference between gender was negligible, although measurements of the male rat were not complete. Our analysis was further verified by comparing Raabe's data (1976) with CT image analysis of a rat cast used in the Raabe's study (1976).
Fig. 8.
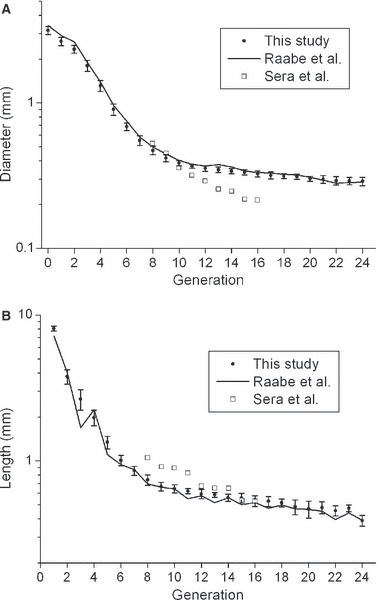
Comparison to previous studies. (A) Airway diameter by generation. (B) Airway length by generation. Error bars indicate intersubject standard deviation.
For human lungs, Phalen et al. (1985) found that airway lengths and diameters in the tracheobronchial region are linearly correlated with body length (length from nose to rump) and a recent study by Rao et al. (2010) showed that luminal cross-sectional area grows linearly with body length at the trachea and the next four airway segments. Hieronymi (1961) indicated that proximal and distal airways grow equally but their diameters enlarge slightly faster than lengths up to 5 months. After 1 year, distal airway growth is 12–13% faster than proximal, and the increase in diameter is less than the increase in length. On the other hand, Hislop et al. (1972) indicated that each individual branch grows in a symmetrical fashion both in length and in diameter, and bears a constant relation to the whole. Horsfield (1977) investigated airways growth of dog lungs, indicating that the postnatal growth of the conducting airways of dog lungs is in constant proportion, both with respect to diameter and length.
We could not directly investigate the relation between airways growth and body length as we did not measure body length in this study; instead, in our study body length was estimated using the relationship between body length and body weight of Wistar rats (Pullen, 1976). Both airway diameter and length are linearly correlated with body length, especially in distal generations; for generations between 0 and 5, R2 from the linear regression for diameter and length were 0.7735–0.878 and 0.6422–0.8681, respectively and for generations over 5, R2 for diameter and length were 0.915–0.969 and 0.8128–0.958, respectively (see also Fig. 9). For generations < 5, diameter squared varies linearly with body length somewhat better compared with diameter, in agreement with Rao et al. (2010). Body length had a linear relationship with the square root of body weight for Wistar rats (Pullen, 1976). Therefore if this linearity is not true for Sprague–Dawley rats, the relationship between airway size and body length discussed above will not necessarily hold.
Fig. 9.
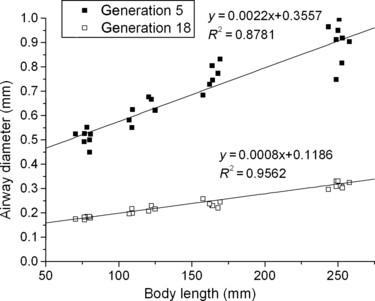
Airway diameter vs. body length estimated from Wistar rats (Pullen 1976). Generation 5 and 18 demonstrate that airway diameter varies linearly with body length.
Our data show that diameter growth in proximal airways is not linear with age, whereas diameter growth in distal airways is quite linear with age. Also, after 28–40 days of age, diameters of distal airways enlarge faster than proximal ones and length growth is larger than diameter growth, which is similar in human lungs (Hieronymi, 1961) but not in dog lungs (Horsfield, 1977). As discussed by Phalen et al. (1985), disagreement on airway growth patterns may be due to differences in techniques used, variability between individuals, and sampling problems. Computerized techniques used in our study made it possible to analyze enough subjects and nearly all conducting airways for each subject.
It is interesting that bronchial airway growth seems to parallel alveolar development. Growth rate in airway diameter varies linearly with the cube root of the total alveoli volume; diameter ratios at 28, 40, and 81 days compared to 15 days are about 1.21, 141, and 1.79 and the ratios of cube root of the total alveoli volume at 28, 40, and 81 days compared to 15 days are 1.27, 1.47, 1.88, respectively (Blanco, 1992). Increase in both the alveolus volume and the number of alveoli contributes to the increase of total alveolar volume; average alveolus volume is 3.3, 4.3, 5.3, and 7.9 (× 10−5 mm3) and number of alveoli is 24.5, 38.5, 48, and 68 (× 106) at 15, 28, 40, and 81 days, respectively (Blanco, 1992).
Differences and similarities in human and rat lungs should be carefully considered when rats are used as models in the toxicology studies. Postnatal lung development in humans and rats was well reviewed by Burri (2006). In humans, alveolarization begins in utero and 85% of alveoli are formed postnatally and are completed at 2–3 years of age (Kotecha, 2000; Burri, 2006). The rat lung is just a little less mature at birth than the human lung and undergoes the same developmental steps postnatally. At birth, in rats, the gas-exchange units are large, thick-walled structure termed saccules (Burri, 1974). About day 4 after birth, septal subdivision of these saccules starts forming the alveoli and the septation should be completed during the first two postnatal weeks but alveoli continue to be formed up to 60 days of age (Burri, 1974; Blanco et al. 1989). For both human and rat lungs, it is believed that the branching process in the bronchial region completes at birth. Bronchial airways grow linearly with body length until 16–20 years old and airway growth is more rapid from birth to 2 years old than thereafter (Phalen et al. 1985). Considering the postnatal airway growth and alveolarization process, 2-week-old rats would correspond fairly well to 2-year-old humans and it seems reasonable to regard rats as adults from about 60 days after birth.
Even with these similarities in postnatal lung development in rat and human, the rat lung is quite different from the human lung in many aspects. Human lungs have a very symmetric branching structure, whereas rat lung has a highly monopodial structure (Raabe et al. 1976). Particle clearance in rat lung is much faster than in human lung (Donovan & Zhou, 1995). The rat nose is more efficient at trapping particles than the human nose, and minute ventilation per body mass for rat is much greater than for human (Phalen & Mendez, 2009).
In this study, we present details of conducting airways growth data by analyzing rat lung casts aged from 15 to 81 days. The conducting airways of the infant rats are not simply a miniature of those in the adult. Airways growth is not uniform with respect to diameter and length or with respect to distal and proximal regions.
Acknowledgments
Although the research described in the article has been funded in part by the United States Environmental Protection Agency through grant RD-83241401-0 to the University of California, Davis, it has not been subject to the Agency's required peer and policy review and therefore does not necessarily reflect the views of the Agency and no official endorsement should be inferred.
References
- Avdalovic M, Putney L, Tyler N, et al. In utero and postnatal exposure to environmental tobacco smoke (ETS) alters alveolar and respiratory bronchiole (RB) growth and development in infant monkeys. Toxicol Pathol. 2009;37:256–263. doi: 10.1177/0192623308330788. [DOI] [PubMed] [Google Scholar]
- Avol EL, Gauderman WJ, Tan SM, et al. Respiratory effects of relocating to areas of differing air pollution levels. Am J Respir Crit Care Med. 2001;164:2067–2072. doi: 10.1164/ajrccm.164.11.2102005. [DOI] [PubMed] [Google Scholar]
- Blanco LN. A model of postnatal formation of alveoli in rat lung. J Theor Biol. 1992;157:427–446. doi: 10.1016/s0022-5193(05)80662-9. [DOI] [PubMed] [Google Scholar]
- Blanco LN, Massaro GD, Massaro D. Alveolar dimensions and number: developmental and hormonal regulation. Am J Physiol. 1989;257:L240–L247. doi: 10.1152/ajplung.1989.257.4.L240. [DOI] [PubMed] [Google Scholar]
- Bruce MC, Lo PY. A morphometric quantitation of developmental changes in elastic fibers in rat lung parenchyma: variability with lung region and postnatal age. J Lab Clin Med. 1991;117:226–233. [PubMed] [Google Scholar]
- Burri PH. The postnatal growth of the rat lung. III. Morphology. Anat Rec. 1974;180:77–99. doi: 10.1002/ar.1091800109. [DOI] [PubMed] [Google Scholar]
- Burri PH. Structural aspects of postnatal lung development – alveolar formation and growth. Biol Neonate. 2006;89:313–322. doi: 10.1159/000092868. [DOI] [PubMed] [Google Scholar]
- Donovan MD, Zhou M. Drugs effects on in vivo nasal clearance in rats. Int J Pharm. 1995;116:77–79. [Google Scholar]
- Fanucchi MV, Plopper CG, Evans MJ, et al. Cyclic exposure to ozone alters distal airway development in infant rhesus monkeys. Am J Physiol Lung Cell Mol Physiol. 2006;291:L644–L650. doi: 10.1152/ajplung.00027.2006. [DOI] [PubMed] [Google Scholar]
- Finkelstein JN, Johnston CJ. Enhanced sensitivity of the postnatal lung to environmental insults and oxidant stress. Pediatrics. 2004;113:1092–1096. [PubMed] [Google Scholar]
- Frischer T, Studnicka M, Gartner C, et al. Lung function growth and ambient ozone: a three-year population study in school children. Am J Respir Crit Care Med. 1999;160:390–396. doi: 10.1164/ajrccm.160.2.9809075. [DOI] [PubMed] [Google Scholar]
- Gauderman WJ, McConnell R, Gilliland F, et al. Association between air pollution and lung function growth in southern California children. Am J Respir Crit Care Med. 2000;162:1383–1390. doi: 10.1164/ajrccm.162.4.9909096. [DOI] [PubMed] [Google Scholar]
- Gauderman WJ, Avol E, Gilliland F, et al. The effect of air pollution on lung development from 10 to 18 years of age. N Engl J Med. 2004;351:1057–1067. doi: 10.1056/NEJMoa040610. [DOI] [PubMed] [Google Scholar]
- Gauderman WJ, Vora H, McConnell R, et al. Effect of exposure to traffic on lung development from 10 to 18 years of age: a cohort study. Lancet. 2007;369:571–577. doi: 10.1016/S0140-6736(07)60037-3. [DOI] [PubMed] [Google Scholar]
- Hieronymi G. Über den durch das Alter bedingten Formwandel menschlicher Lungen. Ergeh Allg Pathol Anal. 1961;41:1–62. [Google Scholar]
- Hislop A, Muir DCF, Jacobsen M, et al. Postnatal growth and function of the pre-acinar airways. Thorax. 1972;27:265–274. doi: 10.1136/thx.27.3.265. [DOI] [PMC free article] [PubMed] [Google Scholar]
- Horak F, Jr, Studnicka M, Gartner C, et al. Particulate matter and lung function growth in children: a 3-yr follow-up study in Austrian schoolchildren. Eur Respir J. 2002;19:838–845. doi: 10.1183/09031936.02.00512001. [DOI] [PubMed] [Google Scholar]
- Horsfield K. Postnatal growth of the dog's bronchial tree. Respir Physiol. 1977;29:185–191. doi: 10.1016/0034-5687(77)90091-3. [DOI] [PubMed] [Google Scholar]
- Ji CM, Plopper CG, Witschi HP, et al. Exposure to sidestream cigarette smoke alters bronchiolar epithelial cell differentiation in the postnatal rat lung. Am J Respir Cell Mol Biol. 1997;11:312–320. doi: 10.1165/ajrcmb.11.3.8086168. [DOI] [PubMed] [Google Scholar]
- Kotecha S. Lung growth for beginners. Paediatr Respir Rev. 2000;1:308–313. doi: 10.1053/prrv.2000.0069. [DOI] [PubMed] [Google Scholar]
- Künzli N, Lurmann F, Segal M, et al. Association between lifetime ambient ozone exposure and pulmonary function in college freshmen – results of a pilot study. Environ Res. 1997;72:8–23. doi: 10.1006/enrs.1996.3687. [DOI] [PubMed] [Google Scholar]
- Lee D, Fanucchi MV, Plopper CG, et al. Pulmonary architecture in the conducting regions of six rats. Anat Rec. 2008a;291:916–926. doi: 10.1002/ar.20726. [DOI] [PubMed] [Google Scholar]
- Lee D, Park SS, Ban-Weiss GA, et al. Bifurcation model for characterization of pulmonary architecture. Anat Rec. 2008b;291:379–389. doi: 10.1002/ar.20643. [DOI] [PubMed] [Google Scholar]
- Lee D, Wallis C, Wexler AS, et al. Small particles disrupt postnatal airway development. J Appl Physiol. 2010;109:1115–1124. doi: 10.1152/japplphysiol.00295.2010. [DOI] [PMC free article] [PubMed] [Google Scholar]
- Majumdar A, Alencar AM, Buldyrev SV, et al. Relating airway diameter distributions to regular branching asymmetry in the lung. Phys Rev Lett. 2005;95:168101. doi: 10.1103/PhysRevLett.95.168101. [DOI] [PubMed] [Google Scholar]
- Mauad T, Rivero DH, De Oliveira RC, et al. Chronic exposure to ambient levels of urban particles affects mouse lung development. Am J Respir Crit Care Med. 2008;178:721–728. doi: 10.1164/rccm.200803-436OC. [DOI] [PMC free article] [PubMed] [Google Scholar]
- Mauderly JL. Animal models for the effect of age on susceptibility to inhaled particulate matter. Inhal Toxicol. 2000;12:863–900. doi: 10.1080/08958370050123216. [DOI] [PubMed] [Google Scholar]
- Mauderly JL, Bice DE, Carpenter RL, et al. Effects of inhaled nitrogen dioxide and diesel exhaust on developing lung. Res Rep Health Eff Inst. 1987;8:3–37. [PubMed] [Google Scholar]
- Mizuuchi T, Kida K, Fujino Y. Morphological studies of growth and aging in the lungs of Fischer 344 male rats. Exp Gerontol. 1994;29:553–567. doi: 10.1016/0531-5565(94)90038-8. [DOI] [PubMed] [Google Scholar]
- Peters JM, Avol E, Gauderman WJ, et al. A study of twelve southern California communities with differing levels and types of air pollution. II. Effects on pulmonary function. Am J Respir Crit Care Med. 1999;159:768–775. doi: 10.1164/ajrccm.159.3.9804144. [DOI] [PubMed] [Google Scholar]
- Phalen RF, Mendez LB. Dosimetry considerations for animal aerosol inhalation studies. Biomarkers. 2009;14(Suppl. 1):63–66. doi: 10.1080/13547500902965468. [DOI] [PMC free article] [PubMed] [Google Scholar]
- Phalen RF, Oldham MJ, Beaucage CB, et al. Postnatal enlargement of human tracheobronchial airways and implications for particle deposition. Anat Rec. 1985;212:368–380. doi: 10.1002/ar.1092120408. [DOI] [PubMed] [Google Scholar]
- Phillips CG, Kaye SR. Diameter-based analysis of the bronchial geometry of four mammalian bronchial trees. Respir Physiol. 1995;102:303–316. doi: 10.1016/0034-5687(95)00056-9. [DOI] [PubMed] [Google Scholar]
- Pinkerton KE, Barry BE, O'Neil JJ, et al. Morphologic changes in the lung during the lifespan of Fischer 344 rats. Am J Anat. 1982;164:155–174. doi: 10.1002/aja.1001640206. [DOI] [PubMed] [Google Scholar]
- Pope CA, III, Burnett RT, Thurston GD, et al. Cardiovascular mortality and long-term exposure to particulate air pollution: epidemiological evidence of general pathophysiological pathways of disease. Circulation. 2004;109:71–77. doi: 10.1161/01.CIR.0000108927.80044.7F. [DOI] [PubMed] [Google Scholar]
- Pullen AH. A parametric analysis of the growing CFHB (Wister) rat. J Anat. 1976;121:371–383. [PMC free article] [PubMed] [Google Scholar]
- Raabe OG, Yeh HC, Schum GM, et al. Tracheobronchial Geometry: Human, Dog, Rat, Hamster. LF-53. Albuquerque, NM: Lovelace Foundation for Medical Education and Research; 1976. [Google Scholar]
- Rao L, Tiller C, Coates C, et al. Lung growth in infants and toddlers assessed by multi-slice computed tomography. Acad Radiol. 2010;17:1128–1135. doi: 10.1016/j.acra.2010.04.012. [DOI] [PMC free article] [PubMed] [Google Scholar]
- Rojas-Martinez R, Perez-Padilla R, Olaiz-Fernandez G, et al. Lung function growth in children with long-term exposure to air pollutants in Mexico City. Am J Respir Crit Care Med. 2007;176:377–384. doi: 10.1164/rccm.200510-1678OC. [DOI] [PubMed] [Google Scholar]
- Sera T, Fujioka H, Yokota H, et al. Three-dimensional visualization and morphometry of small airways from microfocal X-ray computed tomography. J Biomech. 2003;36:1587–1594. doi: 10.1016/s0021-9290(03)00179-9. [DOI] [PubMed] [Google Scholar]
- Tawhai MH, Hunter P, Tschirren J, et al. CT-based geometry analysis and finite element models of the human and ovine bronchial tree. J Appl Physiol. 2004;97:2310–2321. doi: 10.1152/japplphysiol.00520.2004. [DOI] [PubMed] [Google Scholar]
- Weibel ER. Morphometry of the Human Lung. New York: Academic Press; 1963. [Google Scholar]
- Yeh HC, Schum GM, Duggan MT. Anatomic models of the tracheobronchial and pulmonary regions of the rat. Anat Rec. 1979;195:483–492. doi: 10.1002/ar.1091950308. [DOI] [PubMed] [Google Scholar]


